Home Blog Page 370

ASRock Phantom Gaming B850M Riptide WiFi Review

Since the CES 2025 event, manufacturers have finally released their B850 chipset motherboards, and most have shown incredible value positioning. As we have seen in the past, the BX50 chipset boards target budget gamers while adding value-oriented features. Today, we will review the ASRock Phantom Gaming B850M Riptide WiFi mATX form factor motherboard.

We have also reviewed the ATX version of this motherboard (ASRock Phantom Gaming B850 Riptide WiFi), so if you’re looking for a bigger version, head over there!

Generally, ASRock’s PG motherboards provide better gaming performance, but let’s see how the mATX version performs in real-world scenarios.

Why Trust Tech4Gamers
  • Ali Touseef is our hardware reviewer who tests and reviews different components, including coolers, RAM, motherboards, and processors.
  • 40+ motherboards tested and reviewed by our team of hardware experts (Tech4Gamers Team).
  • 800+ hours spent testing different motherboards for our reviews.
  • Objective testing criteria (See how we test motherboards).

At Tech4Gamers, ensuring you get reliable information is our priority. That’s why every hardware round-up undergoes a meticulous review process by our team of experts and editors. Each review is carefully examined against our strict editorial guidelines, guaranteeing you trustworthy insights you can depend on.


Key Takeaways

  • The ASRock Phantom Gaming B850M Riptide WiFi is a mid-range motherboard with a $189 price tag. It includes a PCIe 5.0 x16 slot, an M.2 PCIe 5.0 x4 slot, WiFi 7, Bluetooth 5.4, and more.
  • It’s a great choice for anyone who wants a slightly trimmed-down version of an X870 motherboard at half the price.
  • You should keep away if you need the USB 3.2 Gen2x2 Type-C port.

These are the on-paper specifications of the motherboard:

ASRock Phantom Gaming B850M Riptide WiFi Specifications
CPU Support AMD Ryzen 7000, Ryzen 8000, Ryzen 9000
Memory Support DDR5 8,000MHz
PCIe Slots 1x PCIe 5.0 x16, 1x PCIe 4.0 x4, 1x vertical M.2 socket
M.2 Slots 1x PCIe 5.0 x4, 1x PCIe 4.0 x2, 1x PCIe 4.0 x4
SATA Ports 4x 6Gbps
Audio Realtek ALC1220 Audio Codec
Network & Connectivity 1x 2.5G LAN, 1x 802.11be 2×2 WiFi 7, Bluetooth 5.4
USB Ports 17 ports, including 1x USB 3.2 Gen2 Type-C (Rear)
Size mATX Form Factor: 244mm x 244mm
MSRP $189

You can expect a few changes from the previous-gen chipset, with the B850M Riptide WiFi providing WiFi 7, Bluetooth 5.4, a PCIe Gen 5 x16 expansion slot, and a PCIe Gen 5 x4 M.2 slot. It’s upsetting to see 2.5G LAN being reused and the absence of a USB 3.2 Gen2x2 Type-C port, let alone having USB4.

[toc]

Packaging & Unboxing

Following the B850 Riptide, the B850M Riptide WiFi also features a blue design, a major color shift from the previous gen B650E PG ITX motherboard. It’s a good shift, as I feel the blue targets gamers more.

ASRock B850M Riptide WiFi box
ASRock B850M Riptide WiFi box. (Image By Tech4Gamers)

The front of the box only showcases the main design and name of the board, with a few labels at the bottom. Here are the extra goodies you can find in the box aside from the motherboard:

ASRock Phantom Gaming B850M Riptide WiFi accessories
ASRock Phantom Gaming B850M Riptide WiFi accessories. (Image By Tech4Gamers)
  • 2x SATA Data Cables
  • 2x ASRock WiFi 2.4/5/6GHz Antennas
  • 2x Screws for M.2 Sockets
  • 1x Standoff for M.2 Socket
  • 1x Thermistor Cable
  • 1x Regulatory Notice
  • 1x User Manual

We’re provided with a few screws for the M.2 drives, a pair of 2.4/5/6GHz antennas, and 2x SATA cables. The antennas won’t really be useful if you’re utilizing WiFi 7. I wouldn’t worry too much about the screws, and I recommend keeping the user manual close by your side if you’re a new PC builder. The thermistor cable can be quite helpful if you want to keep tabs on your PC’s temperatures.

Design

ASRock Phantom Gaming B850M Riptide WiFi main design
ASRock Phantom Gaming B850M Riptide WiFi main design. (Image By Tech4Gamers)

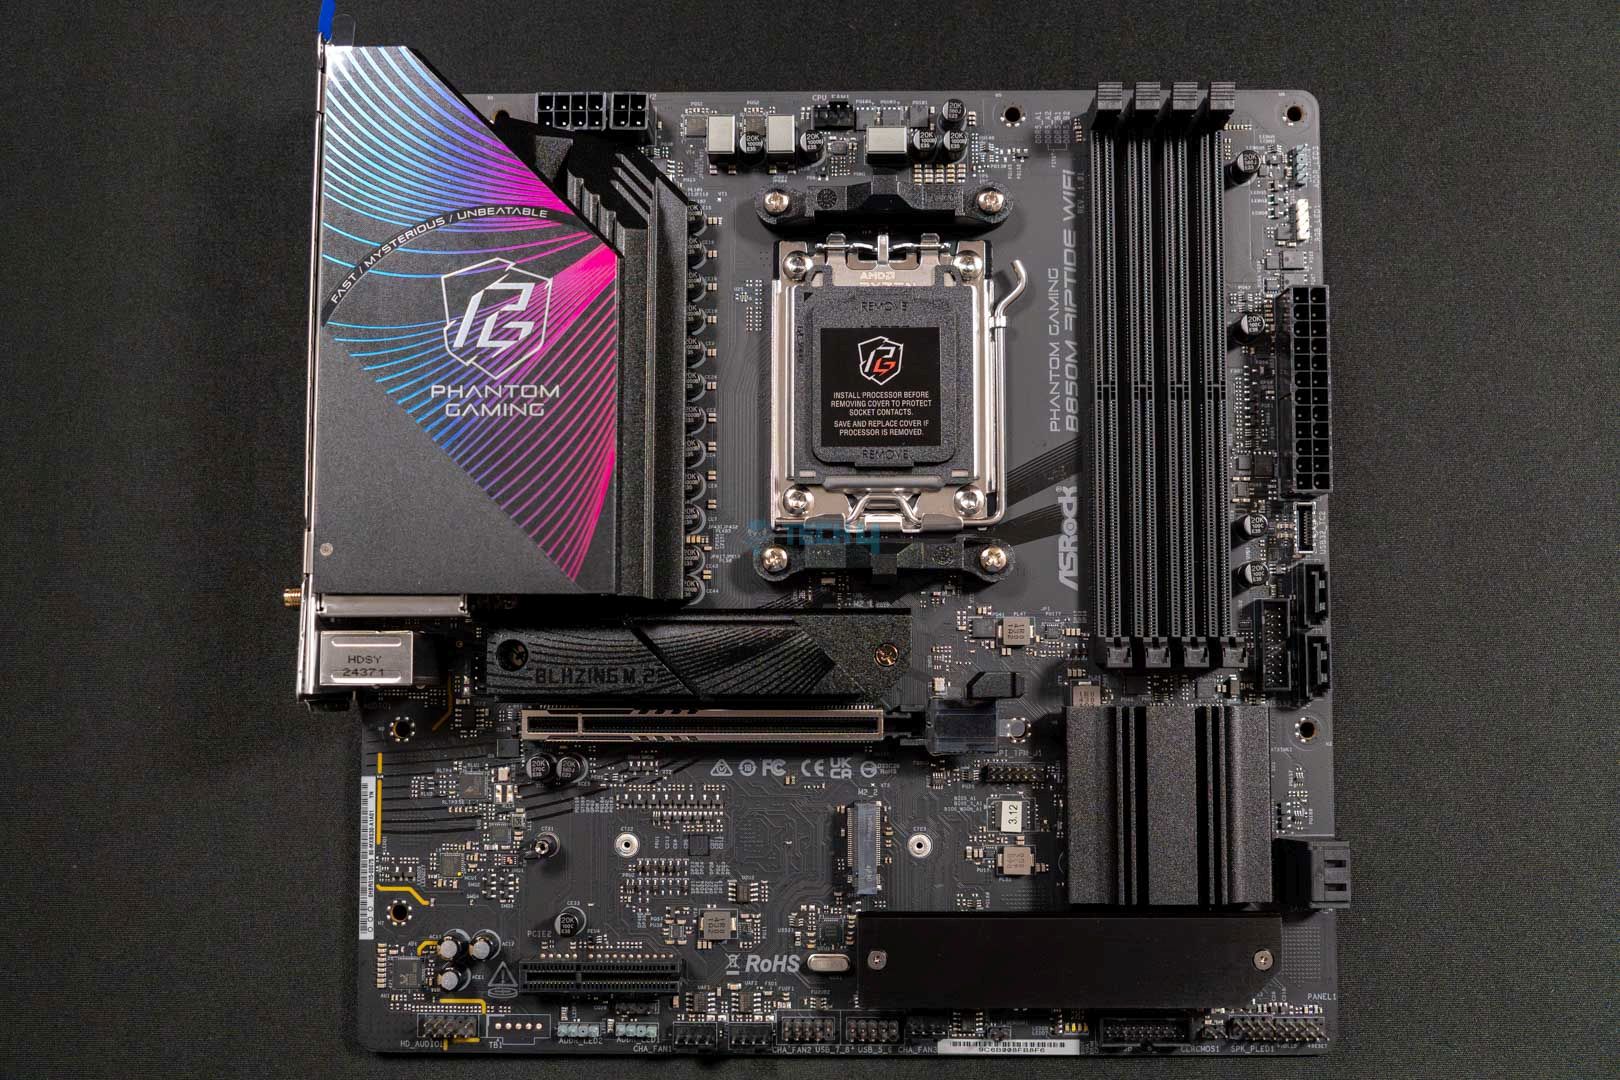
You get a sleek, black design on the motherboard with a blue accent on the I/O heatsink. It’s not filled with RGB, but you can see a faint blue hue underneath the BIOS heatsink, so that’s a good addition. You can always add more RGB to your system with other components.

This motherboard’s PCB is built on a 6-layer structure, unlike the 8-layer structure of the ATX version.

Motherboard's block design
Block design of the motherboard. (Image source: ASRock)

The block diagram makes it simple to understand what components the chipset and CPU provide power to. The CPU directly provides power to the PCIe x16 and PCIe x4 slots, along with the M.2 Gen 5 slot, the Audio Codec, and the RAM slots. Meanwhile, the chipset provides power to the rest of the M.2 slots, the LAN, WiFi, a few USB connectors, and the SATA 4 port.

Power Delivery System

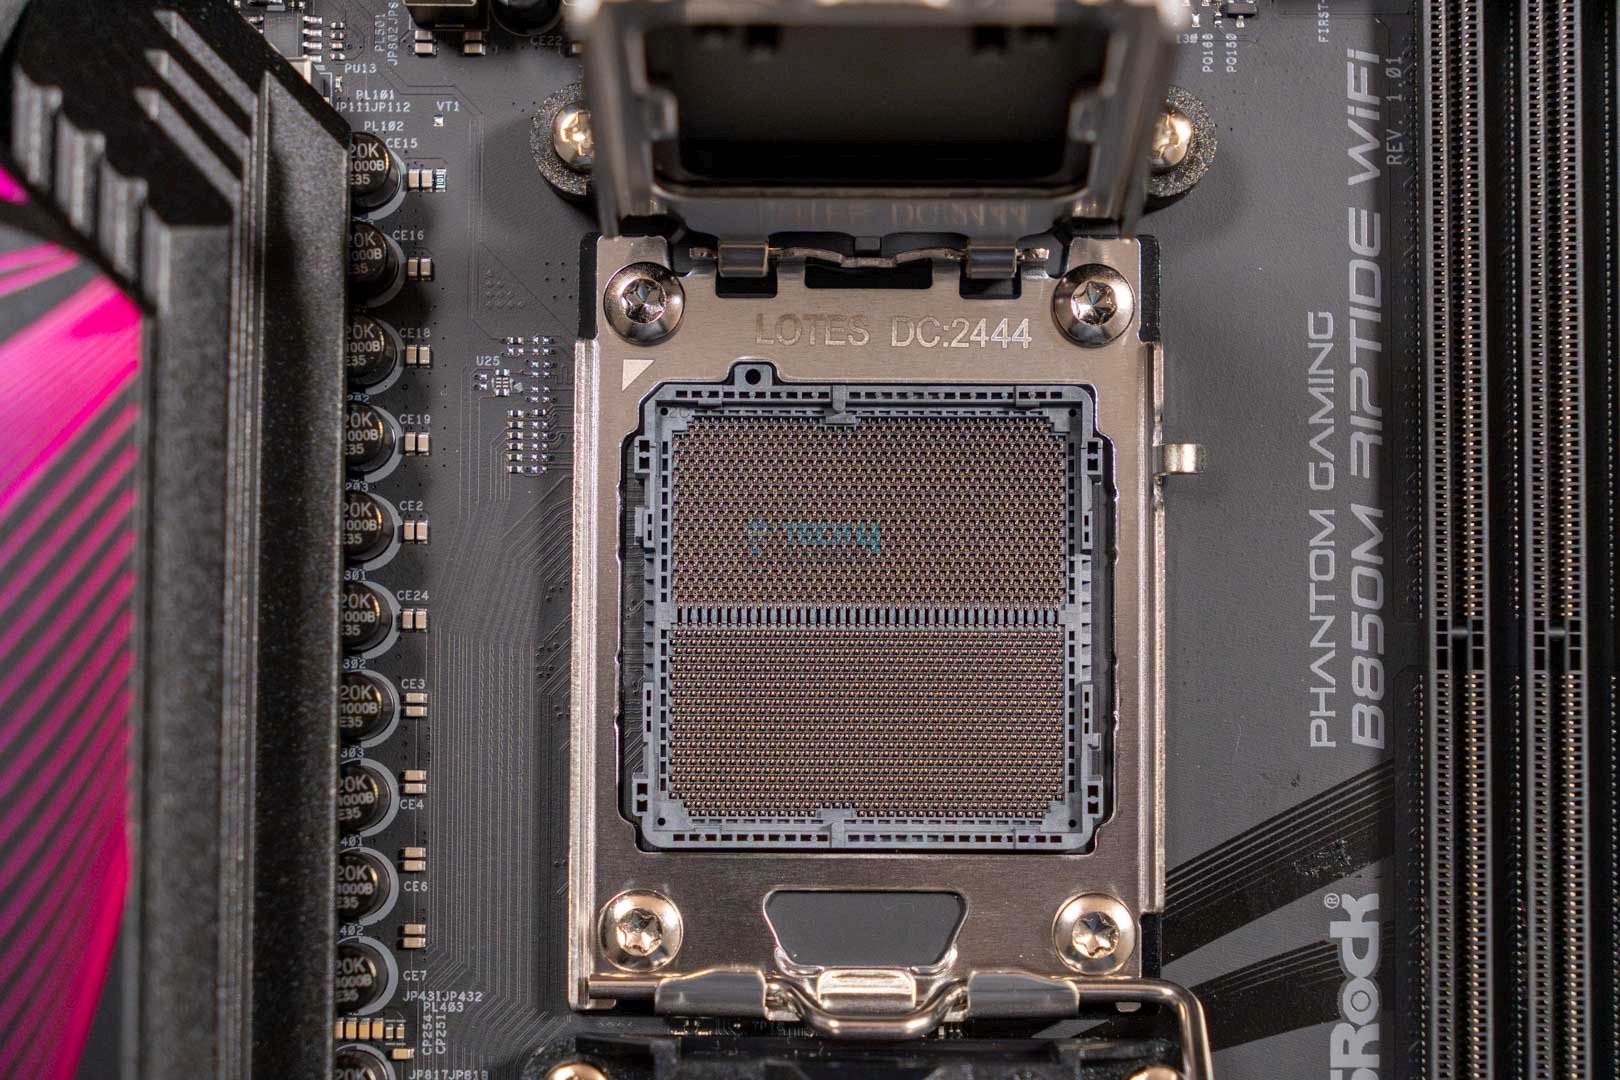
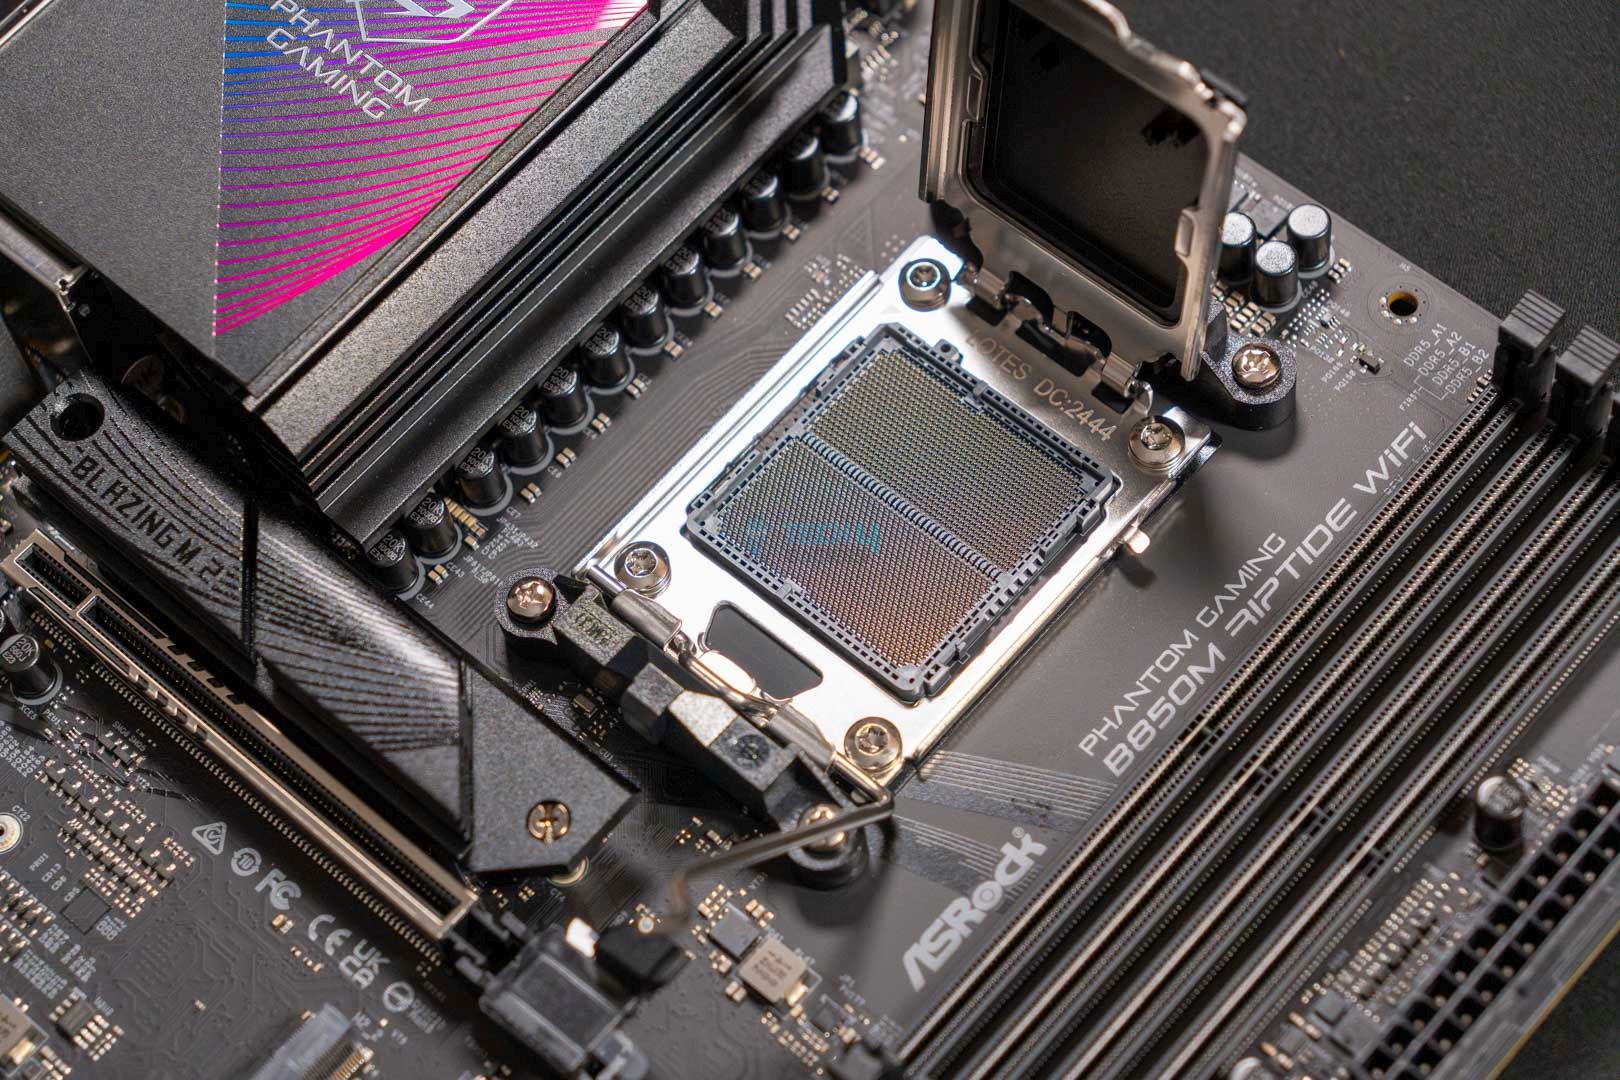
The motherboard uses the AMD AM5 LGA1718 socket, which powers the Ryzen 7000, 8000, and 9000 series CPUs. As for the VRMs, the motherboard has a 12+2+1 design with Dr.MOS SPS for VCore and SOC.

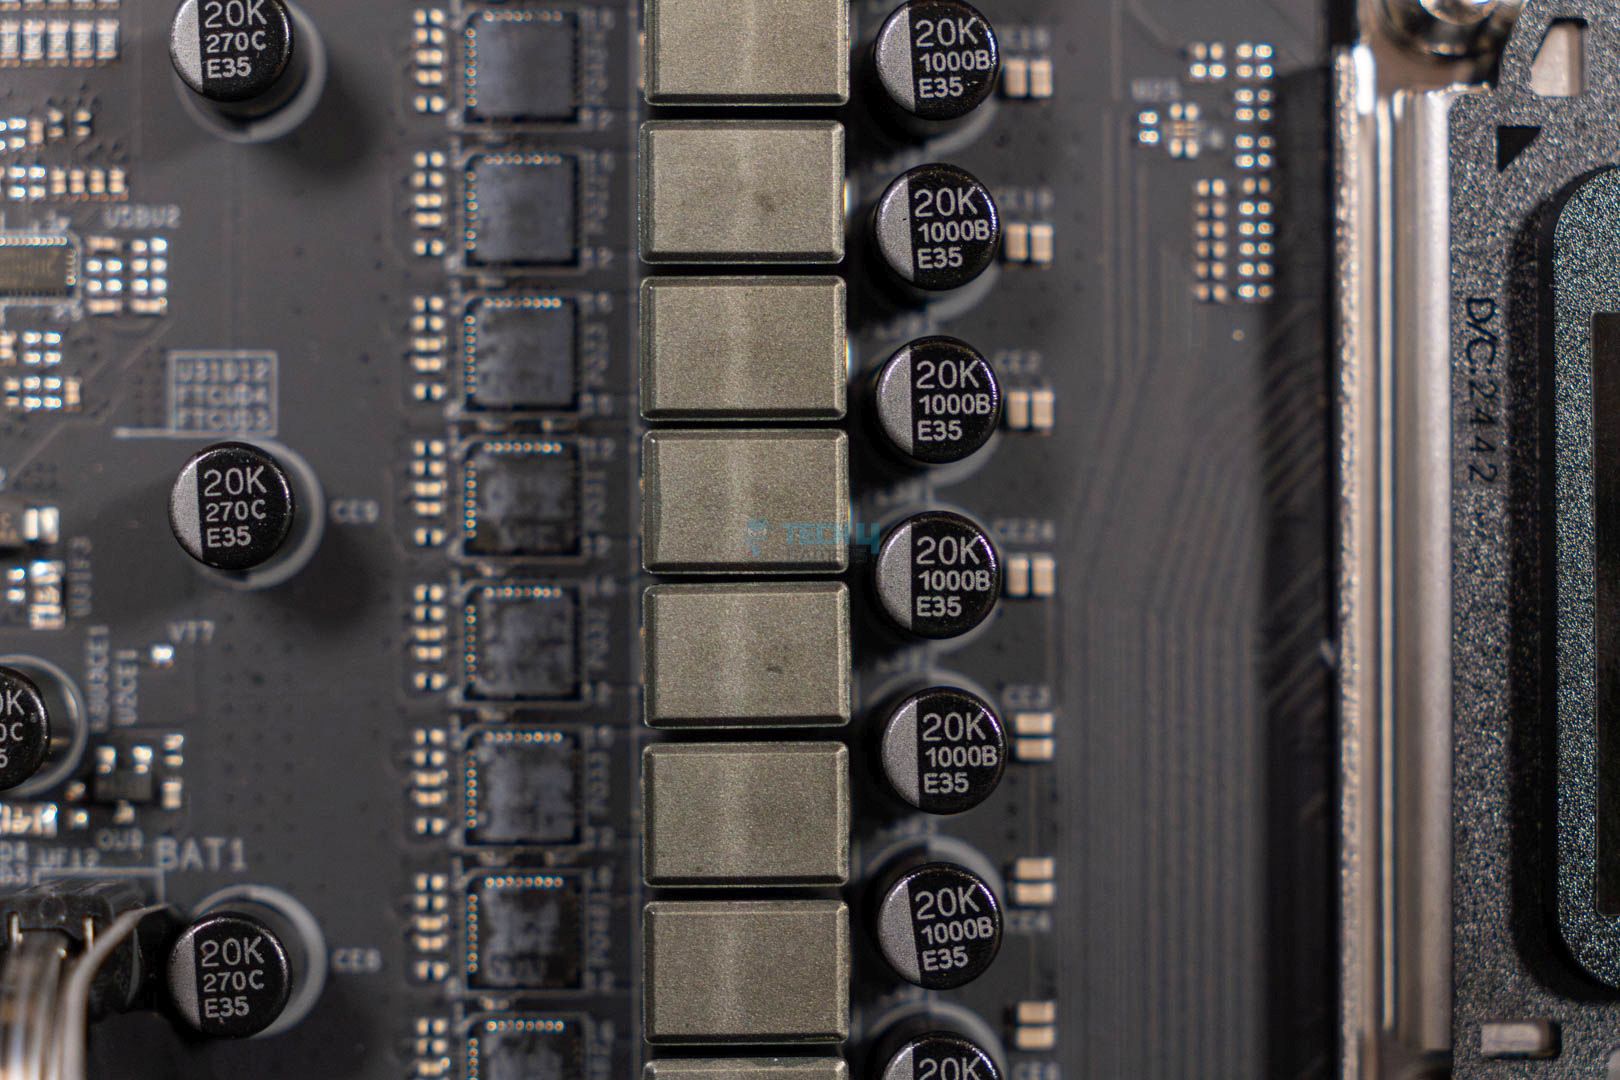
It also seems the motherboard is utilizing the exclusive 1000uF capacitors, rated for 20K capacitance and providing up to 20,000 hours of life.

CPU connector
CPU connector. (Image By Tech4Gamers)

The motherboard provides an 8-pin ATX 12V connector with a separate 4-pin ATX 12V connector. These connectors utilize ASRock’s Hi-Density Power feature, which can withstand higher current loads, making overclocking more efficient and reducing system instability issues.

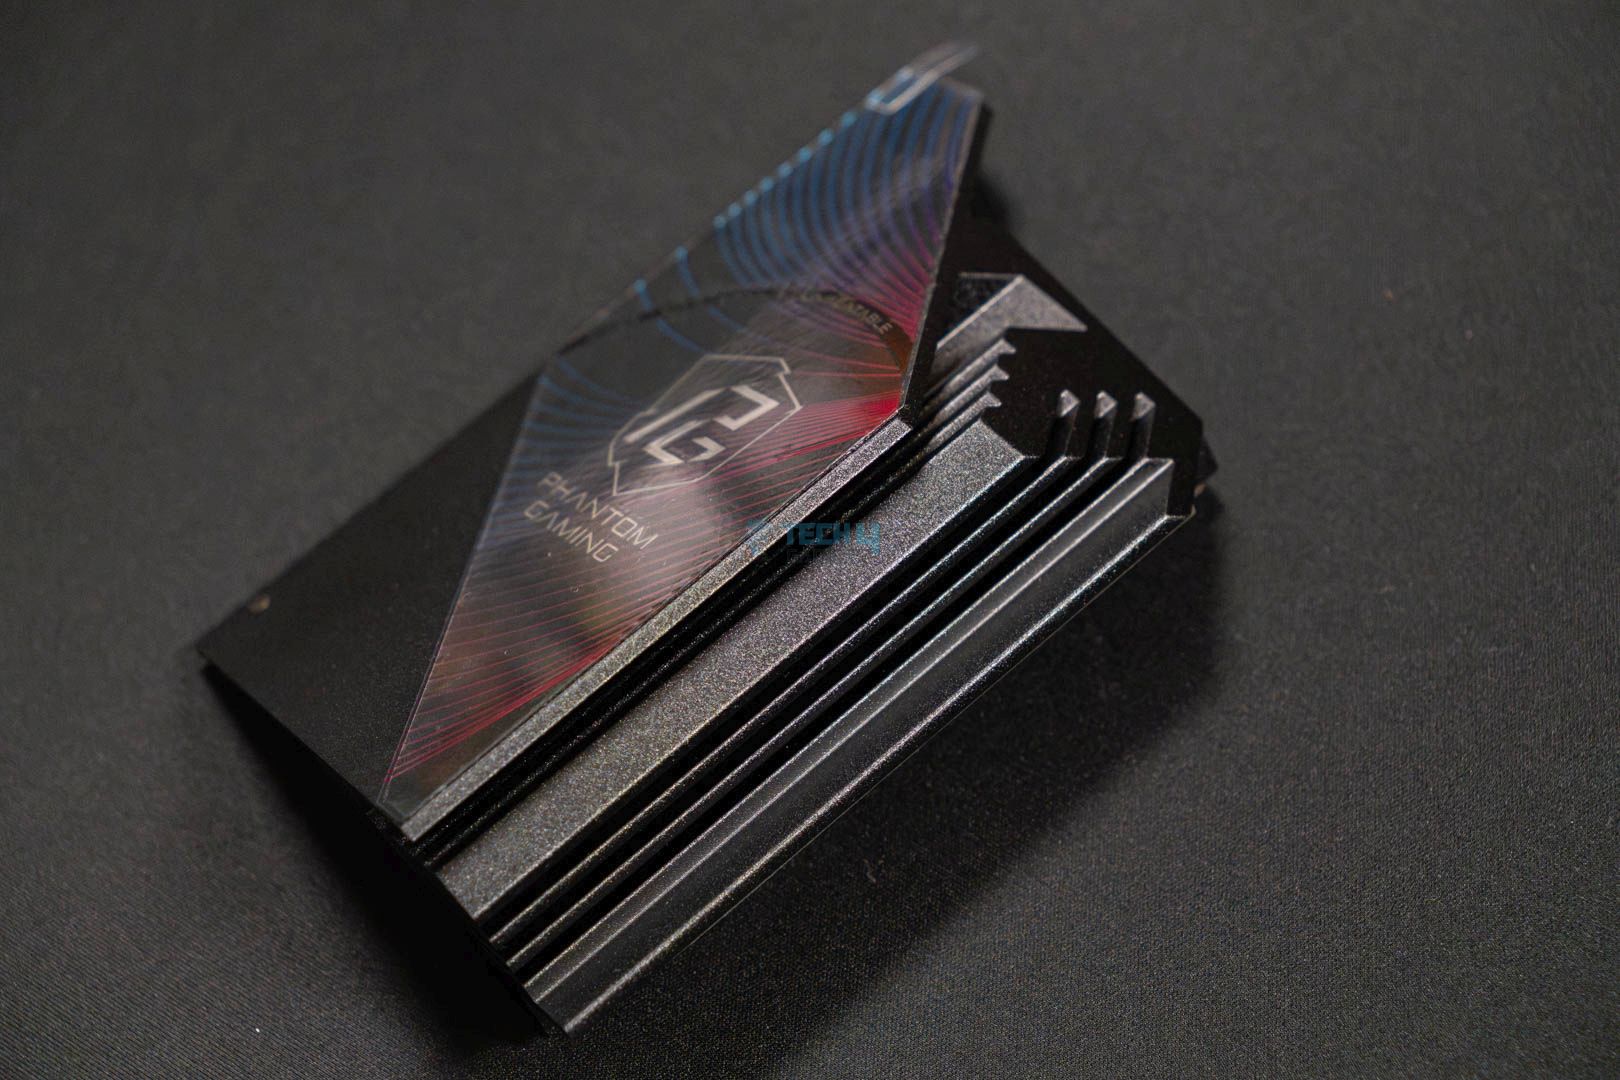
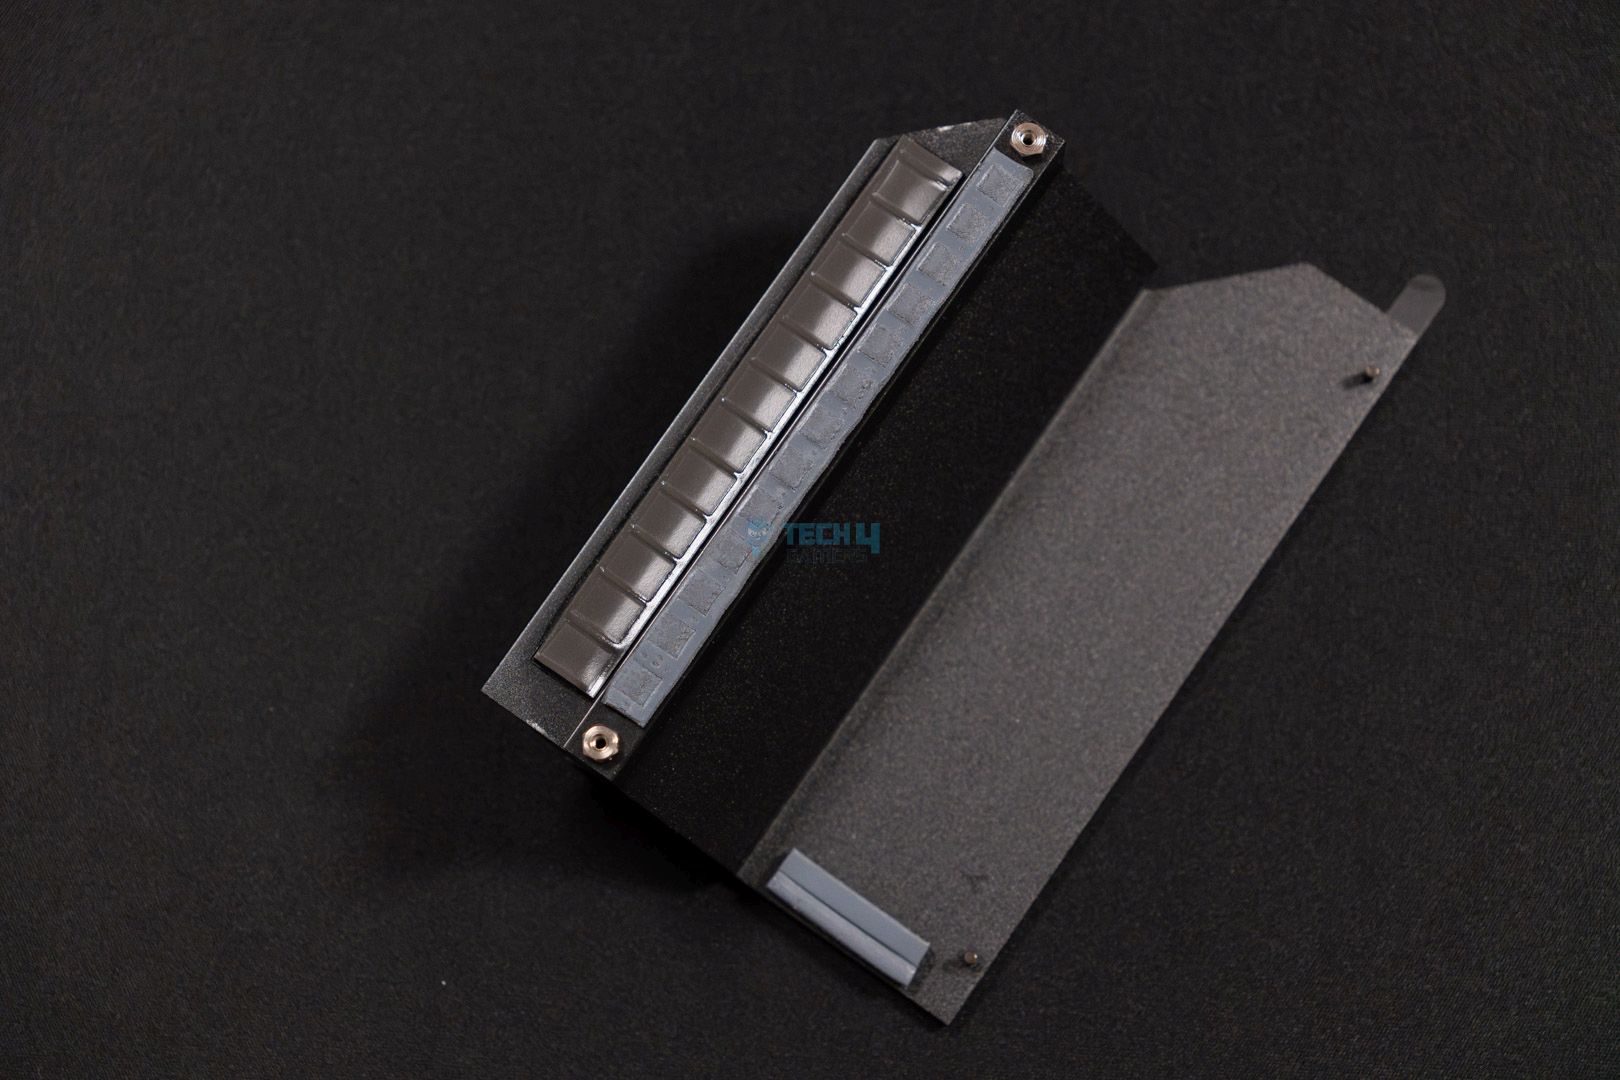
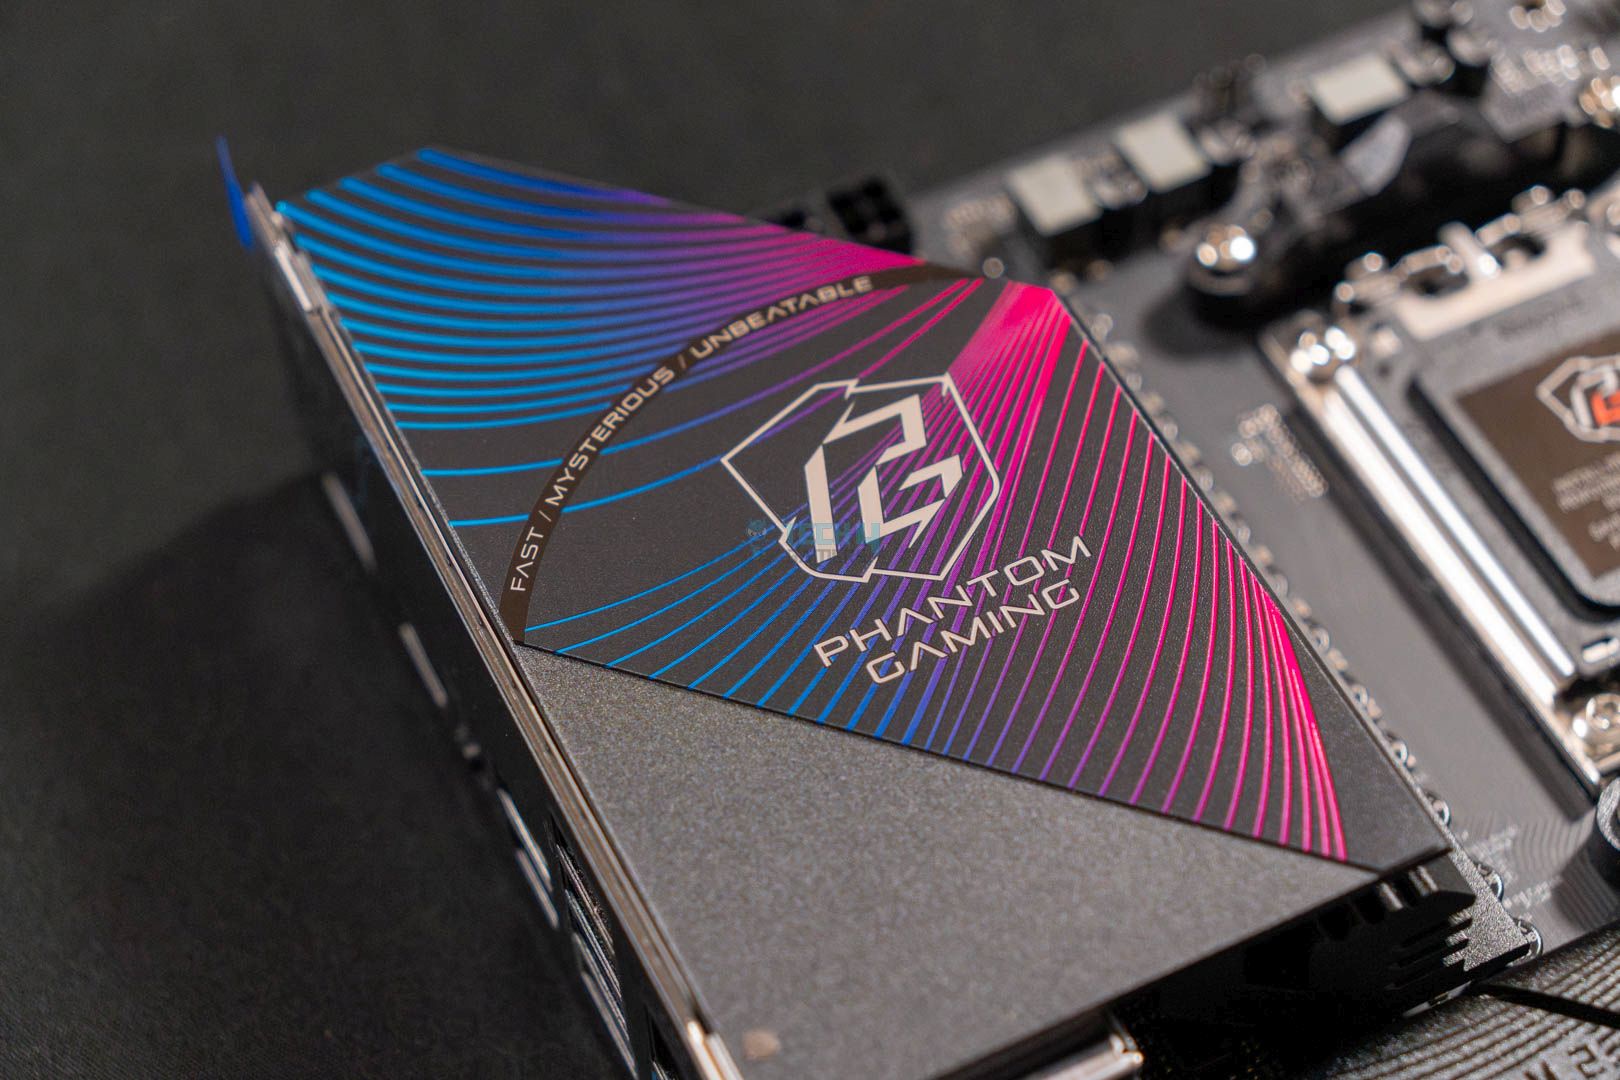
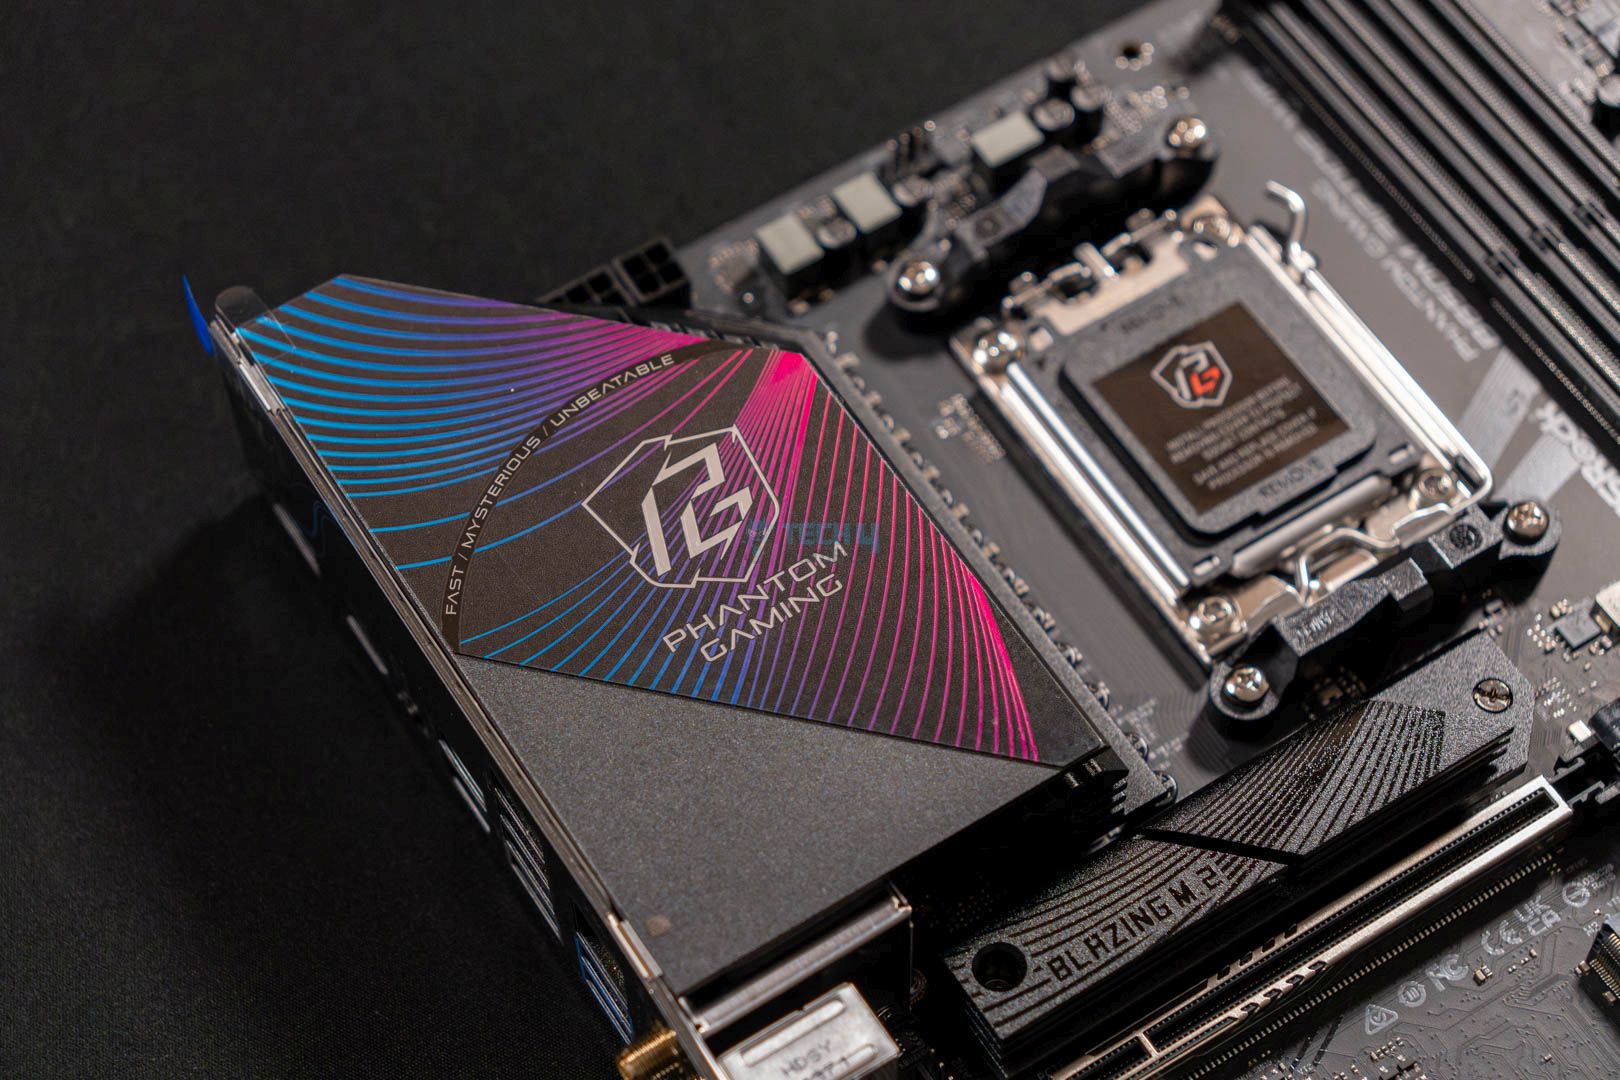
The aluminum heatsink shows a stacked-fin design with plenty of thermal pads to keep the I/Os and VRMs cool. We see a blue gradient Phantom Gaming sticker on the heatsink, merged together with a sleek, fully-black design.

DIMM Slots

Although it’s a mATX motherboard, ASRock has done well incorporating 4x DIMM slots with a maximum capacity of 256GB and a maximum transfer speed of 8,000MHz. It’s good to see multi-RAM support for XMP and EXPO-enabled kits, making the shift easier for gamers.

For the most part, you won’t face any RAM compatibility issues with the CPU cooler because the DIMM slots are farther apart from the socket. I advise against buying very tall RAM kits with a big air cooler, though, as they could cause issues.
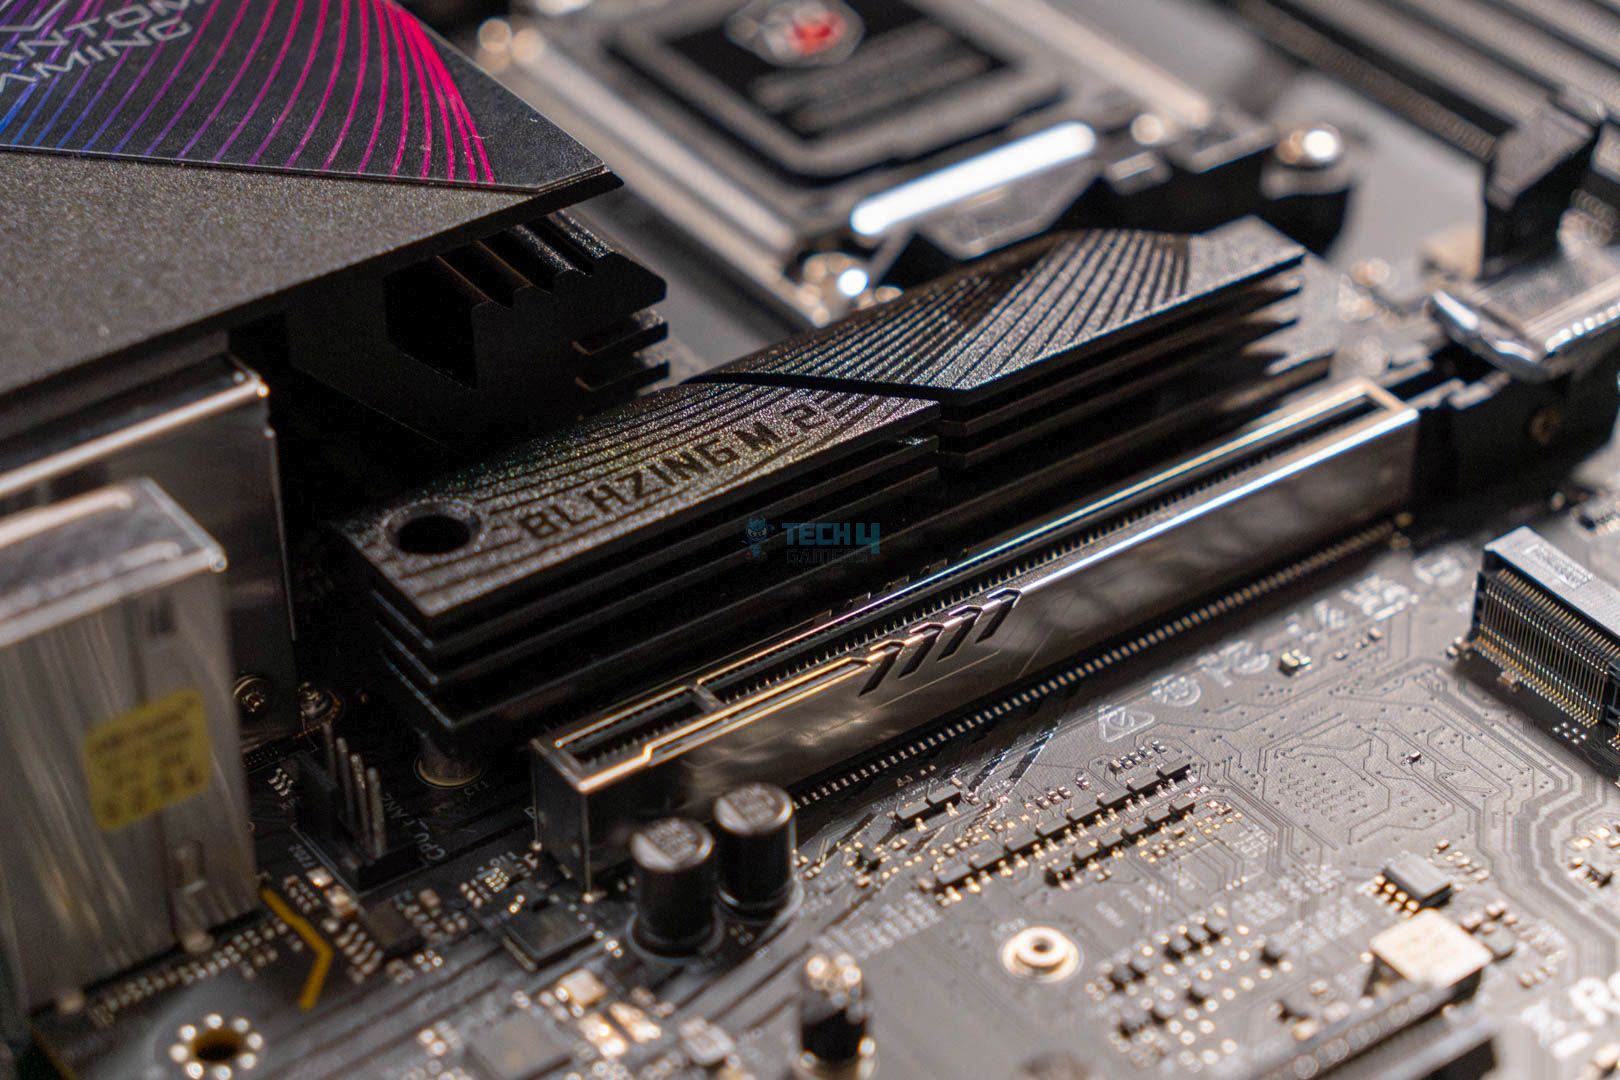
PCIe Slots

The ASRock Phantom Gaming B850M Riptide WiFi motherboard has two PCIe slots. The PCIe1 slot is Gen 5.0 x16 for the graphics card, and the secondary PCIe slot is Gen 4.0 x4, mainly useful for M.2 expansion cards. In addition to these two, we also see a vertical M.2 socket that supports WiFi and Bluetooth expansion cards.

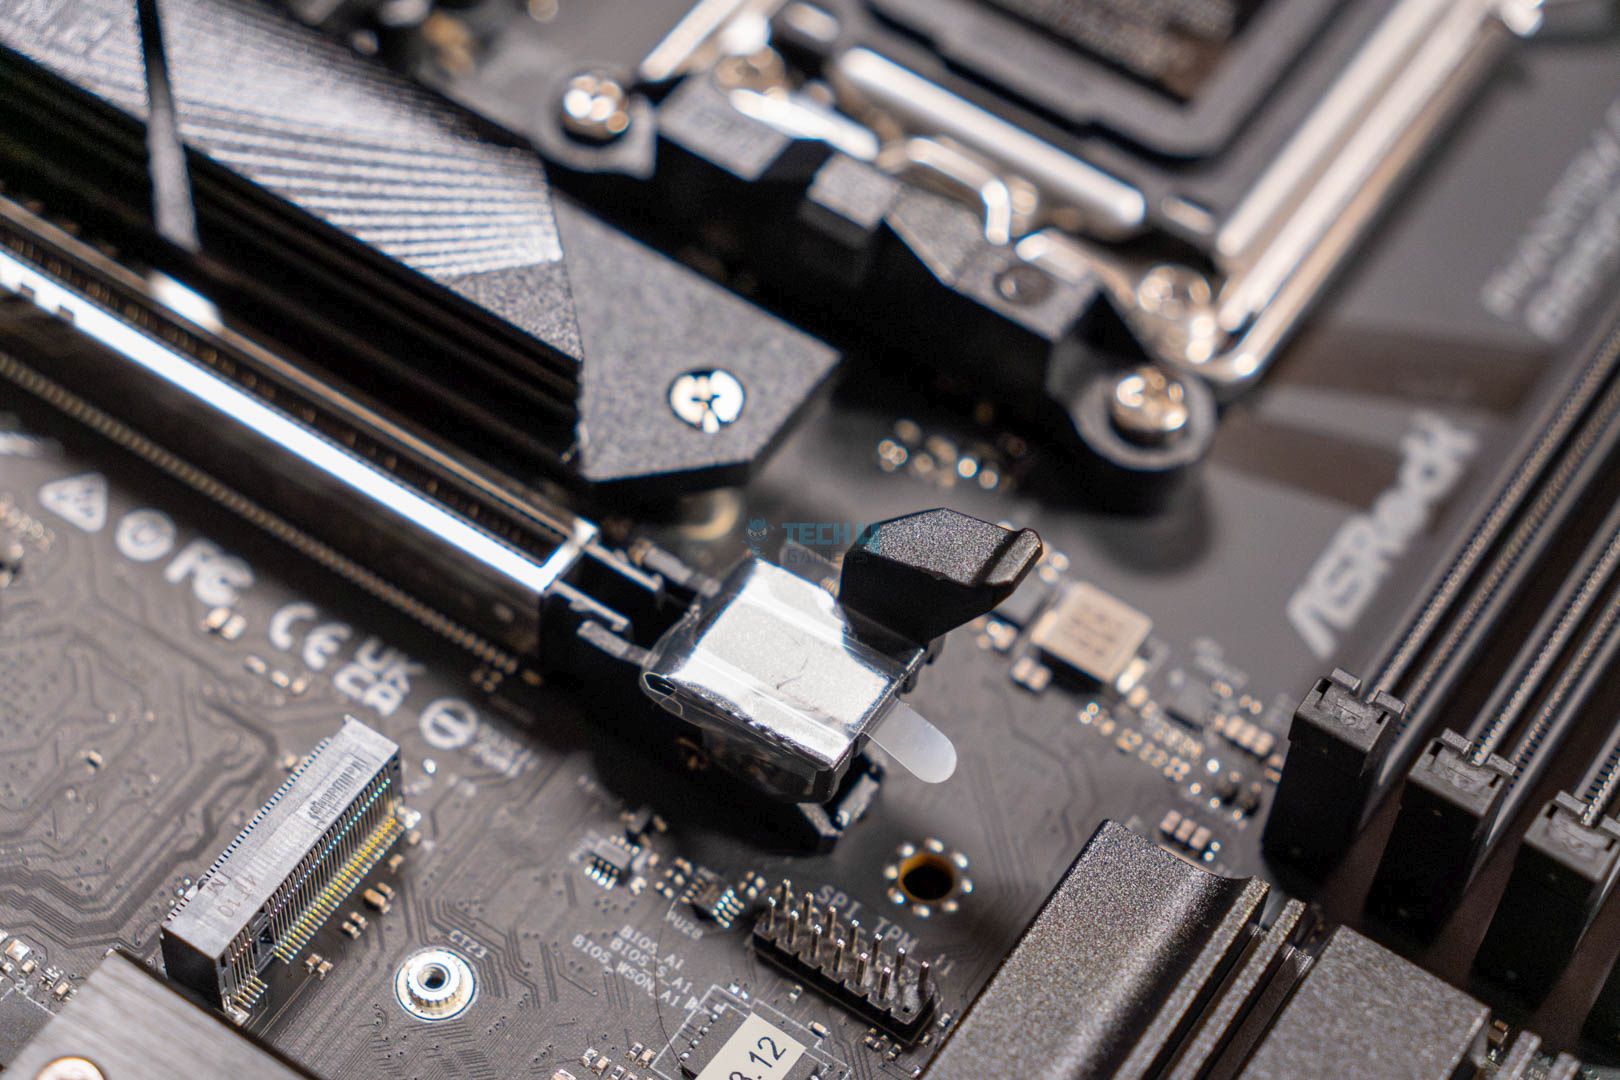
We also notice a GPU EZ Latch on the PCIe1 slot to make GPU installation and removal much easier than before. Keep the latch pressed and pull the GPU out of the slot.

Storage

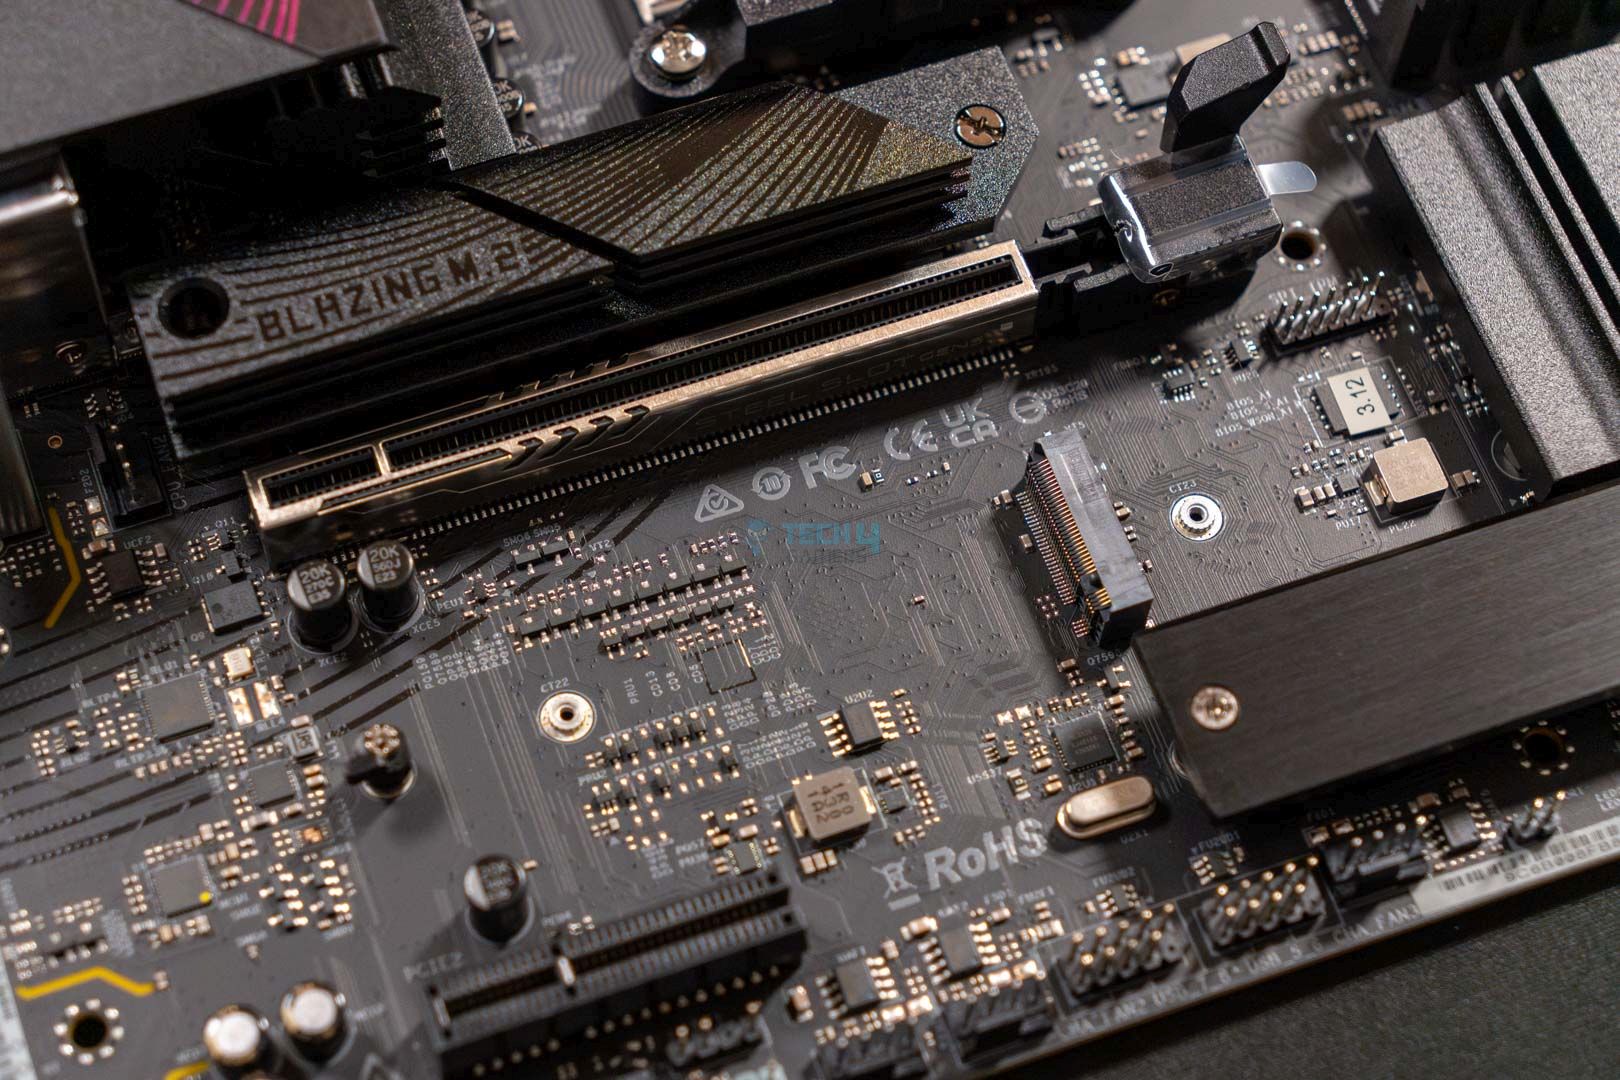
The motherboard has three M.2 slots: M2_1, a PCIe Gen 5.0 x4 slot; M2_2, a PCIe Gen 4.0 x2 slot; and M2_3, a PCIe Gen 4.0 x4 slot. The M2_1 should be your priority slot, housing your fastest and most important NVMe M.2 SSD. Support for 3x M.2s in a mATX motherboard is impressive, so we applaud ASRock for this move. In addition to M.2 support, the motherboard supports 4x SATA drives to ensure you don’t run out of storage.

All storage devices support RAID 0, RAID 1, and RAID 10. However, to support RAID 10 on the M.2s, you need to install an additional NVMe M.2 expansion card.

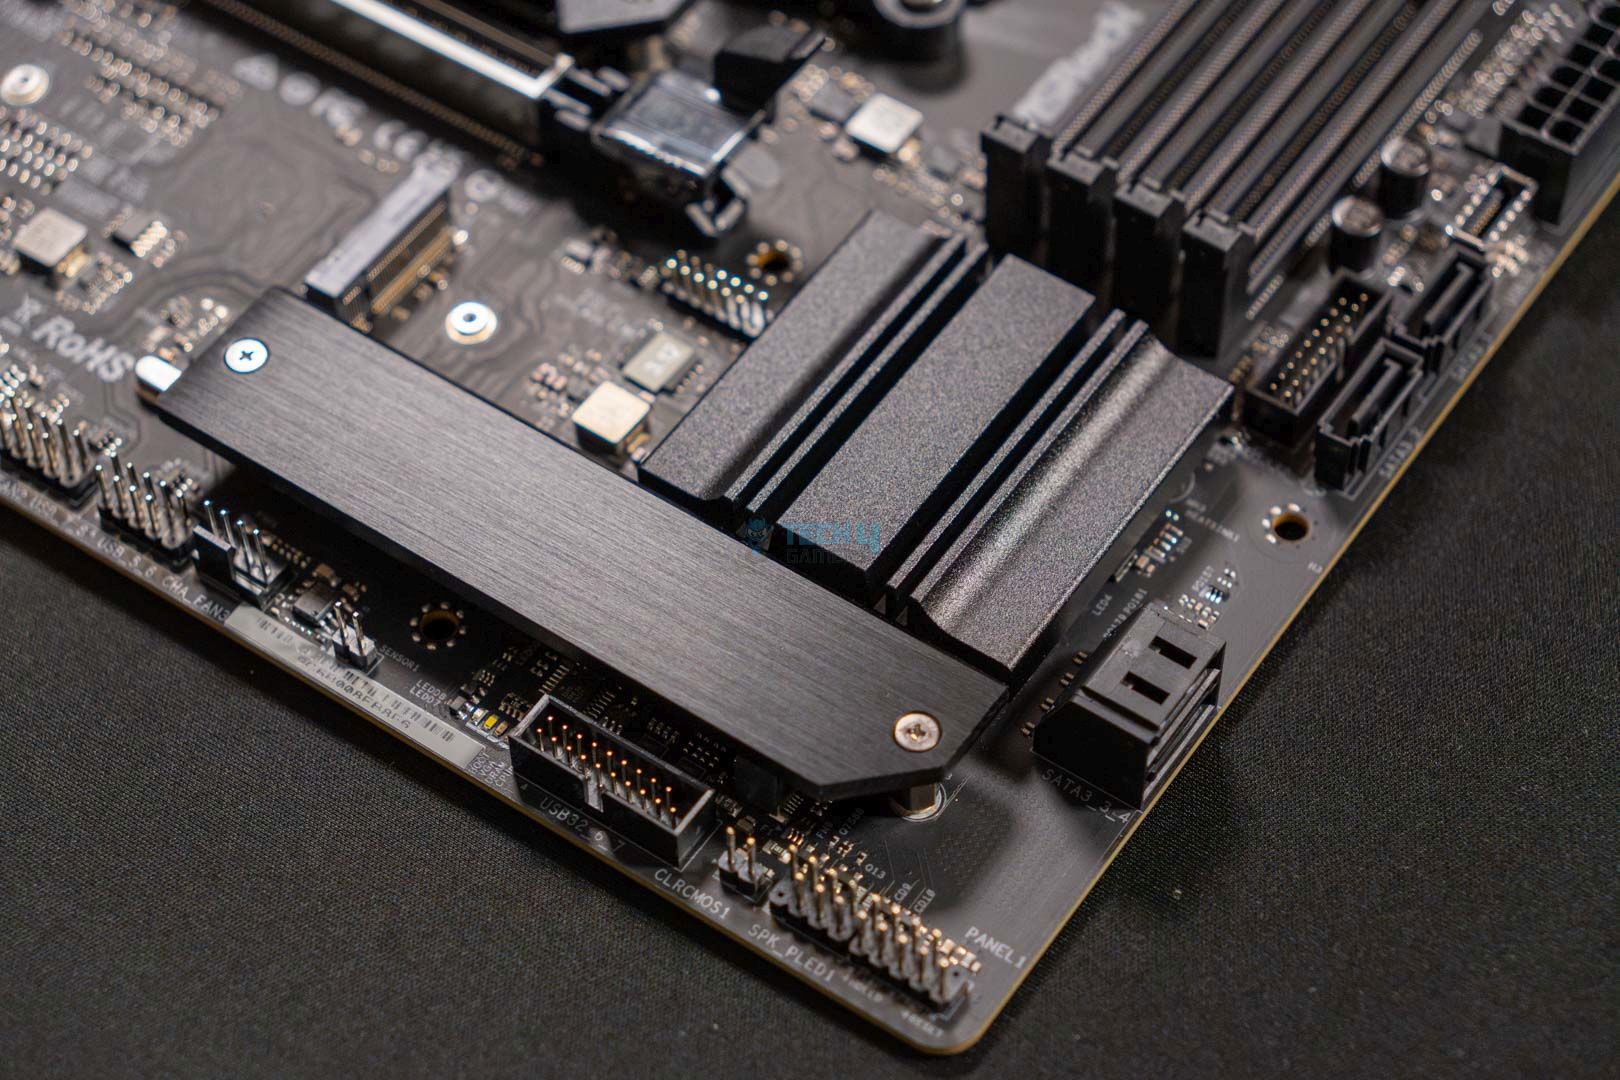
The M.2 heatsinks have a toolless design and a quick-release mechanism on the motherboard, streamlining the PC-building process even for beginners. It seems ASRock hasn’t added the anti-drop screw design we saw on the ATX version, so that’s a bummer.

The motherboard supports these M.2 types:

  • M2_1: 2280
  • M2_2, M2_3: 2260/2280

Two heatsinks cover two of three M.2 SSDs, while the M2_2 is not provided with a heatsink. Considering it’s only a PCIe Gen 4.0 x2 slot, we doubt it’d require a heatsink anyway, but it’s still slightly disappointing. Here’s a glimpse of how the motherboard looks like with all the heatsinks removed:

Exposing the M.2 heatsinks
Exposing the M.2 heatsinks of the motherboard. (Image By Tech4Gamers)

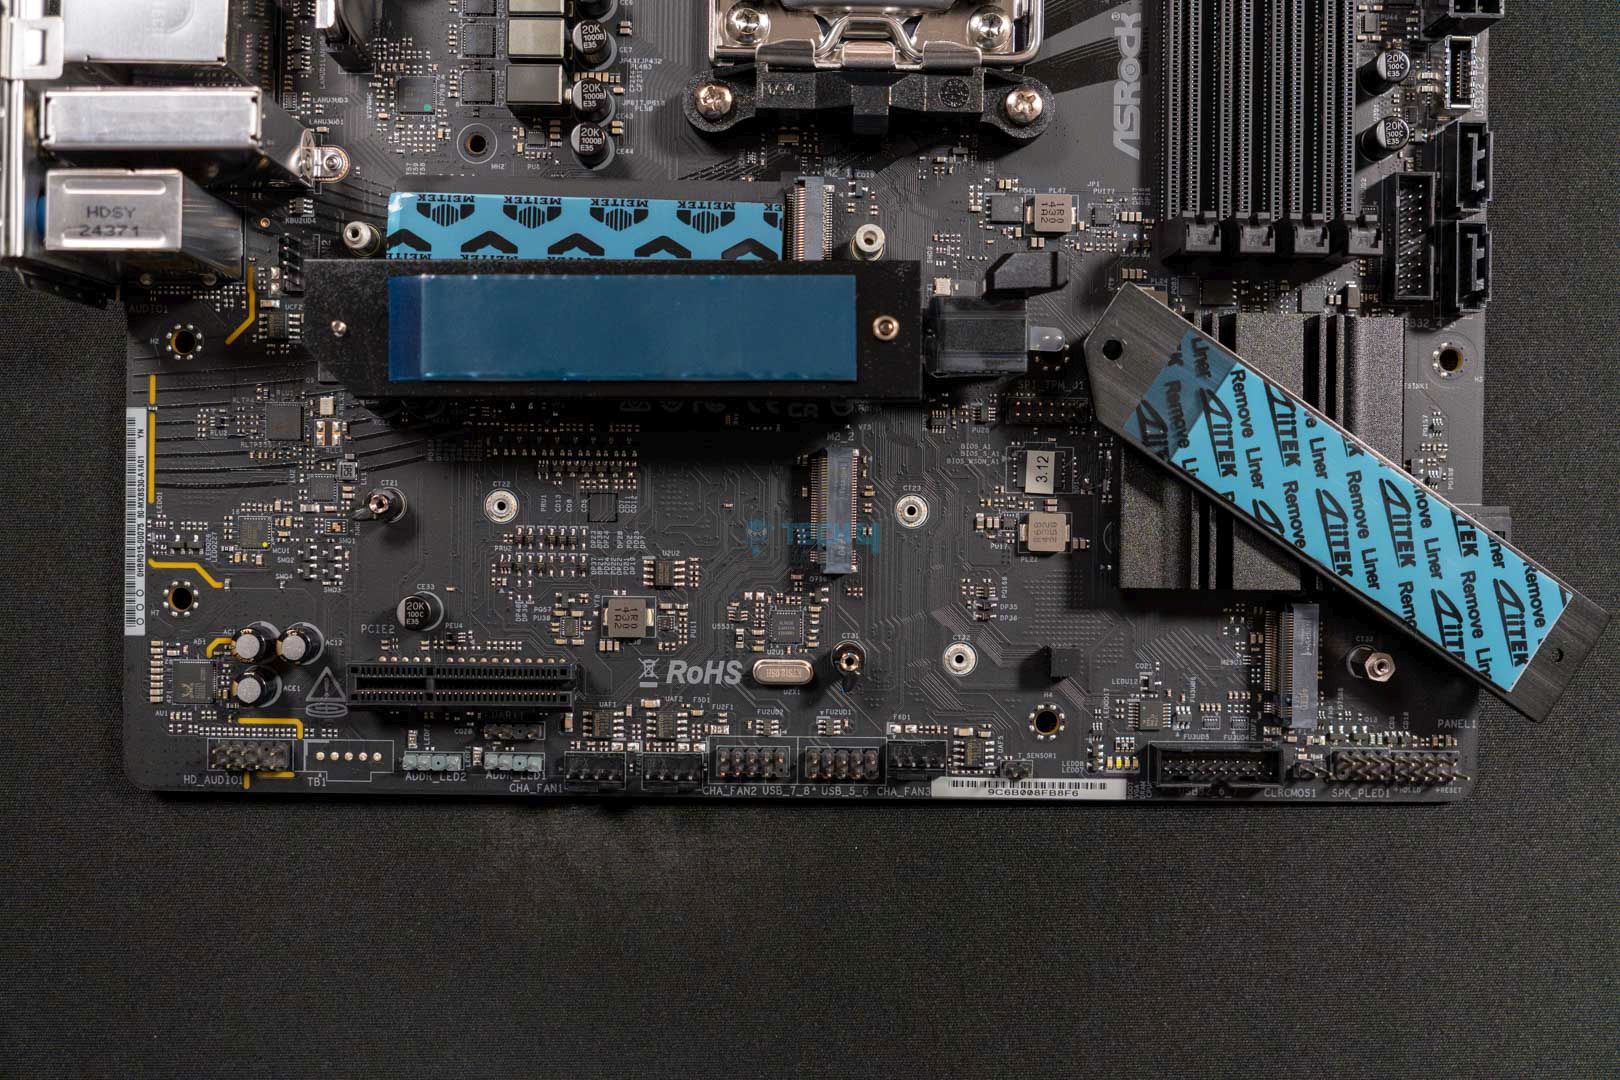
The PCIe Gen 5.0 x4 M.2 heatsink has a double-sided thermal pad, so that’s a good sight. I would have preferred if the M2_3 slot received the same treatment, but that’s fine. At the very least, you won’t have to worry about the temperatures on your NVMe M.2 SSDs.

USB Connectivity

The ASRock B850M Riptide WiFi offers a total of 17x USB ports:

  • 1x USB 3.2 Gen2 Type-C (Rear)
  • 1x USB 3.2 Gen2 Type-A (Rear)
  • 2x USB 3.2 Gen1 Type-A (Rear)
  • 1x USB 3.2 Gen1 Type-C (Front)
  • 4x USB 3.2 Gen1 Type-A (Front)
  • 4x USB 2.0 (Front)
  • 4x USB 2.0 (Rear)

Although USB4 and USB 3.2 Gen2x2 Type-C are supported on the B850 chipset, it seems ASRock has opted otherwise for cost concerns. The fastest USB port on this motherboard is the USB 3.2 Gen2 Type-C, located on the rear.

Network & Connectivity

Like its ATX variant, the B850M has 2.5G LAN, making it a slight disappointment. The wireless connectivity options are good, supporting WiFi 7 and Bluetooth 5.4. ASRock has opted to provide a Multi-Link Operation (MLO) feature, which enables the simultaneous use of multiple bands and channels, boosting overall internet speed while reducing latency.

Audio Solution

The motherboard uses the mid-range Realtek ALC1082 audio codec. I would have loved the ALC4082, but the ALC1082 is also fine with its clear audio quality. ASRock has utilized Steelseries’ Nahimic Audio software to help enhance audio quality. You can expect static noise suppression, echo cancellation, lateral sound cancellation, and voice stabilization.

The individual PCB layers for the right and left audio channels help provide clear audio because the audio jack is in a separate framework. The rear output port also features impedance sensing, which is another decent feature for clearing out lousy audio.

Internal Connectors And Components

These are all the connectors on the motherboard:

  • 1x SPI TPM header
  • 1x thermistor cable header
  • 1x power LED and speaker header
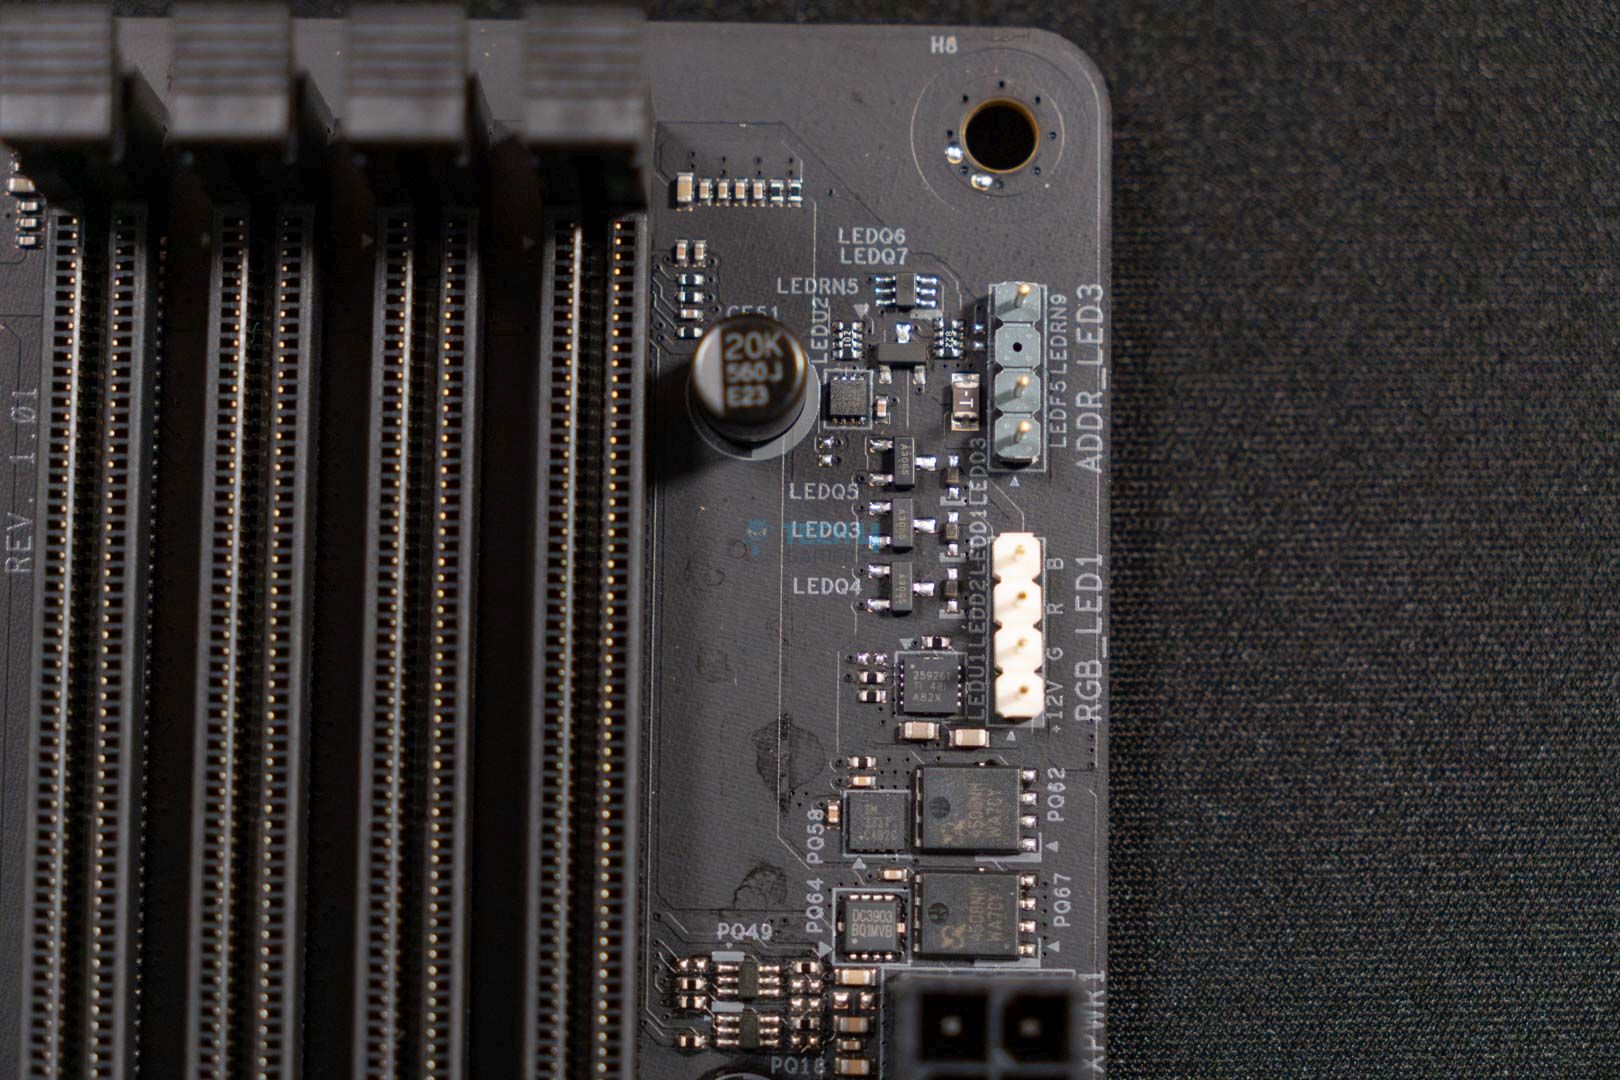
  • 1x RGB LED header
  • 3x addressable LED headers
  • 2x CPU fan connectors (4-pin) (Smart Fan Speed Control)
  • 3x chassis fan connectors (4-pin) (Smart Fan Speed Control)
  • 1x 24-pin ATX power connector (Hi-Density power connector)
  • 1x 8-pin 12V power connector (Hi-Density power connector)
  • 1x 4-pin 12V power connector (Hi-Density power connector)
  • 1x front panel audio connector
  • 2x USB 2.0 headers (support 4x USB 2.0 ports)
  • 2x USB 3.2 Gen1 headers (support 4x USB 3.2 Gen1 ports)
  • 1x front panel Type-C USB 3.2 Gen1 header

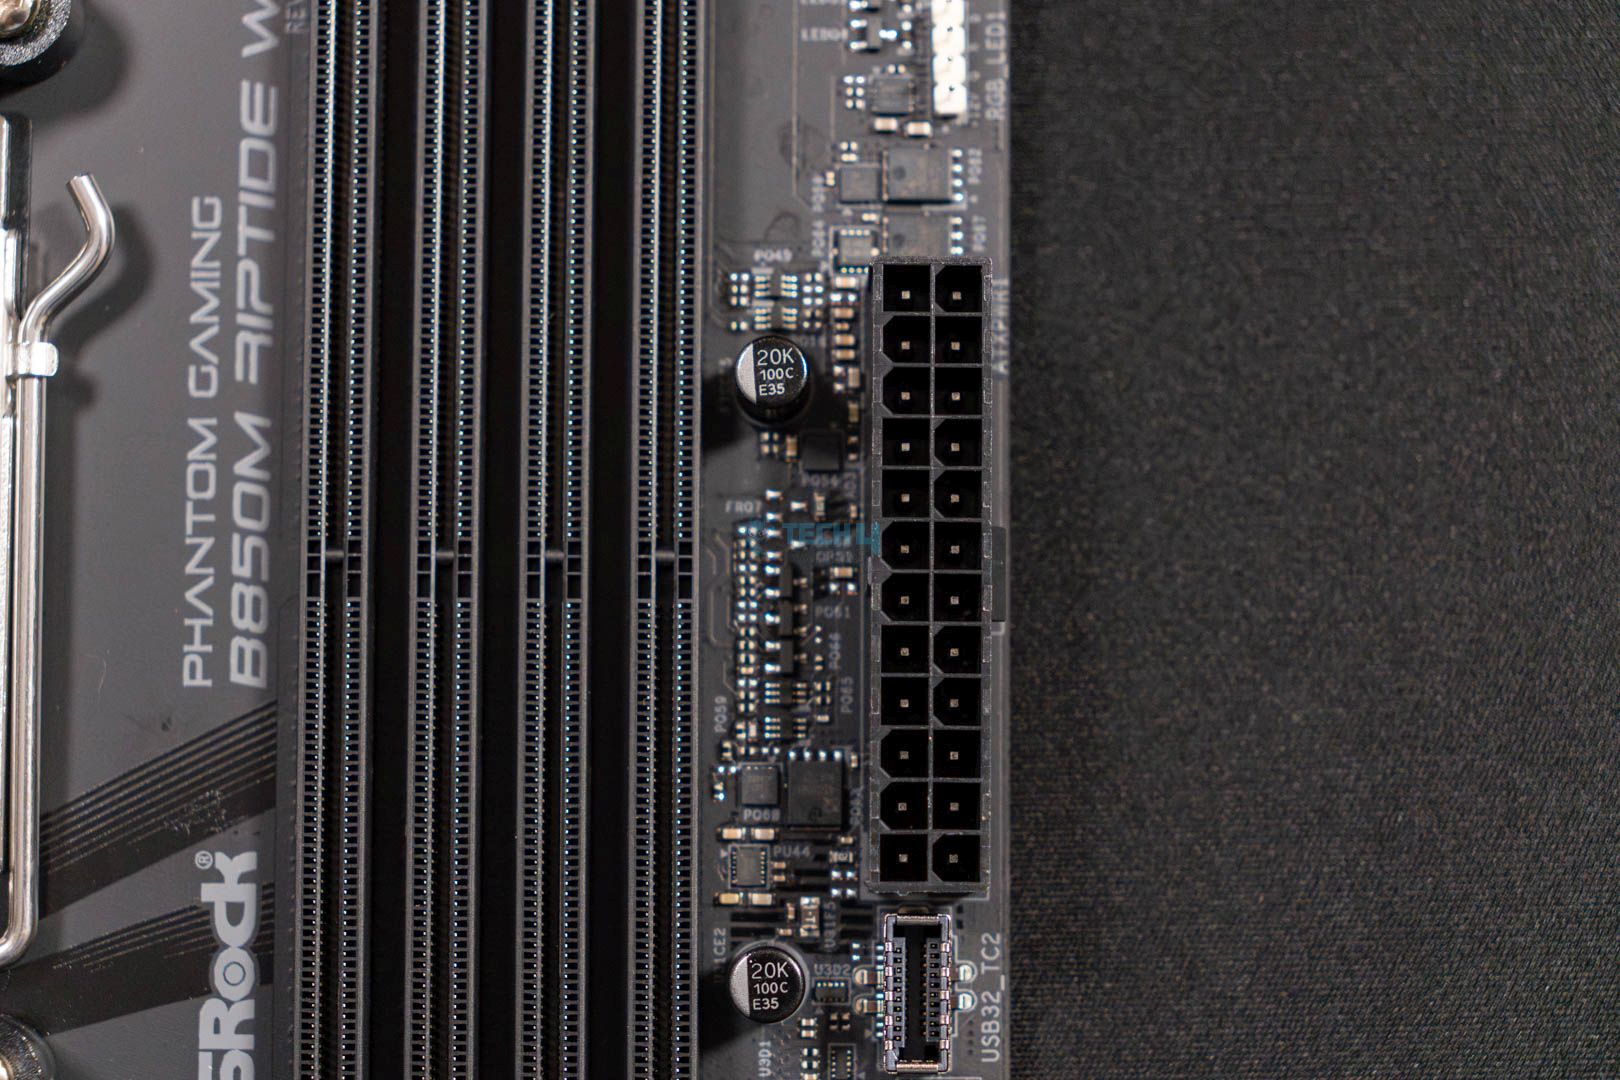
We mentioned the 8-pin 12V and 4-pin 12V connectors earlier, but along with that, the 24-pin ATX connector is pretty standard and also features the Hi-Power Density feature. Overall, I’m pretty happy with the connectors.

ASRock Phantom Gaming B850M Riptide WiFi CMOS battery
CMOS battery. (Image By Tech4Gamers)

Another good addition is ASRock’s Post Status Checker (PSC), which helps diagnose computer issues when powered on. There’s a total of four RGB colors that can be seen, and here’s what they mean:

  • Solid Red: Abnormal behavior by the CPU
  • Solid Yellow: Highlights issues with the DRAM
  • Solid White: Indicates an issue with the GPU
  • Solid Yellow-Green: Showcases a problem with the boot device

The PSC LED will not light up if the PC is functioning properly and will not turn off until the issue is fixed.

Heatsinks Removed

Removing all the heatsinks from the motherboard
ASRock Phantom Gaming B850M Riptide WiFi naked motherboard. (Image By Tech4Gamers)

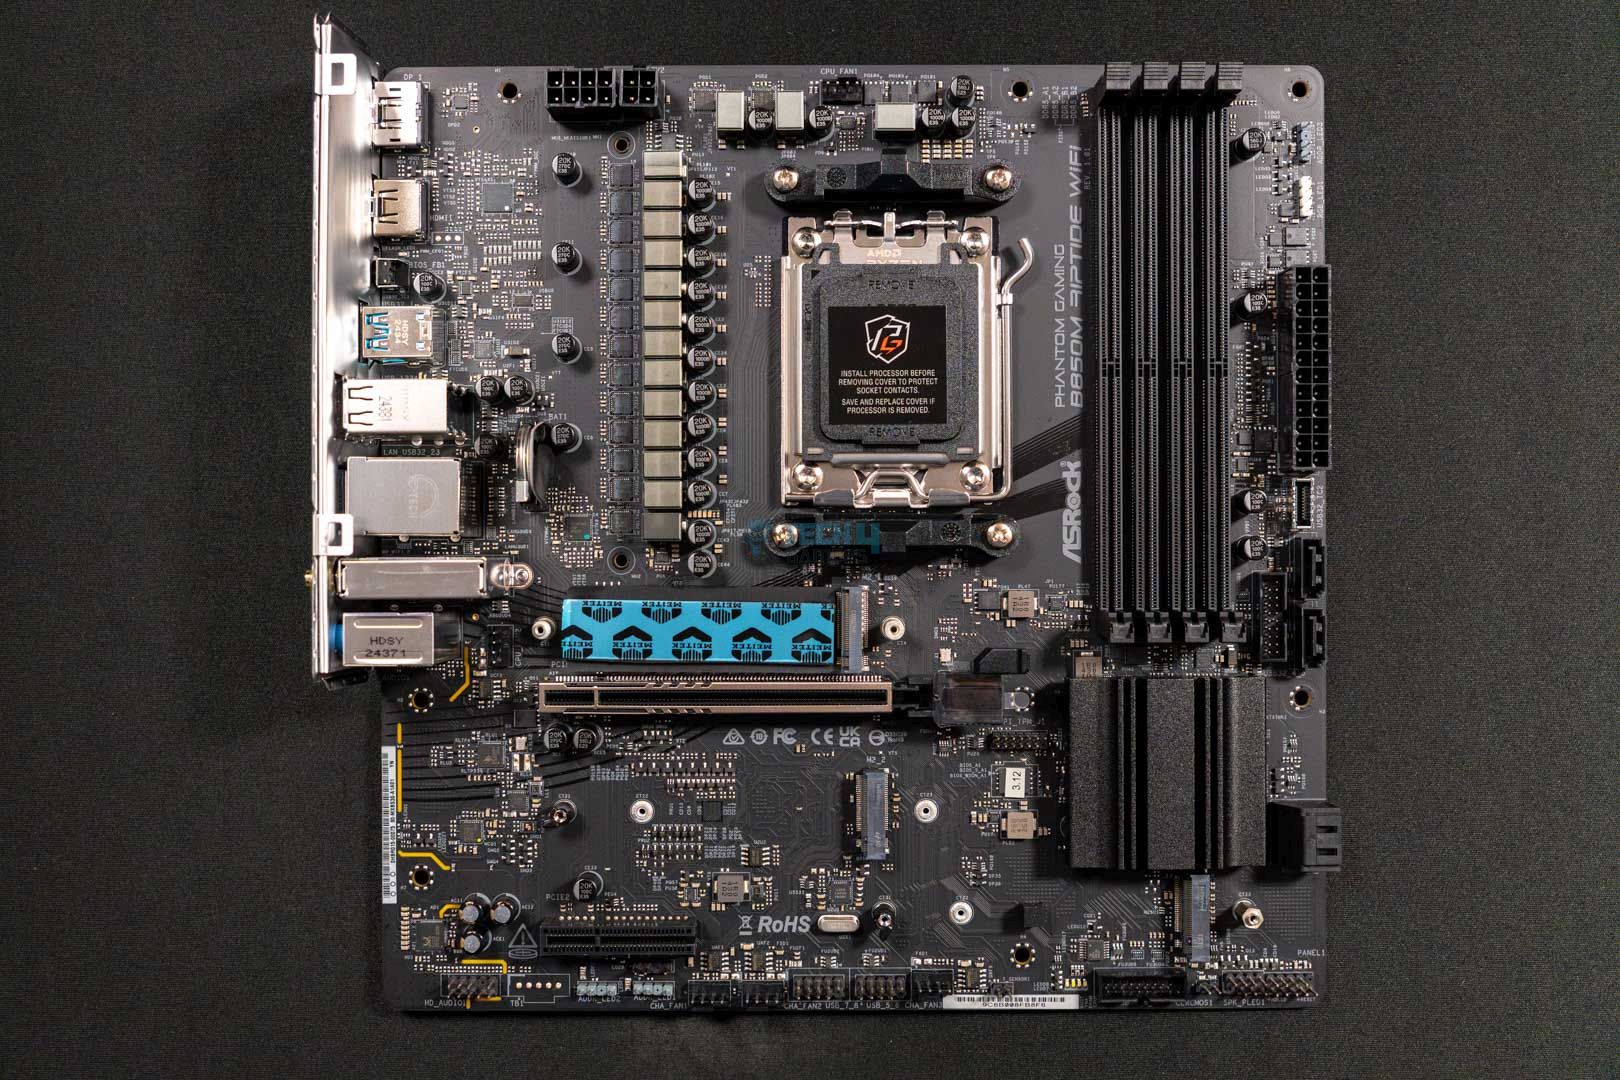
This is what the motherboard looks like with all the heatsinks removed.

Rear I/O Shield Panel

This is a list of all the connections provided on the rear I/O shield panel:

Rear I/O shield panel connections
Rear I/O shield panel connections. (Image By Tech4Gamers)
  • 2x antenna ports
  • 1x HDMI port
  • 1x DisplayPort 1.4
  • 1x USB 3.2 Gen2 Type-C port (10Gb/s)
  • 1x USB 3.2 Gen2 Type-A port (10Gb/s)
  • 2x USB 3.2 Gen1 ports
  • 4x USB 2.0 ports
  • 1x RJ-45 LAN port
  • 1x BIOS flashback button
  • HD audio jacks: line in/ front speaker/ microphone

There are multiple things to note. For starters, it’s sad that we don’t see a CMOS reset button while we have a BIOS flashback button. Besides that, we see two antenna ports, an HDMI and DisplayPort 1.4 ports, and a few USB ports. The USB 3.2 Gen1 ports are lightning gaming ports, so they should be used accordingly.

The BIOS flashback button is simple to use. Press it for about three seconds and wait for the LED to start blinking. Once the LED stops blinking, your BIOS will be updated. If the LED shows a solid green color, that means the flashback has encountered a problem. In that case, properly plug the USB drive into the USB BIOS flashback port.

WARNING: Before using the BIOS flashback button, please shut down apps like BitLocker that rely on TPM. Not doing so can result in the data getting encrypted, and your system won’t boot up.

Test Bench

These are the specifications of my test bench:

Synthetic Benchmarks

Let’s first look at how the ASRock Phantom Gaming B850M Riptide WiFi motherboard performed in synthetic tests:

Blender 4.0.2 renders
Blender 4.0.2 renders. (Image By Tech4Gamers)

The motherboard is only one second slower than its ATX variant, completing the render in only 51 seconds.

Cinebench 2024 single-core and multi-core scores
Cinebench 2024 scores. (Image By Tech4Gamers)

The motherboard significantly drops in performance, with 2,295 in multi-core and 140 points in single-core in Cinebench 2024.

Corona 11 render
Corona 11 render. (Image By Tech4Gamers)

The board is average in the Corona 11 test, with a render speed of 65.2 seconds.

Geekbench 6 score
Geekbench 6 score. (Image By Tech4Gamers)

In the Geekbench 6 test, the ASRock B850M Riptide WiFi plunges towards the third spot with a 21,712 score.

V-Ray scores
V-Ray scores. (Image By Tech4Gamers)

The V-Ray scores aren’t significantly different, but the B850M is again in the lower half, with 48,782 points.

Overall, the motherboard has average-to-decent performance out of all its B850 chipset peers.

Gaming Benchmarks

Let’s see whether there are any improvements in the gaming benchmarks:

Cyberpunk 2077
Cyberpunk 2077. (Image By Tech4Gamers)

Unexpectedly, the B850M performs better than the B850 Riptide WiFi in Cyberpunk 2077, with an average of 144 FPS.

Far Cry 6
Far Cry 6. (Image By Tech4Gamers)

The B850M Riptide WiFi is again at the forefront of Far Cry 6, with an average of 184 FPS and a minimum of 139 FPS.

Starfield
Starfield. (Image By Tech4Gamers)

The motherboard tops the chart with 111 average FPS and 81 minimum FPS in Starfield.

Overall, the motherboard made a comeback in the gaming benchmarks and topped most of them, albeit by 1 FPS at most.

Power Consumption And VRM Temperatures

Here are the values of the total power consumption of the processor and motherboard during our Cinebench 2024 stress tests:

Average power consumption
Average power consumption. (Image By Tech4Gamers)

The ASRock B850M Riptide WiFi is one of the more efficient motherboards on the list. It consumes only 368W at 100% load, 117W in gaming, and 106W while idle.

B850 Motherboard VRM Thermals Results
VRM Temperatures (Image By Tech4Gamers)

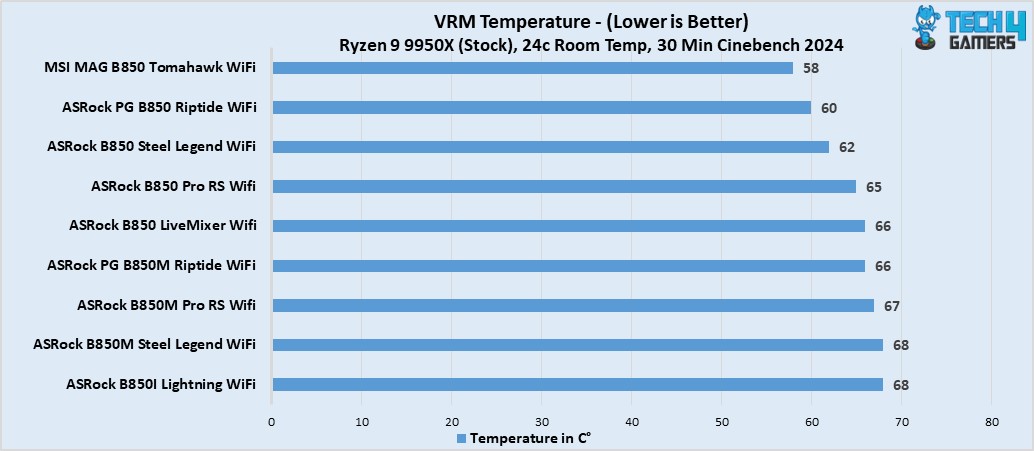
The VRM temperatures are slightly high at 66°C, but you won’t see any problems unless you wish to perform extreme overclocks.

Boot Times

Boot times
Boot times. (Image By Tech4Gamers)

The boot times are pretty low with the motherboard, booting up at 22 seconds.

Should You Buy It?

So, is the ASRock Phantom Gaming B850M Riptide WiFi worth the money?

Buy It If

✅ You want a smaller motherboard that doesn’t sleep on performance: If you’re looking for a smaller-sized motherboard for a new PC setup and want more performance, this motherboard is the way to go.

✅ Having an easy-to-build-in motherboard excites you: The ASRock B850M Riptide WiFi is exceptionally straightforward to build in because of several EZ features like the EZ GPU latch and screwless heatsinks.

✅ You work in the audio industry: In case you work in the audio industry and want a smaller B850 chipset motherboard, you’ll be happy with this one because of its Realtek ALC1080 audio codec, which provides clear and crisp audio.

Don’t Buy It If

❌ You want to utilize USB 3.2 Gen2x2 Type-C: It’s unfortunate, but the motherboard doesn’t provide us with the USB 3.2 Gen2x2 Type-C port, so if you want to make use of it, I recommend looking for a different variant.

❌ You need high-speed internet: If you’re looking for a high-speed LAN network, this motherboard is not for you because it only features 2.5G LAN.

My Thoughts

The ASRock Phantom Gaming B850M Riptide WiFi is an impressive mATX motherboard, perfect for gamers who want a smaller board without sacrificing performance. Its current price on Newegg is $189. I won’t exactly call this a “budget-centric” variant because there are cheaper B850M variants out there, but the value of this motherboard can’t be overlooked. For example, the 1000uF capacitors, rated for 20K capacitance, are a feature I was not expecting from an mATX form factor board.

The motherboard has 2x PCIe expansion slots, the primary one being PCIe Gen 5.0 x16, while the PCIe2 is Gen 4.0 x4. We see an EZ latch for the GPU to install and remove the component easily. Similarly, the board houses three M.2 slots. M2_1 is a PCIe Gen 5.0 x4, M2_2 is a PCIe Gen 4.0 x2, and M2_3 is a PCIe Gen 4.0 x4. The M2_1’s heatsink has dual-sided thermal pads to keep the drive at low temperatures all the time. On the flip side, the M2_2 doesn’t even get a heatsink, which is a letdown.

The B850M Riptide WiFi motherboard eats out on a few connectors that could have improved its value by leaps. For example, adding a USB 3.2 Gen2x2 Type-C port would have been ideal. Similarly, I would have loved a CMOS reset button rather than having to do it the old-fashioned way for troubleshooting. Similarly, I have a few issues with the networking, too, because ASRock has provided us with a 2.5G LAN network instead of a 5G LAN. I’m happy with the inclusion of WiFi 7 and Bluetooth 5.4 for connectivity purposes.

The motherboard has a similar design to its ATX variant, and the total rebranding from the previous gen gives it a game-like vibe. The stickers on the heatsinks are blue in color, and the BIOS heatsink has a blue hue underneath that complements the overall design.

Overall, this is a great addition by ASRock for a $189 price tag, making it perfect for mid-range to high-end PC builds. I recommend the ASRock Phantom Gaming B850M Riptide WiFi motherboard if you’re fine with a slightly slower LAN network and the exclusion of a USB 3.2 Gen2x2 Type-C port, let alone having USB4.


Ubisoft Removes Japanese Videos Criticizing AC Shadows, Citing Hate Speech Claims

Story Highlight
  • Assassin’s Creed Shadows has found itself in yet another controversy.
  • Popular Japanese YouTuber Shohei Kondo’s recent videos on the game have been taken down on the basis of hate speech.
  • The YouTuber states that there is no truth to these claims.

Things are finally looking encouraging for Assassin’s Creed Shadows after a slew of controversies over the last few months. In particular, recent previews have been positive, and Ubisoft has shared promising updates on the changes to the parkour systems.

Unfortunately, it seems the game is inseparable from controversy. Recently, reports pointed to Ubisoft shifting away from Yasuke for its marketing, and the gaming giant now seems to be taking down videos criticizing the game.

Why it matters: Ubisoft has already undergone criticism for its approach to Assassin’s Creed Shadows. The last thing the publisher needs is another controversy on its hands right ahead of this massive release.

Assassin's Creed Shadows Hate Speech Video Removal
Popular Japanese Content Creator Shohei Kondo’s Video Has Been Taken Down | Image via X

Over on Twitter, Grummz reported Shohei Kondo’s video was taken down by Ubisoft after he shared a critical overview of Assassin’s Creed Shadows.

The content creator also replied to the thread, stating that the video was removed a whopping seven times, with hate speech cited as the main reason. As per Shohei Kondo, there was no instance of hate speech in his recent videos.

In a follow-up video, the YouTuber shared his thoughts on the situation, highlighting how his content on Assassin’s Creed Shadows was meant to offer strict albeit fair criticism in the context of Japanese culture and heritage.

He also stated that the takedown was extremely saddening and disheartening. Fortunately, the YouTuber has been able to restore his video after multiple days of back and forth with the YouTube team.

As for Ubisoft, the gaming giant has stated in the past that Assassin’s Creed Shadows is not meant to represent historical accuracy. However, many Japanese people still feel strongly about the publisher’s portrayal of Japan and its history.

What are your thoughts on this situation? Do you think Assassin’s Creed Shadows will find success despite these controversies? Feel free to discuss in the comments, and head to the Tech4Gamers Forums for even more discussions.

How Outlast 2 Redefined My Idea of Survival Horror Games

Story Highlights

  • Outlast 2 blends psychological and survival horror with a deeply unsettling narrative.
  • The brutal gameplay mechanics amplify fear and vulnerability, redefining what horror games can be.
  • The game demonstrates true horror lies in psychological depth, not just jump scares.
  • The game leaves players questioning faith, morality and the nature of fear itself.

Survival horror is a genre that has constantly tested the boundaries of fear and resilience, yet only a few games have impacted me, as Outlast 2 has. Developed by Red Barrels, this sequel takes the foundation set by its predecessor and expands it into something darker and more disturbing.

Outlast 2 is very emotionally challenging and complex. With the series Trinity bundle at 20% off on Steam, this is the best time to play it. Let’s dive right into how it has changed my perception of what survival horror games can be.

A Story That Cuts Deep

At its core, Outlast 2 is more than just a survival horror game; it is a psychological exploration of faith, guilt and trauma. You play the character Blake Langermann, an investigative journalist searching for his missing wife in the cult-ridden wilderness of Arizona.

Outlast 2
Outlast 2 Exploring Arizona – Image Credits [Pinterest]
Themes of religious fanaticism and personal despair heavily influence the game’s narrative. Outlast 2 takes players on a journey through the human psyche. Unlike traditional horror games that rely on an actual villain, Outlast 2 blurs the line between reality and delusion, making players question the trustworthy source of the horror.

Atmosphere and Setting

The desolate rural landscape, claustrophobic caverns and decaying structures create an environment that feels very much alive. Every corner of the game is designed to unease the player. 

The isolation of the Arizona wilderness amplifies the tension and leaves you feeling vulnerable and exposed. The game’s atmosphere is similar to that of Silent Hill 2 in the sense that both games masterfully blend psychological horror with deeply personal narratives. 

Gameplay Outlast2
Gameplay Outlast 2 – Image Credits [Steam]
If you have played Silent Hill 2, I highly recommend that you try Outlast 2. The game’s haunting atmosphere is a testament to Red Barrels’ mastery of environmental settings.

Gameplay That Keeps You on Edge

One of the most significant ways Outlast 2 redefined survival horror for me was through its gameplay. The absence of combat mechanics means you’re constantly on the run, hiding, and navigating terrifying scenarios.

This helplessness amplifies the horror, forcing you to rely on your instincts and resourcefulness to survive. The camcorder mechanic, now equipped with night vision and directional microphones, adds a layer of dread as you peak into the darkness, similar to how Layers of Fear did.  

Camcorder Mechanic
Camcorder Mechanic Outlast 2 – Image Credits [Steam]

A Symphony of Fear

The audio design for Outlast 2 is nothing short of marvelous. From the haunting musical score to the spine-chilling sound effects, everything is designed to keep players on edge. Blake’s heavy breaths, the distant cries of cult members and the silence that precedes a scare all come together to create an auditory experience as scary as the gameplay itself.

Pushing Boundaries

What sets Outlast 2 apart from other horror games is its willingness to push the boundaries. The game does not shy away from presenting uncomfortable themes or putting players into morally ambiguous situations.

Cult Church
Cult Church Outlast 2 – Image Credits [Steam]
Outlast 2 forces players to confront the darkest aspects of humanity, leaving them with lingering questions about faith, morality and survival. These aspects make the game deeply personal and unforgettable.

Redefining Fear

Before playing Outlast 2, I viewed survival games as merely jump scares and resource management, but this game forced me to rethink that. Outlast 2 showed me that absolute horror resides with a game’s psychological and emotional impact on the player.

It showed me that fear doesn’t always come from what’s chasing you but from the stories you uncover, the decisions you are forced to make and the lingering feeling of what’s yet to come. Engadget on X stated that Outlast 2 is all about documenting your own mental breakdown.

Final Thoughts

Outlast 2 is not just a game; it is an experience that challenges you as the player to endure its relentless terror and confront its unsettling themes head-on. It was hands-down one of my favorite gaming experiences, keeping me on edge every step of the way. The game showed me that sometimes the scariest monsters are the ones that reside with us. 

Assassin’s Creed Shadows To Heavily Censor Gore For Japanese Audience

Story Highlight
  • Assassin’s Creed Shadows will be censored in Japan with toned-down violence to comply with CERO standards.
  • The game’s dialogue will also be quite different from European and North American versions.
  • CERO has a history of harsh ratings for video games released in Japan, which led to the complete ban of Dead Space in the country.

It seems that Assassin’s Creed Shadows can’t catch a break in Japan. From being a target of controversy due to historical inaccuracies to a petition to entirely cancel the game, the Japanese audience isn’t quite pleased with the title.

If that wasn’t enough, Assassin’s Creed Shadows will now be heavily altered for Japanese audience. According to a tweet by Ubisoft Japan, the game will censor gore and dismemberment to comply with CERO standards, a local organization responsible for rating video games.

Why it matters: With brutality and gore a huge part of the game’s combat, censoring such elements will potentially alter the game experience. 

Assassin's Creed Shadows Stealth
Assassin’s Creed Shadows Early Previews Are Quite Positive

For the version of Assassin’s Creed: Shadows (CERO: Z) sold in Japan, there are some differences in the in-game expressions in order to comply with the regulations of the rating agency.

The game already features a toggle for dismemberment for people who don’t prefer gore. However, such an option is entirely removed from the Japanese version of the game. Assassin’s Creed Shadows is already rated CERO Z (18 and above) for Japan, but they were still prevalent in censoring the game.

assassins creed shadows censored
Assassin’s Creed Shadows Censored In Japan || Source: Ubisoft Japan On X

Moreover, the tweet also says that the way weapons will cut the body will also be changed.

Additionally, some of the voice lines in the Japanese version have been changed compared to the North American and European versions of the game. What changes to the dialogue will be made is currently unknown, but we’ll find out upon the game’s release.

CERO is notably one of the most controversial game rating organizations in the world. Its strict rating system requires it to observe certain cultural, sexual, and violent content.

Previously, the Resident Evil series has also faced such censorship in Japan. Cutscenes depicting decapitation or violent scenes can be seen blurred for the Japanese version.

Dead Space is also yet another gore title and didn’t pass the CERO standards. For that, the game was completely banned in Japan.

Do you think CERO is being too harsh on Assassin’s Creed Shadows ratings? Let us know in the comments below or on the official Tech4Gamers forums.

Arc B580 Vs RTX 3070: Our Honest Opinion

Intel ARC B580

Rated: 7.5/10

Nvidia RTX 3070 

Rated: 9/10


Pros And Cons

GPUProsCons
Arc B580✅ More power & thermal efficient
✅ Better AV1 encoding support
❌ Less productivity performance
❌ Lesser RT, Tensor, CUDA Cores
RTX 3070✅ DLSS 3 is still widely supported
✅ Better gaming performance at 1440p & 4K
❌ More costly
❌ Larger process node
Key Takeaways
  • From our analysis, the RTX 3070 is 18.6% better FPS across eight games at 1440p and also was 28.4% better in productivity when compared to the Arc B580.
  • However, the Arc B580 is 61.4% more power-efficient and 4.7% more thermally efficient than the RTX 3070. 
  • Intel’s Arc B580 is conveniently priced at $250, while you can get the RTX 3070 for a variable price point of around $600.
  • If you prioritize performance and have a larger budget, choose the RTX 3070. Conversely, if you have a tighter budget and want decent performance, choose the Arc B580. 

Comparison Table

Technical SpecsArc B580RTX 3070
Release DateJan 16th, 2025Sep 1st, 2020
Power Connectors1x 8-pin1x 12-pin
Shader Cores (CUDA)25605888
Tensor Cores160184
RT Cores2046
TMUs160184
ROPs8096
Suggested PSU450W550W
Best Variants-Best RTX 3070
GPU ReviewIntel Arc B580 Review RTX 3070 Review

Architectural Difference

  1. Process Nodes: While the RTX 3070 relies on the older and outdated 8nm process node, the newly released Arc B580 uses the latest 5nm process node technology, making it significantly more advanced.
  2. Clock Speeds: The RTX 3070 operates at a base and boost clock frequency of 1500 MHz and 1725 MHz, respectively. Whereas, the Arc B580 comes with a fixed frequency of 2670 MHz. 
  3. VRAM: The Arc B580 boasts 12GB of GDDR6 memory with a 192-bit memory bus width. In contrast, the RTX 3070 has a lower VRAM of 8GB GDDR6 but makes up for it by having a larger bus width of 256-bit.
  4. TDP: The Arc B580 does come with a slightly less TDP rating of 190W compared to the RTX 3070, which has a TDP of 220W. 
  5. Supported Technologies: While the RTX 3070 supports AI-driven DLSS 3 for frame generations, the Intel Arc B580 doesn’t lag behind because it uses Intel’s AI-based XeSS 2 technology.

In this in-depth analysis, we’ll equip you with the information needed to decide if you’re debating between the Intel Arc B580 vs Nvidia RTX 3070. By the end of this article, you’ll know how the latest Arc B580 holds up against one of Nvidia’s infamous cards.


Gaming Benchmark – 1440p

Let’s begin this comparison by testing the gaming capabilities of each card on 1440p. Here, you’ll be looking at all the fancy numbers and values obtained from each GPU in 8 of the tested games. 

Recommended Test Bench

Resident Evil 4

Resident Evil 4
Resident Evil 4 (Image by Tech4Gamers)
  • Starting off with this zombie-infested game, we saw that the RTX 3070 sets the bar 4.5% higher than the Arc B580 since it has achieved 68 FPS over Arc B580’s 65 FPS.
  • When we checked the 1% lows, the Arc B580 managed to catch up in a way that made the playing field even since both obtained an average of 52 FPS.

God Of War: Ragnarök

Resident Evil 4
God Of War: Ragnarok (Image by Tech4Gamers)
  • On God Of War, the RTX 3070 excelled by a 31.7% lead since it averaged 73 FPS. In contrast, the Arc B580 was behind with an average of 53 FPS. 
  • Here, the 1% low was different; the RTX 3070 was 31% ahead of the Arc B580 because it obtained an average of 67 FPS over Arc B580’s 49 FPS.

Silent Hill 2

Silent Hill 2
Silent Hill 2 (Image by Tech4Gamers)
  • Both the GPUs couldn’t go past the 60 FPS mark, but the RTX 3070 still managed to push with 43 FPS while the Arc B580 plowed through with 31 FPS, equating to a 32.4% difference.
  • As for the 1% lows, the RTX 3070 operated at an average of 33 FPS, whereas the Arc B580 was also not far behind with its average of 26 FPS, resulting in a 23.7% margin. 

Cyberpunk 2077

Cyberpunk 2077
Cyberpunk 2077 (Image by Tech4Gamers)
  • Our analysis revealed that the RTX 3070 only managed to pull a 1.8% lead as it averaged 56 FPS on Cyberpunk. In comparison, the Arc B580 b brought the results to almost a tie by averaging 55 FPS.
  • Similarly, the RTX 3070 only had a 4.8% edge over the Arc B580, as it obtained an average of 43 FPS, compared to the Arc B580’s 41 FPS, in terms of the 1% lows.

Ghost Of Tsushima

Ghost Of Tsushima
Ghost Of Tsushima (Image by Tech4Gamers)
  • Strikingly, the Arc B580 pushed again in this game and acquired an average of 50 FPS. Still, the RTX 3070 was 5.8% better, operating at an average of 53 FPS. 
  • Speaking of the 1% lows, the RTX 3070 faced quite a challenge as the Arc B580 came 2.1% closer to it; both GPUs averaged 49 FPS and 48 FPS, respectively.

S.T.A.L.K.E.R. 2

S.T.A.L.K.E.R. 2
S.T.A.L.K.E.R. 2 (Image by Tech4Gamers)
  • We also decided to check the framerates from the new Stalker 2, where the RTX 3070’s 57 FPS ended the neck-to-neck competition as it outshined the Arc B580, which averaged 45 FPS by a 23.5% performance margin. 
  • The 1% lows were also in favor of the RTX 3070, as it obtained an average of 46 FPS over the Arc B580’s 37 FPS, resulting in a 21.7% difference.

Hogwarts Legacy

Hogwarts Legacy
Hogwarts Legacy (Image by Tech4Gamers)
  • On Hogwarts Legacy, we observed that the RTX 3070 maintains its lead, this time by 26.8%, since it averages 72 FPS, leaving behind Arc B580, which only operated at an average of 55 FPS.
  • In terms of 1% lows, the RTX 3070 was 21.1% ahead of the Arc B580 since it obtained an average of 42 FPS. On the other hand, the Arc B580 had an average of 34 FPS.

Starfield

Starfield
Starfield (Image by Tech4Gamers)
  • Lastly, the RTX 3070 dropped the mic on the Arc B580, achieving an average of 49 FPS. In contrast, the Arc B580 ran at an average of 37 FPS, resulting in a 27.9% margin.
  • With a 26.1% lead, the RTX 3070 ended this 1% low show as well since it obtained an average of 39 FPS over the Arc B580’s 30 FPS. 

Productivity Benchmarks

After gaming benchmarks, productivity benchmarks are the second vital component to test out the performance of graphic cards. So, let’s put both of these GPUs against each other to analyze their performance in creative software.

Geekbench 6

Geekbench 6 OpenCL Score
Geekbench 6 OpenCL Score (Image by Tech4Gamers)
  • For the Geekbench test, the Arc B580 showed us a 127,837 OpenCL score, which outperformed the RTX 3070 by 26.5% since it displayed a 97,939 score.  

Blender

Blender Samples Render Per Minute
Blender Samples Render Per Minute (Image by Tech4Gamers)
  • On Blender, we observed that the Arc B580 was 62.8% behind the RTX 3070, rendering 1,800 samples per minute compared to the RTX 3070’s 3,446 samples per minute.

Passmark

Passmark Score
Passmark Score (Image by Tech4Gamers)
  • For our Passmark test, the RTX 3070 led with a 35.1% performance margin over the Arc B580, achieving a 22,322 score compared to the Arc B580’s 15,662 score.

Overall Performance

Graphic CardsArc B580RTX 3070
Average FPS📈48.9📈58.9
1% Lows📉39.6📉46.34
Productivity (Rating)✏️7/10✏️4.8/10
Winner: Nvidia's RTX 3070

Average Framerate

After calculating the average FPS values obtained from these eight games, we saw that the difference was not quite large but still significant. Thanks to its higher specifications, the RTX 3070 performed 18.6% better on average than the Arc B580. 

1% Lows:

Surprisingly, we saw that 1% low average results were in favor of Nvidia’s card. Here, the RTX 3070 showcased a 15.7% lead over its rival, given that Arc B580 shared head-to-head values for a few games. 

Productivity:

The productivity results were slightly larger than those obtained for the average framerates. Here, the RTX 3070 displayed a 28.4% better performance margin than the Arc B580, which shows its higher productivity capabilities.

Average Power Consumption

GameArc B580RTX 3070
Resident Evil 4 116218
God of War: Ragnarök108200
SILENT HILL 2118215
Cyberpunk 2077127233
Ghost of Tsushima114214
S.T.A.L.K.E.R. 2 111221
Hogwarts Legacy110210
Starfield112217
Average Power Draw114.5⚡216⚡
Winner: ARC B580

With the higher performance, of course, the RTX 3070 consumed more power. On the other hand, the Arc B580 remained well within the bounds of 130W for most games, which makes it 61.4% more power-efficient than the RTX 3070.

Average Thermal Statistics

GameArc B580RTX 3070
Resident Evil 4 5759
God of War: Ragnarök5759
SILENT HILL 25862
Cyberpunk 20776163
Ghost of Tsushima5757
S.T.A.L.K.E.R. 2 5863
Hogwarts Legacy5759
Starfield5762
Average Temperatures57.8🌡️60.5🌡️
Winner: ARC B580

As far as the temperatures are concerned, the results were quite different. We observed that both the GPUs operated at almost similar temperatures, with the Arc B580 running 4.7% cooler than the RTX 3070.

Pricing And Availability

GPUArc B580RTX 3070Price Difference
MSRP💲250💲49966.5%
Current Price💲250💲55075%

Intel’s newly released GPU is far more affordable than the RTX 3070, specifically around $300 cheaper although it is slightly harder to find it since it’s a newer release. You can also get the RTX 3070 for different prices depending on the variants offered.

Final Verdict—What We Recommend?

Intel Arc B580: While the Arc B580 proved to be very power-efficient and slightly more thermally efficient than the RTX 3070, it lacked performance in gaming and productivity. However, this doesn’t mean it’s bad. Instead, it is a decent 1080p card that is also affordably priced. 

Nvidia RTX 3070: On the contrary, the RTX 3070 consistently showcases its utmost performance in gaming and productivity. The temperature difference is comparatively insignificant, but the price justifies its relentless performance, as it can push through in 1440p and 4K gaming. 

That said, the choice is ultimately yours. We recommend getting the RTX 3070 if you have the budget for it and prioritize performance over anything. Conversely, we recommend getting the Arc B580 if you’re on the lighter side of the budget and want decent overall performance.

FAQs

Which GPU is more suitable for multi-display setups and media playback?

While the RTX 3070 can support multiple displays, it lacks AV1 encoding, which the Intel Arc B580 does have. Also, the B580 supports up to four simultaneous 4K HDR displays.

Which GPU has better ray tracing performance?

The RTX 3070 offers a better ray tracing experience because of its 2nd-generation RT cores. While the Arc B580 supports ray tracing, it often struggles with ray-tracing performance comparatively.

How do XeSS 2 and DLSS compare in upscaling performance?

While the XeSS 2 is a new technology, it is not refined or widely supported in most games. Nvidia’s DLSS 3 is more advanced, provides better image quality, and is also widely supported.

Why is the Arc B580 better for content creation and productivity tasks?

The Arc B580’s AV1 video encoding and support for the OpenCL and OpenVINO make it suitable for creative workloads because it can handle up to two 8K 10-bit workloads.

Which GPU is the Intel Arc B580 most equivalent to?

The Intel Arc B580 is more or less similar to the RTX 4060 Ti based on the performance.

It Won’t Be Long Before PlayStation Follows In Xbox’s Multiplatform Strategy, Claims Ori Director

Story Highlight
  • Ori director claims that PlayStation will also soon follow in Xbox’s multiplatform strategy.
  • He thinks that Xbox already has the right approach, and the strategy is necessary to grow the console industry.
  • Notable industry insiders have also touted similar opinions about Sony’s future over the last few months. 

Consoles have struggled to grow their audiences beyond a certain threshold for a long time now. Xbox was quick to notice this stagnation and has already shifted its strategy to release exclusives across other platforms.

Now, Ori and the Blind Forest director says he believes PlayStation will also soon follow in Xbox’s footsteps and adopt a multiplatform strategy in no time.

Why it matters: The words of the Ori director further highlight the shifting landscape in the console space, where many notable figures have recently argued that Sony will have to adopt a multiplatform strategy to survive.

The CEO of Moon Studios and Ori director believes that Xbox has the right approach already.

Taking to Twitter to address console warring controversies, Thomas Mahler says Xbox is already on the right track. He thinks it won’t be long before Sony follows the same strategy since it makes no sense to stick to exclusivity and limit your audience.

This debate has also been discussed by notable insiders, such as Jason Schreier, who said console audiences are not growing fast enough to justify exclusivity. Jason also argues that PlayStation will get closer and closer to the multiplatform approach.

Regardless, Thomas thinks the price of entry in the console market is too high to convince new gamers to buy a ‘$500 box’ just to play their favorite game.

Xbox-Series-X
An analyst also predicts that Xbox’s multiplatform strategy points to a promising future.

Sony has also started making moves towards adopting a multiplatform approach—albeit at a much slower pace. The company plans to release live service entries on PC while keeping its cinematic first-party titles on PlayStation for a limited time.

Do you think PlayStation will eventually have to adopt the multiplatform strategy to survive, or will it stick to the traditional approach? Drop your thoughts in the comments, or join the discussion on the Tech4Gamers forum.

Phantom Blade Zero Expected To Launch In Late 2026 With A $55M Final Budget

Story Highlight
  • Phantom Blade Zero will have 4 difficulty options according to developer interviews.
  • Furthermore, the game will take around 30 hours to complete and is set to release in late 2026.
  • Over 100 people are working on the RPG with a budget of $55 million.

Phantom Blade Zero got its first official gameplay showcase just recently and with that other info about the game has also come to light, including its 30-hour playtime and a release window set for late next year.

Furthermore, recent interviews reveal the game will have a final budget of approximately $55 million. It will also include four different difficulty settings, allowing players of all skill levels to adjust the game’s challenge to suit their style.

Why it matters: Phantom Blade Zero has earned a lot of unfair comparisons to other Soulslikes since its reveal in 2023 and the difficulty levels prove the game is anything but that and will be easier for audiences to grasp.

Phantom Blade Zero
Phantom Blade Zero Will Boast A Runtime Of 30 Hours For Its Main Story Alone.

According to interviews summarised by Lunatic Ignus, the upcoming RPG is going to have 4 difficulty levels to go with its 30-hour completion time. The difficulty levels separate Phantom Blade Zero from Soulslikes, which many think the game is trying to be.

Aside from that, there is also a rather interesting “Repeat Boss Challenge” in the game, which may let you fight bosses again if you have defeated them already.

In addition, the upcoming title is looking to be released sometime in 2026, with a window for the latter part of the year looking the most likely. Some info about the game’s development team has also come to light as over 100 people at developer S-Game are working on the title right now.

Phantom Blade Zero offers about 30 main weapons and 20 secondary ones. Each weapon is designed to move differently and cause specific types of damage, making every weapon feel unique.

Phantom Blade Zero
The Upcoming RPG Has A Rather Economical Budget.

Are you excited to play Phantom Balde Zero after this recent spur of info or do you think the title should be more like a Soulslike? Tell us in the comments below or head to the Tech4Gamers forum for discussion. 

AI Integration Into Smartphones, Where Does It Stop?

Story Highlights
  • Smartphone companies are integrating AI heavily into their latest phones, using it as a core selling point.
  • The latest Gen-AI phones let you add/remove objects, draft email replies, live translate calls and texts, solve math equations, and much more.
  • Building smartphones around AI comes with its own set of privacy and data risks that should not be ignored.

It wouldn’t be wrong to say that AI has seeped its way into our lives pretty rapidly. At this point, AI is practically all around us, be it in our personal smartphones, laptops, or even smart home equipment. The world has begun to rely on artificial intelligence more than natural intelligence. Isn’t it getting too intrusive too soon?


AI In Our Smartphones

Google’s flagship phone, the Pixel, now emphasizes the AI-powered assistant Gemini rather than the Google Assistant. The Pixel 9 comes with Gemini pre-loaded, while the app is available for installation on other Android and iPhones.

With Gemini, you can quickly summarize long documents, translate text into different languages, create responses to emails, and much more. It’s like a digital personal assistant, right in the palm of your hand.

Galaxy AI Features
Galaxy AI Features (Image By Tech4Gamers)

Apart from this, Samsung introduced Generative Edit in its Photo Gallery for the S and Fold series. This tool lets you remove objects and people from your photos like they never existed. You can even modify photo backgrounds with this tool.

That’s not all. The AI-powered Live Translate in Galaxy phones has eliminated waiting times in multilingual conversations. Now, you can speak any language on a phone call, and the tool will translate it in real-time for the other person.

Live Translate
Live Translate (Image By Tech4Gamers)

Not just Android but iPhones have also faced immense changes in their software to integrate Apple Intelligence, which introduces several AI tools in various apps. For instance, enter a math equation in the Notes app and automatically get the answer within seconds.

These, and a number of other ways in which AI has made its place in our smartphones, are often perceived as an added convenience. However, is it safe to give AI control of our lives to this extent?


Do We Really Trust Gen-AI Phones?

AI now has access to all our photos, emails, documents, phone calls, location, and even facial and voice data. Can it be trusted with all that information? The answer is not black and white.

A global study covering 17 regions found that about 61% of participants were doubtful about trusting AI (Gillespie et al., 2023). Another survey indicated that 77% of respondents would be more receptive toward AI voice assistants if they offered privacy enhancements.

Apple Intelligence
Apple Intelligence (Image By Apple)

While AI digital assistants make our lives easier in more than one way, users need to feel that their data is safe with them. With so much control over our data and practically our daily lives, we need to be careful about the potential risks. 

Google has already warned users that it “collects your Gemini Apps conversations, related product usage information, info about your location, and your feedback” to “improve and develop Google products.” It also requires additional information from your device to generate helpful responses.


Where Does It Stop?

About 15 years ago, none of us would have imagined that AI would advance to the point where we would start relying on it to even draft our emails. It has definitely taken up a huge chunk of our lives. We are so used to it now that going back seems impossible. 

However, it seems that companies are more focused on profiting from these AI tools than on considering the negative effects they might pose on consumers.

There needs to be stricter monitoring and regulations that limit the integration of AI in smartphones. Sure, there are tons of benefits, but that doesn’t justify the risks attached to this, like misuse of personal data, tracking individuals’ online activity and location, etc.

If not addressed in time, we will fall down a slippery slope with no options for reversing the damage done.


ARC B580 Vs RTX 3060 Ti – Our Tests And Thoughts

GeForce RTX 3060 Ti

Rated: 7/10

Intel ARC B580

Rated: 8.5/10


Pros And Cons

GPUProsCons
ARC B580✅ More efficient 6 nm process technology
✅ Better in terms of performance
❌ Poor thermal performance
RTX 3060 Ti✅ Has 58% more shading units
✅ Supports Nvidia DLSS 2 technology
❌ Much more expensive

Key Takeaways

  • The ARC B580 performed around 3% better in our gaming tests on average, and the synthetic benchmarks painted a similar picture.
  • The RTX 3060 Ti took around 18% more power than the ARC B580, and both cards have different recommendations for power supply capacity.
  • As of late January 2025, the RTX 3060 Ti is about 30% more expensive than the ARC B580.
  • Though we can still see a lot of people buying the RTX 3060 Ti because of Nvidia’s brand power, the ARC B580 seems to be the better choice for most individuals.

Comparison Table

FeatureArc A580RTX 3060 Ti
PurposeGamingGaming
SegmentMid-rangeMid-range
ArchitectureGeneration 12.7Ampere
GPU CodenameDG2-512GA104
Shading Units30724864
Texture Mapping Units (TMUs)192152
Render Output Units (ROPs)9680
Compute Units (Pipelines)-38
Tensor Cores384152
GPU ReviewIntel ARC B580 Review-

Architectural Differences

  1. Process NodesThe ARC B580 uses a modern 5nm manufacturing process, whereas the RTX 3060 Ti uses a slightly older 8nm process.
  2. Clock Speeds: Nvidia’s RTX 3060 Ti has a base clock of 1410MHz, and it boosts up to 1665MHz. The clock speed of the B580 is fixed at 2670MHz.
  3. VRAM: There is 12GB of GDDR6 VRAM on the ARC B580. The RTX 3060 Ti has 8GB of VRAM but with a wider 256-bit bus.
  4. TDP: The ARC B580 has a TDP of 190 watts, whereas the RTX 3060 Ti is rated for a TDP of 200 watts.
  5. Supported Technologies: Frame generation, both the new multi-frame generation and the old one, is not supported on the RTX 3060 Ti, while the B580 has about all the features that the RTX 40 series of cards have.

If the RTX 30 series had not been ruined because of the pandemic and multiple factors jacking the price up to an unreal amount, they would’ve been very great in price to performance. Intel just released a card focused on price to performance, so let’s see how they compare in the ARC B580 vs RTX 3060 Ti comparison.


Gaming Benchmarks – 1440p

Talking about the on-paper specifications is one thing, but the real comparison starts when we look at the performance of these cards in games. We will pit them against each other on a measured test bench, the specs of which are written below:

Test Bench

Star Wars Jedi: Survivor

Star Wars Jedi Survivor
Star Wars Jedi: Survivor @1440p (Image By Tech4Gamers)
  • In the first game of our testing, the RTX 3060 Ti had a slightly better performance with an average framerate of 53 FPS, whereas the ARC B580 was 4% slower with a framerate of 51 FPS.
  • The 1% lows were about 5% apart, with the RTX 3060 Ti’s minimum framerate dropping to about 41 FPS. The B580 was a tad slower, with a minimum framerate of 39 FPS.

A Plague Tale: Requiem

A Plague Tale Requiem
A Plague Tale Requiem @1440p (Image By Tech4Gamers)
  • The Intel card did a bit better in our test of A Plague Tale: Requiem, with a framerate of 56 FPS. It was about 5% better than the 53 FPS of the RTX 3060 TI.
  • The minimum framerate was also slightly better on the ARC B580, at about 45 FPS, while the 3060 Ti was 4% slower, at about 43 FPS.

Cyberpunk 2077

Cyberpunk 2077
Cyberpunk 2077 @1440p (Image By Tech4Gamers)
  • There was a bigger 8% difference in Cyberpunk 2077, with the ARC B580 getting a framerate of 63 FPS, whereas the 3060 Ti held closer to about 58 FPS in our testing.
  • The RTX 3060 Ti had 1% lows of around 49 FPS, which was about 4% lower than the 51 FPS of the ARC B580.

Dying Light 2

Dying Light 2
Dying Light 2 @1440p (Image By Tech4Gamers)
  • Our test of Dying Light 2 ran a bit better on the B580, with a framerate of around 55 FPS, whereas the RTX 3060 Ti was almost 6% slower, with an output of around 52 FPS.
  • The minimum framerates hung around 45 FPS on the B580, which was about 10% faster than the 41 FPS of the RTX 3060 Ti.

Dragon Age: The Veilguard

Dragon Age The Veilguard
Dragon Age The Veilguard @1440p (Image By Tech4Gamers)
  • The 3060 Ti came out on top in this test. It had a framerate of 48 FPS, which was about 12% higher than the 43 FPS average of the ARC B580.
  • The lows were about 9% apart, with the RTX 3060 Ti hovering closer to 37 FPS, whereas the ARC B580 had a performance of about 34 FPS.

Marvel’s Spider-Man Remastered

Marvel Spider-Man Remastered
Marvel Spider-Man Remastered @1440p (Image By Tech4Gamers)
  • The averages were about 8% apart in our test of Spider-Man Remastered, where the ARC B580 had a framerate of about 106 FPS, while the RTX 3060 Ti hovered closer to around 98 FPS.
  • There was a 4% difference between these cards, with the Battlemage GPU hanging out around 79 FPS, whereas the RTX 3060 Ti hovered closer to around 76 FPS.

Hogwarts Legacy

Hogwarts Legacy
Hogwarts Legacy @1440p (Image By Tech4Gamers)
  • The 3060 Ti had a much higher framerate in this game, with an average of 69 FPS. It outclassed the B580 by around 17% by getting a framerate of about 59 FPS.
  • The minimum framerates were also higher on the RTX 3060 Ti at around 45 FPS as opposed to the 42 FPS of the B580.

The Last Of Us Part 1

The Last Of Us
The Last Of Us @1440p (Image By Tech4Gamers)
  • The final game we tested ran better on the Intel graphics card with a framerate of 54 FPS, which was about 25% higher than the 43 FPS of the RTX 3060 Ti.
  • The Nividia card had a minimum framerate of only about 20 FPS in The Last Of Us Part 1, whereas the ARC B580 performed over twice as well with a framerate of 44 FPS.

Productivity Benchmarks

Now that we’ve gone over how these chips perform in gaming, the next section will focus on their performance in some popular synthetic benchmarks. The following tests were done using the same test bench mentioned above, so take a look at that if you need to.

3DMark 

3DMark
3DMark (Image By Tech4Gamers)
  • The ARC B580 outclassed the RTX 3060 Ti by around 32% when we ran the 3DMark Timespy benchmark on both graphics cards.
  • The RTX 3060 Ti had a score of about 12127 points, whereas the ARC B580 had a score of around 16004 points.

ComputeMark

ComputeMark
ComputeMark (Image By Tech4Gamers)
  • In ComputeMark, the RTX 3060 Ti lagged behind by a small 3.18%. This difference reflected our findings in the gaming benchmarks quite well.
  • The RTX 3060 Ti got a score of around 23241 points, which was a hair lower than the 23981 points that the ARC B580 got.

Unigine Valley

Unigine Valley
Unigine Valley (Image By Tech4Gamers)
  • The RTX 3060 Ti performed around 5% worse in our Unigine Valley benchmark, which once again lined up with the tests we did prior.
  • The ARC B580 rendered this test at around 128 FPS, whereas the RTX 3060 Ti had a score of around 122 FPS.

Overall Performance

GPURTX 3060 TiARC B580
Average FPS📈59.25📈60.87
1% Lows📉44📉47.37
Productivity (Rating)✏️6.19/10✏️7/10
Winner: ARC B580

Average Framerate

The RTX 3060 Ti and ARC B580 seemed equally matched in our testing. Though both graphics cards had varying levels of performance from game to game, they outpaced each other at about the same rate. Overall, though, the ARC B580 was only about 3% faster.

1% Lows

After compiling the 1% lows from all the games we tested, we saw that the ARC B580 had almost 8% better performance. The dramatic shift between the difference in averages and 1% lows are a few games that did not run as well on the RTX 3060 Ti, probably because of its smaller VRAM buffer.

Synthetics

The ARC B580 outpaced the RTX 3060 Ti in the synthetic benchmarks, too, but not by a lot. The synthetic benchmarks show us the larger trend we saw with the gaming benchmarks, which is that the RTX 3060 Ti is a hair slower than the ARC B580.


Power Consumption

GameRTX 3060 TiARC B580
Star Wars Jedi: Survivor318265
A Plague Tale: Requiem320267
Cyberpunk 2077317268
Dying Light 2309263
Dragon Age: The Veilguard311269
Marvel's Spider-Man Remastered316267
Hogwarts Legacy312255
The Last Of Us Part 1316274
Average Power Draw314.87⚡266⚡
Winner: ARC B580

The RTX 30 series of cards were known to be power-hungry, and this remains true for the RTX 3060 Ti as well. In our testing, it took around 18% more power than the ARC card. Though not a huge difference, the RTX 3060 Ti does come recommended with a 550-watt power supply, while the B580 is recommended to be used with a 450-watt PSU.


Price And Value

GPURTX 3060 TiARC B580Price Difference
Launch MSRP💲399💲24960.24%
Current Price💲349💲26929.74%

Even though the RTX 3060 Ti has been out for a while, the going rate for it is only $50 lower than MSRP on eBay. This makes it about 30% more expensive than the B580. Scalping and shortages have made Nvidia cards almost too expensive to buy in any price bracket.


What We Recommend

RTX 3060 Ti: Though it did not perform as well as the B580 and it costs a bit more, we can see the appeal of getting this card instead of the Intel ones. Nvidia makes reliable cards, and they have been doing so for a while, except for the odd product, and this reliability outweighs the benefits that the B580 brings.

Intel ARC B580: On the other side of the argument, we have the Intel ARC B580. Though it is more of a risk to buy (because of new issues surfacing with this new product), the sheer price-to-performance ratio of this card can not be understated. 

If you can’t find an RTX 3060 Ti for a reasonable discount, we would recommend getting an ARC B580 because of its great price-to-performance ratio out of the box. If you do find the Nvidia card for cheaper, it might be worth considering.

FAQs

What is the difference in release dates between these two cards?

The ARC B580 was released about 4 years and one month after the ARC B580.

Is the VRAM of the RTX 3060 Ti a limitation?

The RTX 3060 Ti has only eight gigs of VRAM, which is becoming the minimum for modern games. 

What is the codename for the ARC B580’s GPU family?

The ARC B580’s generation of Intel cards is dubbed “Battlemage”.

How wide is the memory bus on the ARC B580?

The ARC B580 has a 192-bit memory bus.

How wide is the memory bus on the RTX 3060 Ti?

The RTX 3060 Ti has a 256-bit memory bus.


Why The Pathologic Series Remains One of My Favorites

Story Highlights

  • The game offers a unique atmosphere of decay and despair.
  • The layered narrative indulges players in moral dilemmas and philosophical questions.
  • Pathologic games stand out as cult classics that value artistic vision over mainstream appeal.
  • The games provoke deep reflection that stays with you long after you’re done playing.

When discussing games that leave a lasting impression on the player, the Pathologic series consistently rises to the top of my list. Developed by a Russian studio, Ice-Pick Lodge, Pathologic and Pathologic 2 are far from your typical gaming experiences.

The games are bleak, challenging and often unsettling. Yet, these qualities make them so memorable and rewarding. Let’s dive right into why the series holds a special place in my heart.

A World Like No Other

It all started with the debut of the first Pathologic game in 2015, which was an instantaneous hit among players. A few years later, Pathologic 2 was released, offering the same intensity and horror. The third game of the series is currently in production and planned to be released this year, 2025.

Pathologic Classic
Pathologic Classic HD – Image Credits [Steam]
The world of Pathologic is one of the most unique and atmospheric settings I have ever experienced in gaming. Set in a mysterious plague-ridden town, the environment of the games is steeped in decay and despair and also gives the player a haunting sense of inevitability. 

In the games, the town feels alive, with its streets full of desperate citizens trying to survive, ominous figures and the suffocating presence of the sand plague. In both games, every corner of the world tells a story.

Uncompromising Storytelling

Modern games have learned to target psychology to keep players hooked, and the Pathologic games, though older, are no exception. The Pathologic games don’t just tell a story; they immerse you in it. Both games feature a complex and layered narrative full of philosophical questions, moral dilemmas and unsettling revelations. 

Pathologic 2
Pathologic 2 – Image Credits [Pinterest]
In the games, you play as one of three protagonists, each with their own motivations and goals. Your decisions shape not just your story but the fate of the whole town. Pathologic 2 builds on the narrative depth of the original, refines character arcs and puts more emotional weight on player choices.

The games’ refusal to provide easy answers or comforting resolutions is a testament to their amazing storytelling.

A Test of Endurance

Pathologic games are notorious for their difficulty, and this is no mistake. The game mechanics of the Pathologic series, which include resource scarcity, time pressure and a constant threat of disease, are all designed to make you feel the weight of your characters’ struggles.

pathologic 2
Pathologic 2 Gameplay – Image Credits [Steam]
Every day in the town is a battle for survival, and the sense of accomplishment you get when you persevere is unparalleled. Pathologic 2 intensifies this sense of urgency and vulnerability with its realistic survival mechanics.

Themes That Resonate

The Pathologic series is unique in that it explores profound themes, unlike other games. Like games like Layers of Fear, the Pathologic games use psychological tension to provoke introspection and unease. 

Both Pathologic games explore the nature of death, sacrifice and the human condition, making you think about the experience long after you’re done playing. The plague itself is a metaphor for societal collapse, moral corruption and the fragility of life, making the message of the games as relevant today as it was when they were released.

A Cult Classic with Soul

While the series may not have achieved mainstream success, it has earned a devoted following for its ambition and originality. The original Pathologic’s rough edges have a way of adding to its charm, while Pathologic 2 refines the experience without losing sight of what made the experience special.

Final Thoughts

Pathologic games aren’t just games. They are an experience that stays with you. The series reminds me of what games can be when they prioritize artistic vision over mass appeal. For their thought-provoking narratives, unforgettable atmosphere and difficulty, Pathologic 1 and Pathologic 2 remain two of my favorite games ev

ARC B580 Vs RTX 4060 Ti – Our Detailed Analytics

Nvidia GeForce RTX 4060 Ti

Rated: 8.2/10

Intel ARC B580

Rated: 8.4/10


Pros And Cons

GPUProsCons
Intel ARC B580✅ Outstanding Value for money
✅ Good graphics and AI performance
❌ Lags in transistor density
❌ Driver concerns
Nvidia RTX 4060 Ti✅ Great 16GB VRAM performance
✅ Better ray tracing ability
❌ Comparatively low power &
thermal efficiency

Key Takeaways

  • The RTX 4060 Ti beats the Arc by B580 by 17.2% in our gaming benchmarks and provides roughly a 12% edge in productivity.
  • Regarding GPU efficiency under stress, the Arc B580 draws 35.3% less power and stays at around 3% cooler temperature than the RTX 4060 Ti.
  • As of January 2025, the RTX 4060 Ti’s 16GB variant still costs around $480, while the Arc B580 is available with a price tag of $250.
  • We recommend the RTX 4060 Ti to harness more performance, while the Arc B580 is an excellent choice for its value.


Comparison Table

FeatureIntel ARC B580Nvidia RTX 4060 Ti
GPU Variant
SRPMFAD106-351-A1
Shading Units25604352
Ray Tracing Cores2034
ROPs8048
GPU ClockDefault 2670 MHzBase: 2310 MHz
Boost 2535 MHz
Memory Bandwidth456.0 GB/s288.0 GB/s
TDP190 watts165 watts
Suggested PSU450 watts450 watts
Maximum GPU Temperature88°C90°C
Best Variants-Best RTX 4060 Ti cards

Architectural Difference

  • Architecture: The Arc B580 is based on Intel’s advanced low-power Xe2 microarchitecture, whereas the RTX 4060 Ti is based on Nvidia’s current Ada Lovelace architecture.
  • Process Node: Coming to the fabrication node, the BMG-G21 chip used in Intel’s Arc B580 and the AD106 chip of the RTX 4060 Ti are manufactured using the same 5nm process technology at TSMC.
  • Clock Speed: The default clock of the Arc B580 is 15.6% faster than the base clock and about 5.3% greater than the boost clock of the RTX 4060 Ti.
  • VRAM: Intel provides a pretty good 192-bit 12GB GDDR6 memory with the Arc B580, having a speed of 19 Gbps, while the RTX 4060 Ti features a 128-bit 16GB GDDR6 VRAM with a speed of 18 Gbps.
  • Advanced Technologies: The Arc B580 supports Intel Xe Super Sampling (XeSS). In contrast, the RTX 4060 Ti comes with Nvidia’s strong DLSS 3.0 technology.

Intel recently launched an affordable 12GB Arc B580 graphics card with cutting-edge technologies. It is often referred to as the Killer of the Nvidia RTX 4060. However, to assess its potential today, we’ll compare the performance and efficiency of the Arc B580 vs RTX 4060 Ti.


Gaming Benchmarks

From the specs and architecture, the Arc B580 is competitive, but the RTX 4060 Ti gains an edge with 16GB VRAM. To evaluate the true capabilities, we tested the performance of the Arc B580 vs RTX 4060 Ti across eight graphically demanding games at 1080p resolution.

Test Bench

The gaming system we used to play these games had the following specifications.

Forza Horizon 5

Gameplay Stats
Forza Horizon 5 Benchmarks at 1080p – Image Credits (Tech4Gamers)
  • Starting our benchmarks with Forza Horizon 5, we get a 31 FPS or a 36% average performance boost using the RTX 4060 Ti, supplying a 117 FPS average against the Arc B580’s 86 FPS.
  • In terms of low 1% performance, the RTX 4060 Ti managed to deliver 92 FPS, while the Arc B580 came with 74 FPS, again a performance gap of around 24.3%.

Ghost of Tsushima

Gameplay Stats
Ghost of Tsushima Benchmarks at 1080p – Image Credits (Tech4Gamers)
  • During Ghost of Tsushima, the Arc B580 surprisingly drove a 50 FPS average, a 1 FPS or 2.0% better frame rate than the RTX 4060 Ti.
  • Regarding the low 1% performance, the Arc B580 leads by a marginal 13.2%, providing 43 FPS against the 38 FPS rendered by the RTX 4060 Ti.

Alan Wake 2 – RT

Gameplay Stats
Alan Wake 2 Benchmarks at 1080p – Image Credits (Tech4Gamers)
  • In our gaming session of Alan Wake 2, we enabled ray tracing, and the RTX 4060 Ti rendered 25 FPS on average, a 56.2% greater performance than the Arc B580’s 16 FPS.
  • Considering the worst 1% performance, the RTX 4060 Ti leads with almost double performance, providing 21 FPS in response to the 11 FPS by the Arc B580.

God of War: Ragnarok

Gameplay Stats
God of War: Ragnarok Benchmarks at 1080p – Image Credits (Tech4Gamers)
  • While playing God of War: Ragnarok, the RTX 4060 Ti achieved a 67 FPS average, outperforming the Arc B580’s 53 FPS by 26.4%.
  • In the worst-case 1% scenario, the RTX 4060 Ti offers 56 FPS, outperforming the ARC B580’s 46 FPS by a beautiful lead of 21.7%.

Cyberpunk 2077 – RT

Gameplay Stats
Cyberpunk 2077 Benchmarks at 1080p – Image Credits (Tech4Gamers)
  • In Cyberpunk 2077, we again enable ray tracing, and the RTX 4060 Ti averaged 50 FPS, 6 FPS (13.6%) higher than the Arc B580’s 44 FPS.
  • The RTX 4060 Ti outshines the ARC B580 in the low 1% performance, achieving 40 FPS versus 35 FPS.

Horizon Forbidden West

Gameplay Stats
Horizon Forbidden West Benchmarks at 1080p – Image Credits (Tech4Gamers)
  • During Horizon Forbidden West, the RTX 4060 Ti yielded 61 FPS on average, about 8.9% finer than the Arc B580’s performance of 56 FPS.
  • We observed that the RTX 4060 Ti scores 49 FPS at its worst 1% performance in this gameplay, only 3 FPS more than the ARC B580’s 46 FPS.

Senua’s Saga – Hellblade II

Gameplay Stats
Senua’s Saga – Hellblade II Benchmarks at 1080p – Image Credits (Tech4Gamers)
  • The RTX 4060 Ti achieved 39 FPS in Senua’s Saga – Hellblade II, providing 18.2% better performance compared to the Arc B580’s 33 FPS.
  • Regarding the 1% low frame rate, the RTX 4060 Ti delivered 31 FPS, leaving the ARC B580 far behind at 26 FPS.

Silent Hill 2

Gameplay Stats
Silent Hill 2 Benchmarks at 1080p – Image Credits (Tech4Gamers)
  • In our last gaming session of Silent Hill 2, the RTX 4060 Ti offered a 43 FPS average, 19.4% higher than the 36 FPS average furnished by the Arc B580.
  • At its worst 1% performance, the RTX 4060 Ti delivers a nearly 17.2% advantage over the ARC B580, achieving 34 FPS versus 29 FPS.

Productivity Benchmarks

Passmark

Passmark Benchmark
Scores achieved in Passmark Benchmark – Image Credits (Tech4Gamers)
  • The PassMark stress test results reveal that the RTX 4060 Ti demonstrates significantly greater capability, beating the Arc B580 by an impressive margin of approximately 33.5% more excellent score.

Steel Nomad (DX12)

Steel Nomad (DX12) Benchamrsk
Scores achieved in Steel Nomad (DX12) Benchmarks – Image Credits (Tech4Gamers)
  • Based on our stress tests, we conclude that the RTX 4060 Ti surpasses the Arc B580 in graphics performance, delivering approximately 14.1% superior processing capabilities.

Geekbench 6 (Vulkan)

Geekbench 6 (Vulkan) Beanchmarks
Geekbench 6 (Vulkan) Beanchmarks – Image Credits (Tech4Gamers)
  • According to our performance results of these two GPUs in the Geekbench 6 (Vulkan) benchmarks, the RTX 4060 Ti once again secures a commanding lead, outpacing the Arc B580 by an impressive margin of approximately 22%.

Overall Performance

StatsIntel Arc B580GeForce RTX 4060 Ti
Average FPS📈48.1📈56.4
Low 1% FPS📉38.8📉45.1
Productivity✏️6.6✏️7.8
Winner: GeForce RTX 4060 Ti

Average Frame Rate

Our gaming benchmarks for the Arc B580 vs RTX 4060 Ti revealed that the RTX 4060 Ti outshines the Arc B580 in nearly every game pushed, offering a special performance edge of around 17.2%. However, we saw a distinct performance trend in Ghost of Tsushima, with the Arc B580 leading in performance.

Low 1% Frame Rate

Considering the worst 1% performance data for the above-tested games, we conclude that the RTX 4060 Ti can render around 16.2% higher frame rate than the Arc B580 at the low 1%.

Productivity

Based on the performance observed during our productivity tests, the RTX 4060 Ti is approximately 12% more efficient than the Arc B580 in handling intensive workloads, highlighting its prowess under demanding requirements.


Power Efficiency

GameIntel ARC B580 (W)Nvidia RTX 4060 Ti (W)
Alan Wake 2 - RT109151
Cyberpunk 2077 - RT118157
Forza Horizon 5112147
Ghost of Tsushima112145
God of War: Ragnarok107150
Horizon Forbidden West108148
Senua's Saga - Hellblade II113153
Silent Hill 2116159
Average Gaming Power Draw111.9 ⚡151.2 ⚡
Winner: Intel ARC B580

During our power efficiency analysis, the Arc B580 had relatively low power usage, operating at 111.9 watts, 35.3% less than the RTX 4060 Ti, which drew 151.2 watts.
In 1080p gaming performance tests, the Arc B580 produced an average of 0.43 FPS per watt, roughly 16.2% more efficiently than the RTX 4060 Ti’s 0.37 FPS per watt.


Thermal Efficiency

GameIntel ARC B580 (°C)Nvidia RTX 4060 Ti (°C)
Alan Wake 2 - RT5758
Cyberpunk 2077 - RT5557
Forza Horizon 55454
Ghost of Tsushima5557
God of War: Ragnarok5858
Horizon Forbidden West5960
Senua's Saga - Hellblade II5358
Silent Hill 25659
Average Gaming Temperature55.9 🌡️57.6 🌡️
Winner: Intel ARC B580

While playing games on the Arc B580 Vs RTX 4060 Ti, the temperature variation between the two GPUs was nominal. The Arc B580 averaged 55.9°C, whereas the RTX 4060 Ti ran at 57.6°C3.04% hotter.


Price And Availability

GPUIntel Arc B580Nvidia RTX 4060 TiPrice Difference
Launch Price💲249💲499100.0%
Current Price💲249💲47992.0%

The Arc B580 offers impressive efficiency and prime value for its price. However, if it’s out of stock at various vendors, you may need to pay extra for urgent delivery. Alternatively, you can check multiple sellers to find it quickly at its original price. On the other hand, the RTX 4060 Ti is readily available.


What We Recommend?

Intel Arc B580: The Arc B580 is a budget-friendly graphics card offering about 35% efficient and immersive gaming at 1080p. It also performs well in productivity tasks. It blends efficiency and performance, providing superb value for the price.

Nvidia RTX 4060 Ti: This high-performance GPU is engineered to deliver about 15-20% better gaming experiences and better ray tracing capabilities. It surpasses the Arc B580 in visual fidelity and immersive experience and excels in productivity tasks.

The Arc B580 is an excellent choice for low-resolution gaming and everyday productivity tasks, offering a compelling balance of performance and affordability. However, if your primary goal is to achieve higher performance at higher resolutions, we recommend the RTX 4060 Ti.


Frequently Asked Questions

What interfaces does the Arc B580 support?

The Arc B580 integrates with the system through a high-speed PCI-Express 4.0 x8 interface, ensuring efficient data transfer and performance.

Can the Arc B580 handle ray-traced games?

Yes. The Arc B580 supports ray tracing, and it features XeSS technology. However, Intel’s GPU ray tracing performance is not as good as Nvidia’s.

How do the Arc B580 and RTX 4060 Ti perform in 4K gaming?

The Arc B580 and RTX 4060 Ti are not designed for high-resolution gaming. However, the RTX 4060 Ti renders well at 4K, while the Arc B580’s performance is not good at 4K.

Does the RXT 4060 Ti experience overheating issues?

No, the RXT 4060 Ti has excellent thermal management, ensuring optimal performance even under demanding conditions.


RTX 5090 Vs RX 7900 XTX: We Took A Closer Look

AMD Radeon RX 7900 XTX

Rated:8.2/10

Nvidia GeForce RTX 5090

Rated: 9/10


Pros And Cons 

GPUProsCons
RTX 5090✅ Better RT performance
✅ Better raw performance
❌ Much more expensive
RX 7900 XTX✅ Lower price tag
✅ Lower power consumption
❌ Worse performance

Key Takeaways

  • The RTX 5090 had over double the performance in our gaming tests compared to the RX 7900 XTX; the productivity performance was a tier above the Radeon card as well.
  • Power consumption was about 30% higher on the Nvidia card, with both cards taking as much power as dedicated space heaters.
  • As of late January 2025, the RTX 5090 is twice as expensive as the RX 7900 XTX. This delta might change with the 7900 XTX getting cheaper or the 5090 getting more expensive.
  • The RTX 5090 is in a league of its own, and if you have a budget to consider buying it, it is a card that can serve you for years to come.


Comparison Table

FeatureRX 7900 XTXRTX 5090
PurposeGamingGaming
SegmentHigh-endHigh-end
ArchitectureRDNA 3.0Blackwell 2.0
GPU CodenameNavi 31GB202-300
Shading Units614421760
Texture Mapping Units (TMUs)384680
Render Output Units (ROPs)192340
Pixel Fill Rate480 GPixel/s819 GPixel/s
Memory TypeGDDR6GDDR7
Best VariantsBest RX 7900 XTX Graphics Cards-

Architectural Differences

  1. Clock SpeedThe RTX 5090 has a clock speed from 2017MHz to 2407MHz, whereas the RX 7900 XTX has a wider range from 1929MHz to 2498MHz.
  2. VRAM: The RTX 5090 has a whopping 32 gigabytes of GDDR7 memory connected with a 512-bit bus, which is better in all regards than the 24-gigabyte GDDR6 VRAM of the 7900 XTX connected with a 384-bit bus.
  3. TDPThe TDP of the RTX 5090 is an eyewatering 575 watts, which makes the 355 watts of the 7900 XTX seem like child’s play.
  4. Process NodeNvidia’s RTX 5090 is made with a 4nm manufacturing process, which is a bit more modern than the 5nm manufacturing process of the 7900 XTX.
  5. Other Technologies: AMD tried their best to match the features of the RTX 4090 with the RX 7900 XTX with features like FSR, Fluid Motion Frames, and Anti-Lag, but the 5090 has introduced new features like Reflex 2 and DLSS 4 multi-frame generation.

During its tenure, there was nothing in the GPU market quite like the RTX 4090, but a card has risen to take its place, none other than Nvidia’s own RTX 5090. How does it compare to AMD’s best offering? Keep reading the RTX 5090 Vs RX 7900 XTX comparison to find out!


Gaming Benchmarks – 4K

Having gone over the specs of these cards now is the time to get our eyes blown away by the performance of these cards in modern games. The following tests were done with a state-of-the-art test bench, the specs of which you can have a look at below:

Test Bench

Note: All games but the last two have no RT or AI upscaling/frame generation.

Marvel Rivals

 Marvel Rivals
Marvel Rivals @4K (Image By Tech4Gamers)
  • With Lumen on and everything turned up to the maximum, the RTX 5090 was a whopping 74% faster than the 7900 XTX, getting a framerate of 101 FPS, while the 7900 XTX got around 58 FPS.
  • The 5090 dipped to around 61 FPS in the 1% lows, which was still about 39% higher than the 44 FPS of the RX 7900 XTX.

Stalker 2

Stalker 2
Stalker 2 @4K (Image By Tech4Gamers)
  • The highest settings on Stalker 2 yielded an average framerate of 71 FPS on the RTX 5090, which was about 54% higher than the 46 FPS of the RX 7900 XTX.
  • Minimum framerates were about 33% apart, with the RTX 5090 getting a framerate of around 52 FPS, which is much higher than the 39 FPS of the Radeon card.

God Of War Ragnarok

God Of War Ragnarok
God Of War Ragnarök @4K (Image By Tech4Gamers)
  • This PS port ran excellently on both cards at 4K, with all settings maxed out. The Nvidia card managed a framerate of 195 FPS, which was about 82% higher than the 107 FPS of the 7900 XTX.
  • The 1% lows of the 5090 were around 166 FPS, which was about 75% higher than the 95 FPS of the AMD card.

Warhammer 40K: Space Marine 2

Space Marine 2
Space Marine 2 @4K (Image By Tech4Gamers)
  • Testing this game with all the settings turned up at 4K, we got around 125 FPS on the RTX 5090, which was noticeably smoother than the 89 FPS of the RX 7900 XTX, a difference of around 40%.
  • The minimum framerates were about 25% apart, with the RTX 5090 getting a framerate of 99 FPS, while the RX 7900 XTX hovered closer to about 79 FPS.

Star Wars Jedi: Survivor

Star Wars Jedi Survivor
Star Wars Jedi: Survivor @4K (Image By Tech4Gamers)
  • When we tested this game, there was a 70% difference in performance on average. The RTX 5090 hovered around 102 FPS , while the RX 7900 XTX kept a framerate of around 60 FPS.
  • The RTX 5090 had over double the framerate in the 1% lows at around 88 FPS, while the RX 7900 XTX was a bit choppy with a framerate of 40 FPS.

A Plague Tale: Requiem

 A Plague Tale Requiem
A Plague Tale: Requiem @4K (Image By Tech4Gamers)
  • Without any software trickery, the RTX 5090 had a framerate of 128 FPS in A Plague Tale: Requiem, which was about 83% higher than the 70 FPS that the RX 7900 XTX got with the same settings.
  • The minimum framerate was about 92 FPS with the 5090, which was 56% higher than the 59 FPS of the RX 7900 XTX.

Black Myth Wukong (RT + Upscaling/Frame-Gen)

Black Myth Wukong (RT)
Black Myth Wukong (RT) @4K (Image By Tech4Gamers)
  • We maxed out settings, including RT, in Black Myth Wukong and tested both GPUs with upscaling at quality, no frame-gen. The RTX 5090 averaged 110 FPS, while the 7900 XTX managed just 10 FPS—a 1000% difference.
  • The 1% lows followed the same trend, with the RTX 5090 getting a framerate of 94 FPS, while the 7900 XTX has 9 FPS, making the Nvidia card over 944% better.

Marvel Rivals (DLSS 4/FSR)

Marvel Rivals (DLSS 4)
Marvel Rivals (DLSS 4) @4K (Image By Tech4Gamers)
  • With DLSS4 and upscaling, the RTX 5090 averaged 418 FPS in Marvel Rivals, while the 7900 XTX hit 148 FPS with FSR, which adds up to an 182% higher framerate on the 5090.
  • The minimum framerates were around 177 FPS on the RTX 5090, whereas the RX 7900 XTX had a framerate of 66 FPS for its 1% lows, making the RTX 5090 168% faster.

Productivity Benchmarks

Having gone over the gaming benchmarks of these cards, we will now look at how these cards perform in productivity tests. The following benchmarks have been performed with the same test bench as the gaming benchmarks.

Blender

 Blender Barbershop
Blender Barbershop @4K (Image By Tech4Gamers)
  • The RTX 5090 finished rendering the Barbershop scene in about 30% of the time it took the RX 7900 XTX to complete rendering.
  • The RTX 5090 finished rendering the Barbershop scene in 26 seconds, whereas the 7900 XTX took its sweet time with a render time of around 87 seconds.

Davinci Resolve

Davinci Resolve
Davinci Resolve @4K (Image By Tech4Gamers)
  • In the Davinci resolve part of the Pudget systems benchmark, we saw that the RTX 5090 had a score of 20% higher than that of the RX 7900 XTX.
  • The 5090 garnered 12532 points in our testing, whereas the RX 7900 XTX scored closer to around 10322 points.

Premiere Pro

Premiere Pro
Premiere Pro @4K (Image By Tech4Gamers)
  • Finally, Premiere Pro ran about 20% better on the RTX 5090, which was expected considering all the results we saw beforehand.
  • The RTX 5090 had a score of around 14888 points in Premiere Pro, which was a bit higher than the 12512 points of the RX 7900 XTX.

Overall Performance

GPURTX 5090RX 7900 XTX
Average FPS📈156.25📈73.5
1% Lows📉103.62📉53.87
Productivity (Rating)✏️7/10✏️5.85/10
Winner: RTX 5090

Average Framerate

In our gaming tests, on average, the RTX 5090 is 112% faster than the RX 7900 XTX. This was mostly without the RTX 5090’s trump cards, that being Ray Tracing and upscaling. The RTX 5090 runs circles around the RX 7900 XTX, with and without its software trickery.

1% Lows

The performance of the RTX 5090 was 92% higher than the RX 7900 XTX in terms of 1% lows, which made a huge difference in some games. Modern games are hard to run with all the settings jacked up, even with the highest-end cards on the market. The boost to the 1% lows with the 5090 helps with smoothening this out.

Productivity

The RTX 5090 killed it in terms of productivity. It performed dramatically better than the RX 7900 XTX, and it has some features to accelerate further. Optix rendering is amazing on these cards, and this new card has also introduced 4:2:2 encoding, which is much more efficient than the traditional approach.

Power

GameRTX 5090RX 7900 XTX
Marvel Rivals537461
Stalker 2527424
God Of War Ragnarok528367
Space Marine 2517412
Star Wars Jedi: Survivor530381
A Plague Tale: Requiem509341
Cyberpunk 2077519417
Dying Light 2531453
Average Power Draw524.75⚡407⚡
Winner: RX 7900 XTX

Though the RTX 5090 took a lot of power, even compared to the RX 7900 XTX, the Radeon card was no slouch in this department. The RX 7900 XTX took 30% power, and it seems like it spits out half the performance, making the power-to-performance ratio of the RTX 5090 look amazing in comparison.


Price

GPURTX 5090RX 7900 XTXPrice Difference
Launch MSRP💲1999💲999100.1%
Current Price💲1999💲919117.52%

After all this discussion, we have finally reached the thorn in the side of the RTX 5090. With arguably double the performance, the RTX 5090 also had double the price. The RX 7900 XTX comes at half the price of the Nvidia card, and you can make a whole computer with the 7900 XTX as the centrepiece for the price of the RTX 5090.


What We Recommend

RTX 5090: As was with the RTX 4090 and the RTX 3090 before, there is nothing on the market quite like the RTX 5090. The feature set of this card is great to have around if you think of it as an extra and not like the whole point as Nvidia markets it, and the price matches the extravagance of this card.

RX 7900 XTX: The 7900 XTX delivers impressive raw performance but falls short on value due to its high price, though it still holds its ground in terms of price-to-performance ratio against the 5090. While its ray tracing lags behind Nvidia, it offers the raw, no-frills power gamers want in the AI era.

In our opinion, the people in the market to buy an RTX 5090 will buy one, and those looking at the 7900 XTX might find it better to go for an older 90-class card from Nvidia. However, if you only compare these two, the decision comes down to your price bracket.

FAQs

What is the size of the RTX 5090?

The founder’s edition of the RTX 5090 is only a 2-and-a-half slot card, slimming it majorly compared to its predecessor.

Is the pass-through cooling of the RTX 5090 bad for my PC?

Pass-through cooling is known to make the rest of your components hotter, though it doesn’t damage them in any way directly. 

Can you buy the RTX 5090 at its MSRP?

Yes, the RTX 5090 can currently be got for its MSRP, though this might change because of scalping in the future.

Does the RX 7900 XTX have DLSS?

No, DLSS is Nvidia’s proprietary upscaling software.

Does the RX 7900 XTX have multi-frame generation?

As of writing this article, the RX 7900 XTX does not have multi-frame generation.