


AMD Radeon RX 7900 GRE
Rated: 9/10
AMD Radeon RX 7900 XTX
Rated: 9.3/10
Pros & Cons
| GPU | Pros | Cons |
|---|---|---|
| RX 7900 GRE | ✅ Great performance at 4K. ✅ Excellent price point. | ❌ Higher power draw. ❌ Availability limited to China & Europe. |
| RX 7900 XTX | ✅ Extremely high gaming performance. ✅ Widely available. | ❌ Expensive. |
- Despite having the same architecture, the RX 7900 XTX leads the FPS performance charts against the RX 7900 GRE by providing a boost of 34.2% at 2160p.
- We noticed that the RX 7900 GRE provides better 25.7% power management compared to the RX 7900 XTX.
- The RX 7900 GRE takes the lead again when it comes to affordability as its price is 43% lower compared to the RX 7900 XTX.
- We recommend the RX 7900 XTX if you want extreme gaming performance at 4K and the RX 7900 GRE if you want decent performance on a budget.
Comparison Table
| Specifications | Radeon RX 7900 GRE | Radeon RX 7900 XTX |
|---|---|---|
| Shading Units | 5120 | 6144 |
| RT Cores | 80 | 96 |
| TMUs | 320 | 384 |
| ROPs | 192 | 192 |
| L1 Cache | 256 KB per Array | 256 KB per Array |
| L2 Cache | 6 MB | 6 MB |
| Bus Width | 256 bit | 384 bit |
| Memory Bandwidth | 576.0 GB/s | 960.0 GB/s |
| Suggested PSU | 600W | 750W |
| Release Date | Jul 27th, 2023 | Nov 3rd, 2022 |
| Best Variants | - | Best RX 7900 XTX Graphic Cards |
Architectural Differences
- Process Node: To begin with, the RX 7900 GRE boasts a TSMC 5nm process node, mirroring the RX 7900 XTX’s TSMC 5nm process node.
- Clock Speed: Embracing high clock speeds, the RX 7900 GRE showcases base and boost clock speeds of 1500 MHz and 2245 MHz, while the RX 7900 XTX boasts a base clock of 1855 MHz and boost clock of up to 2499 MHz.
- VRAM: The RX 7900 GRE is equipped with a substantial 16GB GDDR6 VRAM, whereas the RX 7900 XTX takes the lead with an impressive 24GB GDDR6.
- TDP: When going over the power efficiency sector, while the RX 7900 GRE maintains a 260W TDP, the RX 7900 XTX pushes the boundaries with a higher 355W TDP.
- Supported Technologies: Concluding with the supported technologies, both the RX 7900 GRE and RX 7900 XTX come armed with FSR technology, aiming to enhance gaming experiences with this common feature.
Welcome to a comprehensive exploration of the graphics battleground as we review the latest release from Radeon, the RX 7900 GRE vs RX 7900 XTX. In this article, we’ll dive deep into the specifications, architectural differences, and performance benchmarks of these cards.
RX 7900 GRE Vs RX 7900 XTX: Benchmarks At 4K
Keep your eyes peeled as we’re about to dissect the performance of these GPUs across various titles at 4K resolution. Buckle up as we delve into FPS and the critical 1% lows, revealing how these cards handle the challenges of modern gaming.
Testing Rig
- CPU: AMD Ryzen 7 7800X3D
- Memory: XPG Lancer RGB 32B 6000MHz DDR5 RAM
- SSD: XPG GAMMIX S70 BLADE 2TB NVMe
- Power Supply: be quiet! Dark Power Pro 13 1300W
The Last Of Us Part I
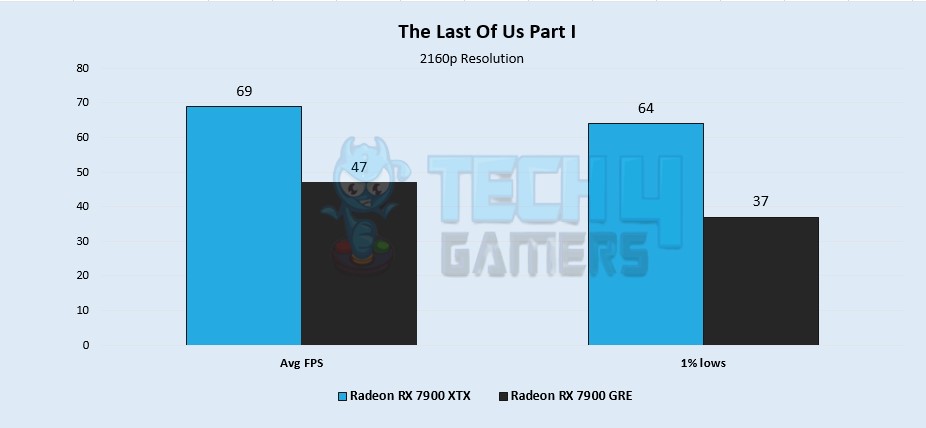
- We observe that the RX 7900 XTX maintains its prowess by obtaining an average of 69 FPS, a substantial 37.9% advantage over the RX 7900 GRE’s performance of 47 FPS.
- In the 1% lows category, the RX 7900 XTX takes the lead with an impressive 53.4% difference, maintaining a 1% low of 64 FPS, while the RX 7900 GRE lags at 37 FPS.
Resident Evil 4
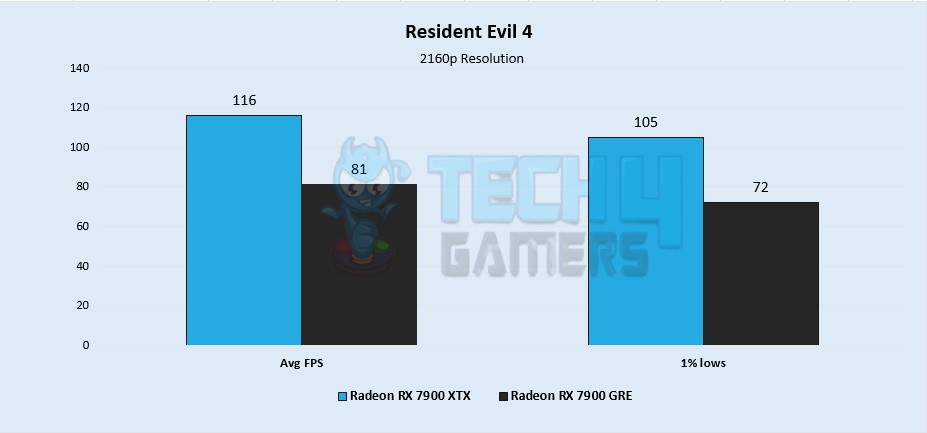
- While going over Resident Evil 4 at 2160p, the RX 7900 XTX secures a dominant lead with an average FPS of 116, outclassing the RX 7900 GRE’s 81 FPS by 35.5%.
- The RX 7900 XTX captures a commanding 37.2% lead in 1% lows, achieving a noteworthy 1% low of 105 FPS, compared to the GRE’s performance of 72 FPS.
Forza Horizon 5
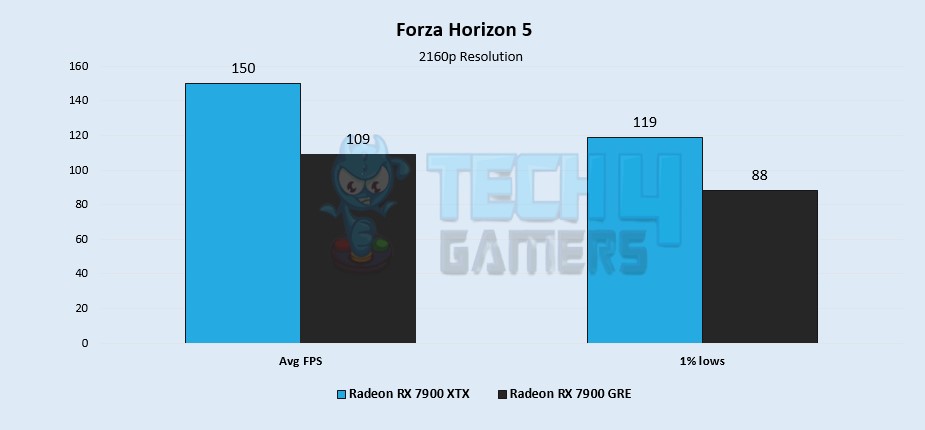
- Boasting a significant advantage in Forza Horizon 5, the RX 7900 XTX achieves an average FPS of 150, showcasing a 31.6% lead over the RX 7900 GRE’s 109 FPS.
- Showcasing its gaming prowess, the RX 7900 XTX also secures a 29.9% lead in 1% lows as well, achieving a 1% low of 119 FPS, while the RX 7900 GRE delivers 88 FPS.
Hogwarts Legacy
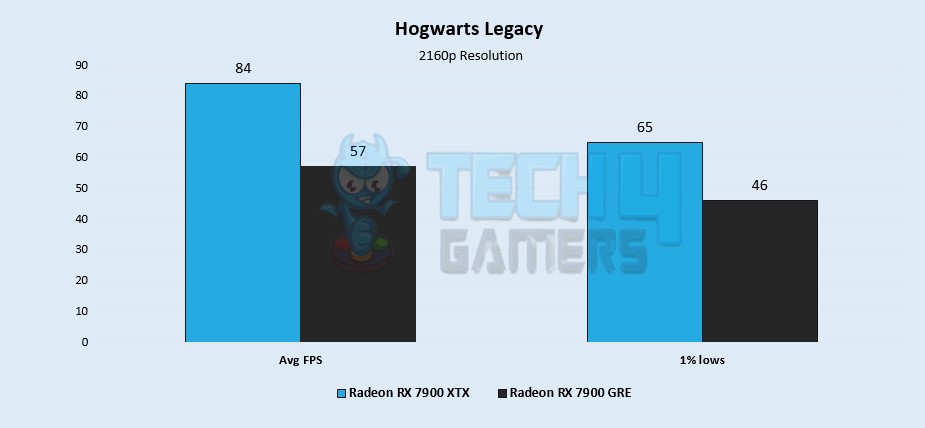
- Here, we see that the RX 7900 XTX takes the lead with an average FPS of 84, presenting a substantial 38.2% advantage over the RX 7900 GRE’s performance of 57.
- The RX 7900 XTX establishes a notable 34.2% lead in 1% lows, attaining a 1% low of 65 FPS, compared to the RX 7900 GRE’s 46 FPS.
A Plague Tale Requiem
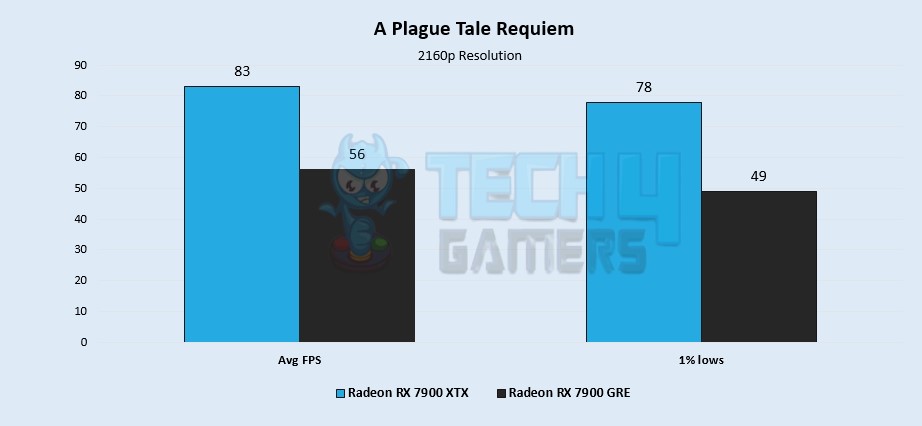
- We notice that the RX 7900 XTX delivers an impressive lead with an average FPS of 83, showcasing a remarkable 38.8% edge over the RX 7900 GRE’s performance of 56.
- While going over the 1% low performance, the RX 7900 XTX maintains a 45.6% lead, achieving an impressive 1% low of 78 FPS, while the RX 7900 GRE trails at 49 FPS.
Overall Gaming Performance
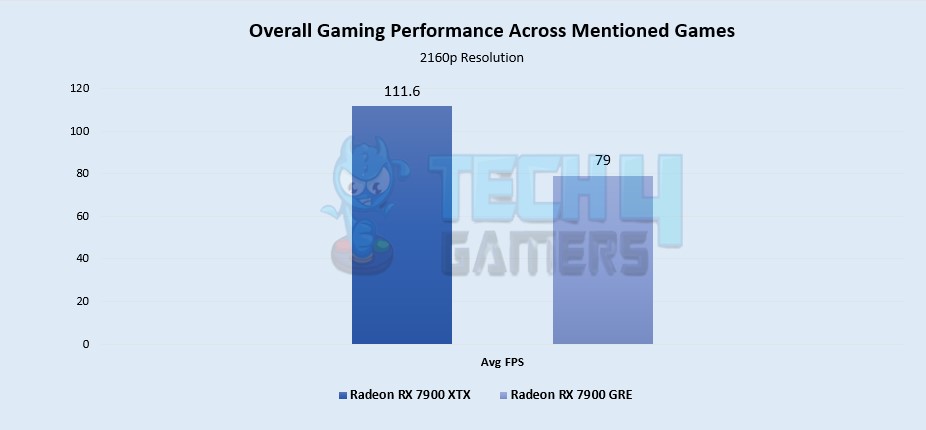
When it comes to the practical difference in gaming experience, we see that the RX 7900 XTX achieves an average FPS of 111.6, in contrast to the RX 7900 GRE’s average FPS of 79. The benchmarks reveal a 34.2% advantage of the RX 7900 XTX over the RX 7900 GRE in terms of FPS at 4K.
Power Consumption
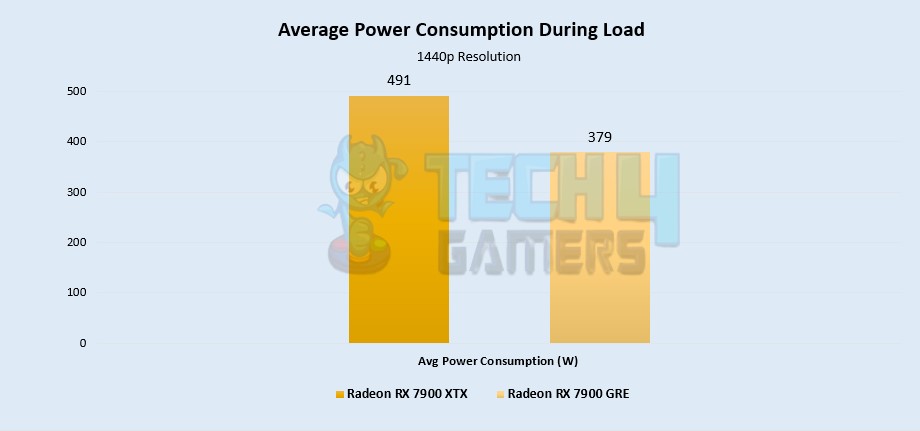
When it comes to power consumption, we see that the RX 7900 XTX draws 491W, while the RX 7900 GRE consumes only 379W, indicating a clear difference in their energy usage. Notably, the RX 7900 GRE exhibits a considerable 25.7% power efficiency advantage over the RX 7900 XTX.
Pricing And Value
| GPU | MSRP | Current Price |
|---|---|---|
| RX 7900 GRE | 💲649 | 💲619 |
| RX 7900 XTX | 💲929 | 💲959 |
| Price Difference | 35.4% | 43% |
The RX 7900 GRE faced a slight reduction in its price, 4.7% to be exact. In contrast, the price of the RX 7900 XTX has been slightly increased for some of its variants, around 2.1% to 3.1% to be precise. Nonetheless, some of its variants are still being sold at their launch price. In general, the RX 7900 GRE is 43% cheaper than the RX 7900 XTX.
Conclusion – Which One Would We Recommend?
RX 7900 XTX: The RX 7900 XTX is best for those looking to get the most out of their GPU, especially at 4K. It offers an extremely high performance by pushing over 100 FPS easily at 4K. This also enables enthusiasts to play games with Ray Tracing enabled. It is also readily available online, making it more accessible to users.
RX 7900 GRE: The RX 7900 GRE is a perfect option for people who want a card with decent performance on a budget. Additionally, it has a much lower power consumption. If you can find and acquire it, you very well should because of the value it offers.
Now, the decision depends upon the accessibility of these cards. If you have both of them in your range, you should make the decision based on your preferences and budget.
More From RX 7900 GRE
More From RX 7900 XTX
Thank you! Please share your positive feedback. 🔋
How could we improve this post? Please Help us. 😔
[Hardware Reviewer]
Hi! I’m Ali Tauseef, and I have been writing for Tech4Gamers since 2022. I love all things computer hardware but am particularly fond of CPUs and motherboards, and I like to stay up-to-date about the latest advancements in these worlds, and when possible, write about it. When I’m not doing that, I like to get into a little FPS action in CS2 or get lost in the vast world of RDR2.
Get In Touch: ali@tech4gamers.com


