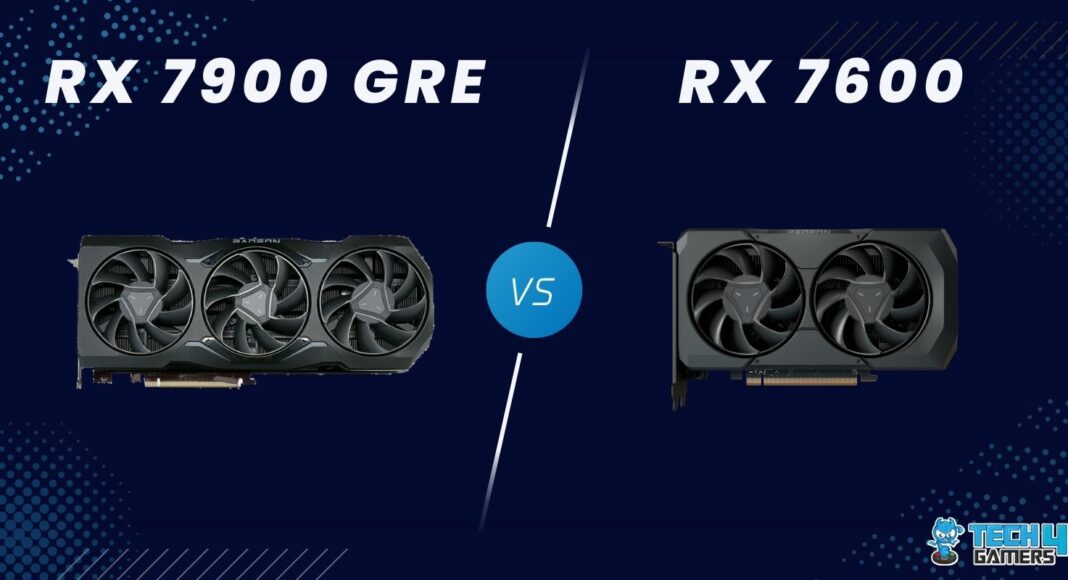
AMD Radeon RX 7900 GRE
Rated: 8/10
AMD Radeon RX 7600
Rated: 7.3/10
Pros & Cons
| GPU | Pros | Cons |
|---|---|---|
| RX 7900 GRE | ✅ Good performance at 4K & 1440p. ✅ A middle ground in price & performance. | ❌ Higher price. ❌ Availability limited to China & Europe. |
| RX 7600 | ✅ Great for 1080p gaming. ✅ Lower power draw than the RX 7900 GRE. | ❌ Stuttery performance at 4K & 1440p. |
- We observed that the RX 7900 GRE, compared to the RX 7600, is 56.2% faster at 1440p and 72% better at 4K.
- The RX 7600 is 43.2% more power-efficient than the RX 7900 GRE, drawing about 151 watts less power.
- As of February 2024, we have seen that the RX 7600 is 75.7% cheaper than the RX 7900 GRE.
- We recommend the RX 7600 as a budget card for 1080p gaming and the RX 7900 GRE if you’re not on a budget and can acquire this card despite its limited availability.
Comparison Table
| Specifications | Radeon RX 7900 GRE | Radeon RX 7600 |
|---|---|---|
| Shading Units | 5120 | 2048 |
| RT Cores | 80 | 32 |
| TMUs | 320 | 128 |
| L1 Cache | 256KB (per SM) | 128KB (per SM) |
| L2 Cache | 6MB | 2MB |
| Memory Bandwidth | 576GB/s | 288GB/s |
| Suggested PSU | 600W | 450W |
| Release Date | Jul 27th, 2023 | May 24th, 2023 |
| Approximate Price | $650 | $269 |
| Best Variants | – | Best RX 7600 Graphic Cards |
| Best CPU | – | Best CPUs for RX 7600 |
Architectural Differences
- Process Node: Both graphics cards use a chipset design, using 5nm and 6nm manufacturing nodes in various parts of their architecture.
- Clock Speed: The base clock of the 7900 GRE is around 1500MHz, whereas it can boost to 2245MHz. The 7600 has a base and boost clock reaching around 1720MHz and 2655MHz, respectively.
- TDP: The GRE only utilizes close to 57% more power than its brethren, having a 260-watt TDP against the 165-watt requirement of the RX 7600.
- Bus Width: The RX 7900 GRE doubles the bus width of the RX 7600 with a 256-bit bus instead of the 128-bit bus of the 7600.
- VRAM: The RX 7900 GRE also crushes the RX 7600 in terms of VRAM, doubling the 8GB capacity of the lower-end card to 16GB, both utilizing the GDDR6 technology.
The RX 7900 GRE is AMD’s attempt to launch a more affordable high-end graphics card than the RX 7900 XT and the XTX. This has consumers wondering how it performs against the lowest tier card in AMD’s lineup, and our analysis of the RX 7900 GRE vs RX 7600 will answer exactly that.
RX 7900 GRE Vs RX 7600: Gaming Benchmarks
The specifications on paper paint this comparison as a bloodbath for the RX 7600, but to find if the architectural gains of the GRE translate well to real-world gaming, it is better to test them. We decided to test these cards at 1440p to see their base performance and also at 4K to see the full extent of their performance difference.
Testing Rig
- CPU: Ryzen 7 7800X3D
- Memory: XPG Lancer RGB 32B 6000MHz DDR5 RAM
- SSD: XPG GAMMIX S70 BLADE 2TB NVMe
- Power Supply: be quiet! Dark Power Pro 13 1300W
- CPU Cooler: be quiet! Dark Rock Pro 4 CPU Cooler
The Last Of Us
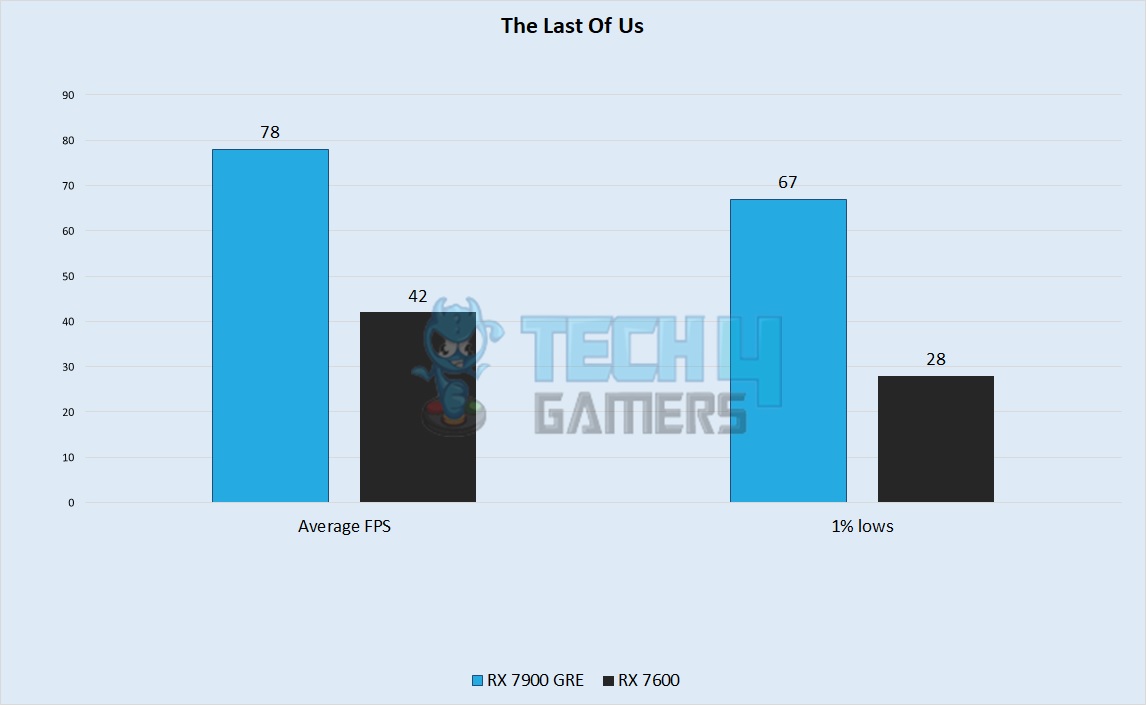
- For the first game, we saw a 78 FPS average on the GRE, whereas the 7600 got an average of 42 FPS. This brought the advantage the 7900 GRE had over its little brother to 85%.
- 1% lows were refreshing on the 7900 GRE at around 67 FPS, whereas the 7600 faltered with unplayable lows of 28 FPS.
Resident Evil 4
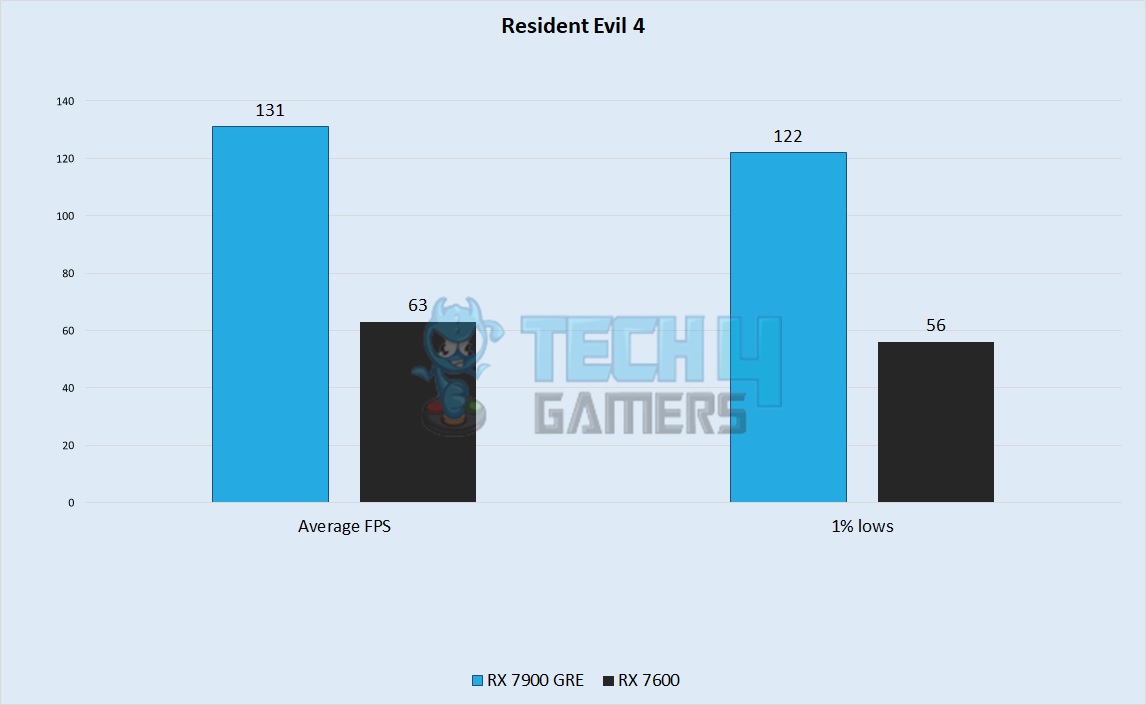
- The higher-end card comfortably got 131 FPS on average, whereas the RX 7600 got an enjoyable framerate of around 63 FPS – meaning a 70.1% difference in performance.
- 1% lows were also twice as good on the 7900 GRE at 122 FPS, compared to the 56 FPS lows of the 7600.
Forza Horizon 5
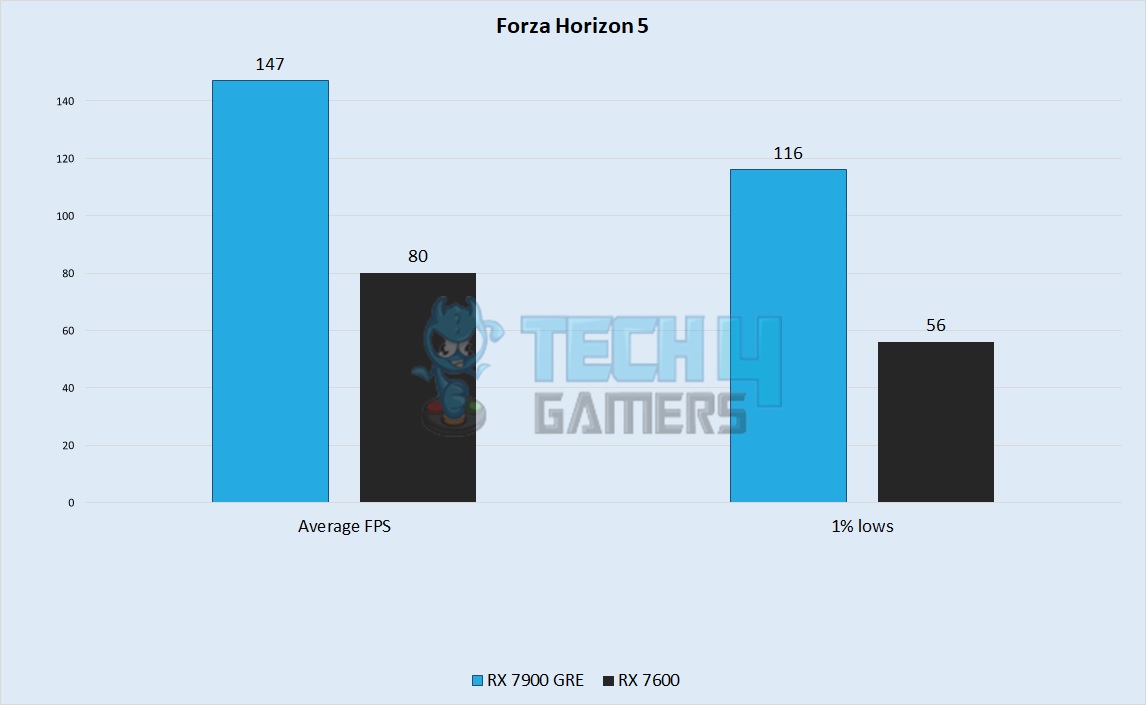
- Extreme quality at 1440p ran great on both cards, where the RX 7900 GRE averaged 147 FPS, whereas the 7600 came out with 80 FPS on average, resulting in a 59% gap.
- Lows were pretty playable on the 7600 at around 56 FPS in our testing, whereas the GRE smashed the competition with 1% lows of around 116 FPS.
Hogwarts Legacy
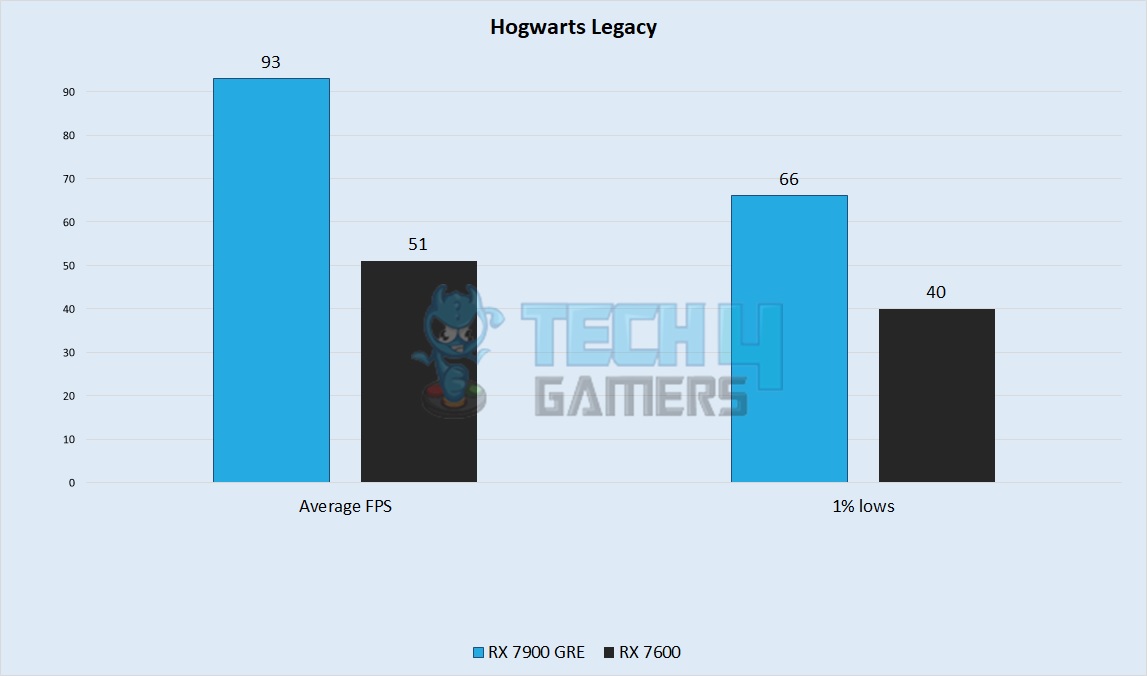
- This game also faired much better on both cards where the GRE got an average of 93 FPS, whereas the 7600 got a moderately playable 51 FPS average, showing a 58.3% difference.
- 1% lows brought down the framerate of the 7900 GRE to 66 FPS, whereas the 1% lows offered by 7600 were nudging 40 FPS.
Fortnite
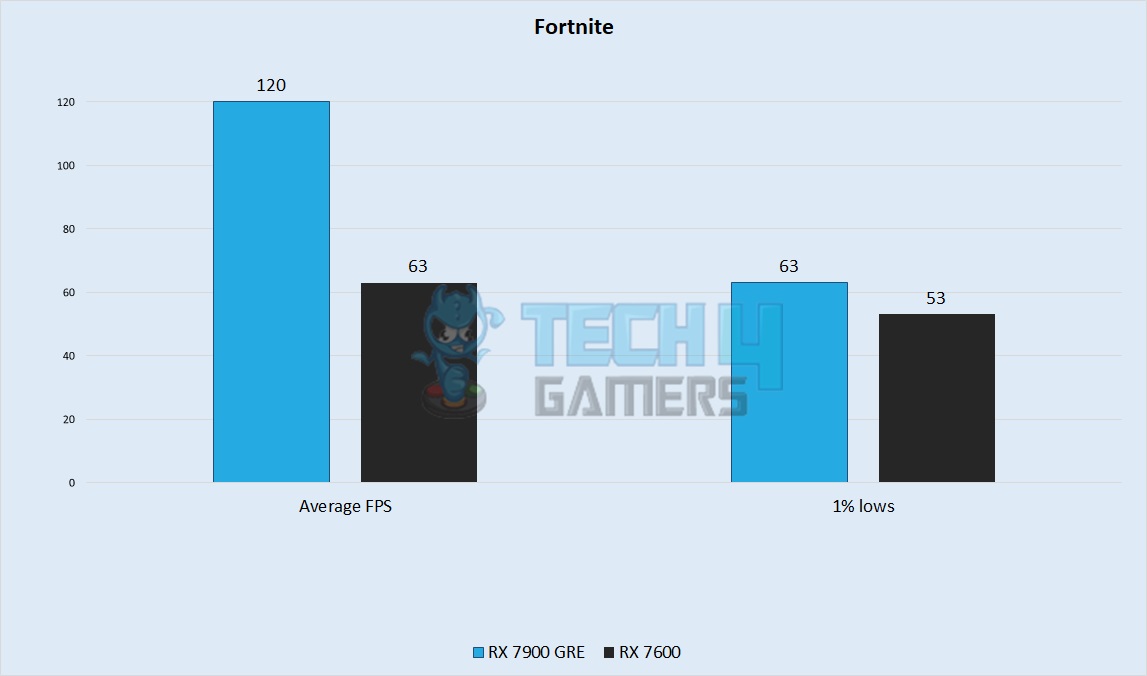
- Epic quality at 1440p on Fortnite gave the 7900 GRE an even performance of 120 FPS, whereas the 7600 showed an output of 63 FPS – making the GRE 62.2% faster here.
- Fortnite had its characteristics jitters at this resolution, bringing the lows of the RX 7600 to 53 FPS, whereas the GRE was not much ahead with 1% lows of 63 FPS.
A Plague Tale Requiem
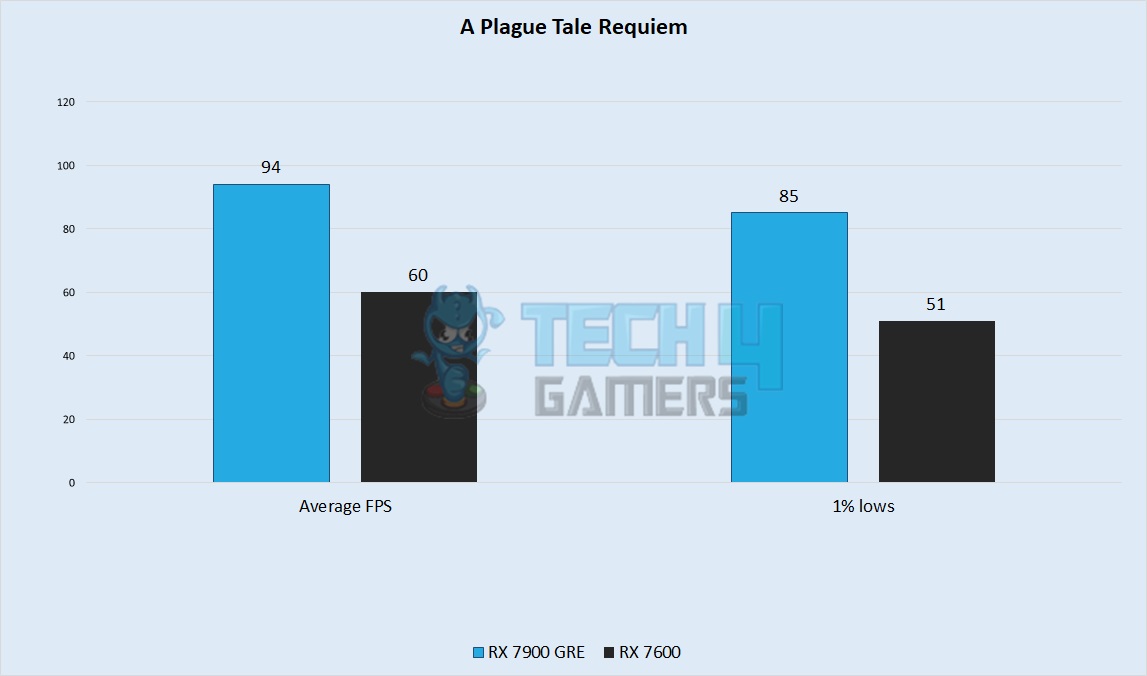
- Finally, in our last game, we saw the 7900 GRE getting 94 FPS on average, whereas the 7600 was touching 60 FPS – resulting in a 44.1% performance margin.
- 1% lows were also very stable in this game, with the RX 7600 going down to around 51 FPS, whereas the GRE got down to 85 FPS.
RX 7600 Vs RX 7900 GRE: Overall Gaming Performance
| Processor | Average FPS | 1% Lows |
|---|---|---|
| RX 7600 | 📈 60 | 📉 47 |
| RX 7900 GRE | 📈 107 | 📉 78 |
| Winner: RX 7900 GRE | ||
The card barely reached 60 FPS, with lows around 47 FPS. The RX 7900 GRE also performed much better on this resolution, averaging around 107 FPS, with lows around 78 FPS. In both resolutions, the RX 7900 GRE proved to be around twice as powerful as the 7600. This makes the RX 7900 GRE 56.2% better than the RX 7600 at 1440p.
Power Consumption
| Processor | RX 7600 | RX 7900 GRE |
|---|---|---|
| Average Power Consumption | 425 ⚡️ | 274 ⚡️ |
| Winner: RX 7900 GRE | ||
On average, we saw that the RX 7900 GRE consumed a total of 425 watts, whereas the RX 7600 testbench consumed only 274 watts. The graphics cards are the only differentiating factor between the two builds; the RX 7600 drew 151 watts less than the 7900 GRE, making it 43.2% more power-efficient.
Price And Availability
| GPU | MSRP | Current Price |
|---|---|---|
| RX 7900 GRE | 💲649 | 💲619 |
| RX 7600 | 💲269 | 💲279 |
| Price Difference | 82.7% | 75.7% |
The launch prices of both cards were miles apart, with an 82.7% difference. However, only the RX 7900 GRE saw a price reduction as of 2024 as its price has been reduced by 4.73% over time. On the other hand, the price of the RX 7600 has been slightly increased by 3.6%. Overall, the RX 7600 is 75.7% cheaper than the RX 7900 GRE.
Final Verdict – Which One Would We Recommend?
RX 7600: Despite the huge performance margin between the two cards where the RX 7900 GRE performed well at both resolutions, we have concluded that the RX 7600 is the better option to go for. Not only is the RX 7600 a performed budget option for 1080p gaming, but it is also available across the internet.
RX 7900 GRE: On the flip side, the RX 7900 GRE is not widely available across the world, let alone the internet, and is only limited to China and has recently started to arrive in Europe. If you can get your hands on the RX 7900 GRE and budget is no problem for you, then we recommend you get it as soon as you can.
This decision to choose either the RX 7900 GRE vs RX 7600 is ultimately based on your geographic location, budget, and current needs. If you are in China or Europe or have access to these markets, you must get the RX 7900 GRE but if you want a more affordable option, go for the RX 7600 with ease.
Frequently Asked Questions
The RX 6950 XT performs just as well, if not a bit better than the RX 7900 GRE, and it can be bought for a lower price tag than the newer card.
Any mid-range processor from AMD’s or Intel’s latest generation, like the i5 13500 or the Ryzen 5 7600X, would work great with the RX 7600.
Using a processor like the Ryzen 7 7800X or an i7 13700K would eliminate any worry of bottlenecking your RX 7900 GRE.
More From RX 7900 GRE
More From RX 7600
Thank you! Please share your positive feedback. 🔋
How could we improve this post? Please Help us. 😔
[Comparisons Expert]
Abdemanaf is a skilled creative writer who has been honing his craft since 2011. While initially working in different fields, he found a passion for technology and has been exploring the tech world since early 2015. Over the years, he has developed an in-depth knowledge of the latest tech trends and product offerings by various companies.
Abdemanaf’s writing reflects his analytical mindset and ability to think critically. He has a knack for breaking down complex technical information into easily digestible pieces, making his articles engaging and accessible to readers from all backgrounds. In February 2022, he joined Tech4Gamers as a blog and product comparison writer, where he has been able to hone his skills further.
As a writer, Abdemanaf is dedicated to staying up-to-date with the latest technological advancements and trends, enabling him to provide readers with the most relevant and accurate information. He is always eager to learn more and is constantly seeking new challenges to improve his skills.
Get In Touch: manaf@tech4gamers.com


