AMD Radeon RX 7900 GRE
Rated: 9.0/10
Nvidia GeForce RTX 4060 Ti 16GB
Rated: 8.8/10
Pros And Cons
| GPU | Pros | Cons |
|---|---|---|
| Radeon RX 7900 GRE | ✅ Better overall performance and value ✅ 64MB of L3 cache | ❌ Limited availability |
| GeForce RTX 4060 Ti 16GB | ✅ Low Price ✅ Low Power Consumption | ❌ Low performance for a 16GB GPU |
- Based on my results, the RX 7900 GRE performed 46.1% better in the 1440p games and 50.4% in 4K games than the RTX 4060 Ti 16GB.
- Regarding power consumption, the RTX 4060 Ti 16GB system consumed 33.2% less power during the Hitman 3 stress test.
- The RX 7900 GRE is priced at around $699 and has limited availability compared to the more common RTX 4060 Ti 16GB, which can be bought for only $429.
- I recommend the RTX 4060 16GB for its affordability and availability and the RX 7900 GRE for superior performance.
Comparison Table
| GPU Model | Radeon RX 7900 GRE | GeForce RTX 4060 Ti 16GB |
|---|---|---|
| GPU Chip | Navi 31 | GA106 |
| Architecture | RDNA 3 | Ada Lovelace |
| Shading Units | 5120 Stream Processors | 4352 Cuda Cores |
| RT Cores | 80 | 34 |
| Memory | 16GB GDDR6 | 16GB GDDR6 |
| Memory Bus Width | 256-bit | 128-bit |
| Memory Bandwidth | 576.0 GB/s | 288.0 GB/s |
| Best Variants | – | Best RTX 4060 Ti (8GB) cards |
Architectural Differences
- Process Node: The RTX 4060 Ti and the RX 7900 GRE are crafted using cutting-edge 5nm technology by TSMC, showcasing their advanced manufacturing capabilities.
- Clock Speed: The RTX 4060 Ti 16GB possesses base and boost frequencies of 2310MHz and 2535MHz, respectively. On the other hand, the RX 7900 GRE’s speeds are 1500MHz and 2245MHz, respectively.
- TDP: The RTX 4060 Ti 16GB has a fair TDP of 107 watts, while the RX 7900 GRE’s TDP is more than double, at 260 watts.
- Supported Technologies: The AMD Radeon RX 7900 GRE supports AMD FSR 3 and Anti-Lag and Boost technologies. In contrast, the RTX 4060 Ti 16GB supports DLSS 3 and these AMD technologies.
In today’s article, the spotlight is on the RX 7900 GRE vs RTX 4060 Ti 16GB, sparking debates on gaming performance and efficiency. We will find out if NVIDIA’s GPU with its increased VRAM capacity, performs better than AMD’s competitor or not.
Gaming Benchmarks
We’ll evaluate the capabilities of the RX 7900 GRE vs RTX 4060 Ti 16GB across five different titles, examining their performance at both 1440P and 4K resolutions. We played all the games at ultra or equivalent preset.
Test bench
- CPU: AMD Ryzen 7 7800X3D
- Motherboard: Gigabyte X670E Aorus Master
- RAM: XPG Lancer RGB 32GB 7200MHz DDR5 Ram
- SSD: XPG GAMMIX S70 BLADE 2TB NVMe SSD
- PSU: ENERMAX REVOLUTION D.F. X 1050W
- Cooler: Noctua NH-L9x65 chromax.black CPU Air Cooler
Hogwarts Legacy – 1440P
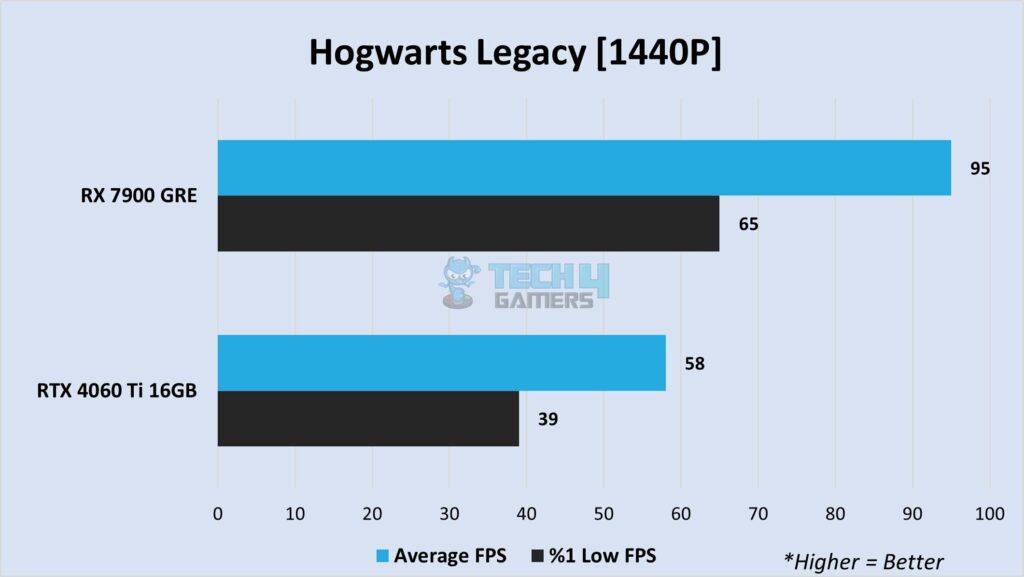
- Kicking off my benchmarks, I observed that the RX 7900 GRE scored an average of 95 FPS, while the RTX 4060 Ti 16GB managed 58 FPS.
- Regarding the %1 lows, the RX 7900 GRE achieved 65 FPS, while the RTX 4060 Ti 16GB recorded 39 FPS, indicating a performance difference.
Hogwarts Legacy – 4K

- Turning it up with 4K, I observed that the RX 7900 GRE fell to an average of 54 FPS, while the RTX 4060 Ti 16GB averaged 37 FPS.
- As for the %1 lows, the RX 7900 GRE achieved 46 FPS, which was 64.2% ahead of the Nvidia RTX 4060 Ti 16GB, highlighting a significant performance advantage.
A Plague Tale: Requiem – 1440P
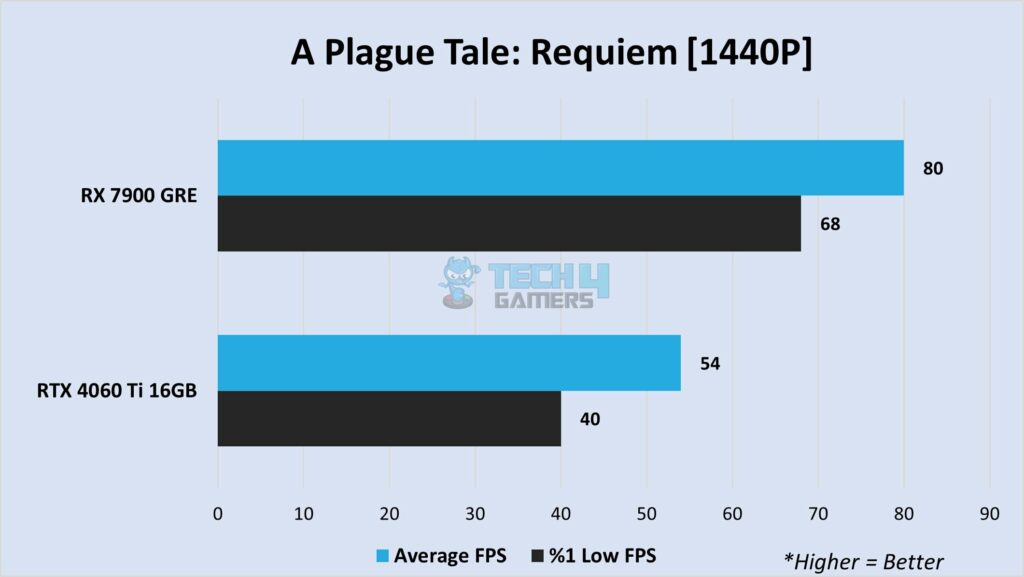
- In A Plague Tale: Requiem, I observed that the RX 7900 GRE accumulated 80 FPS on average, while the RTX 4060 Ti 16GB scored 54 FPS.
- Moving on to the %1 lows, the Radeon RX 7900 GRE achieved 68 FPS, whereas the RTX 4060 Ti 16GB scored 40 FPS, showcasing a significant performance gap.
A Plague Tale: Requiem – 4K
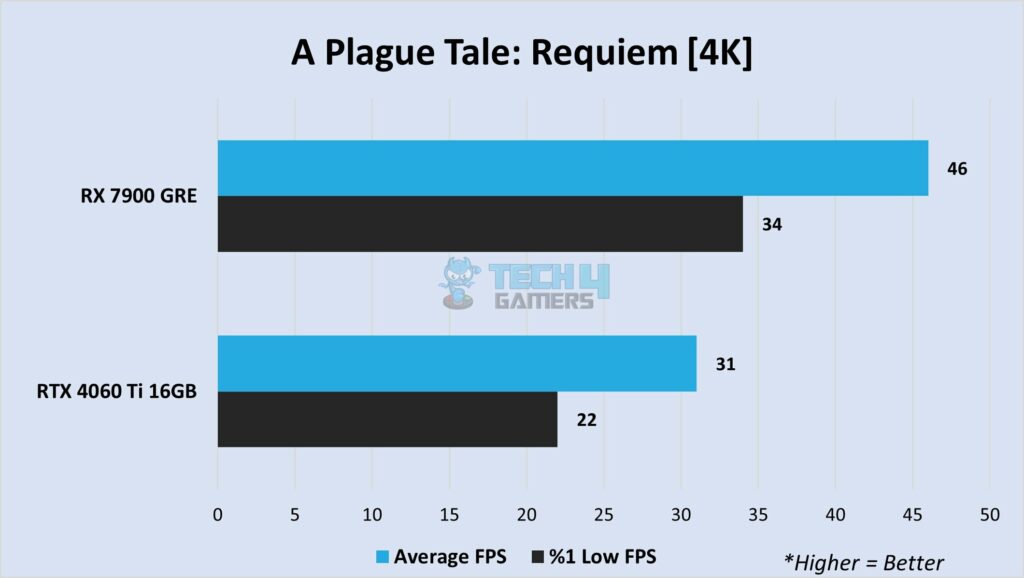
- Next, I compared the two cards at 4K resolution, during which the RX 7900 GRE managed 46 FPS, while the RTX 4060 Ti 16 GB managed 31 FPS on average.
- In terms of the %1 low FPS, the RX 7900 GRE scored 34 FPS, leading by 54.5% this time, indicating a substantial performance difference.
The Last Of Us Part 1 – 1440P
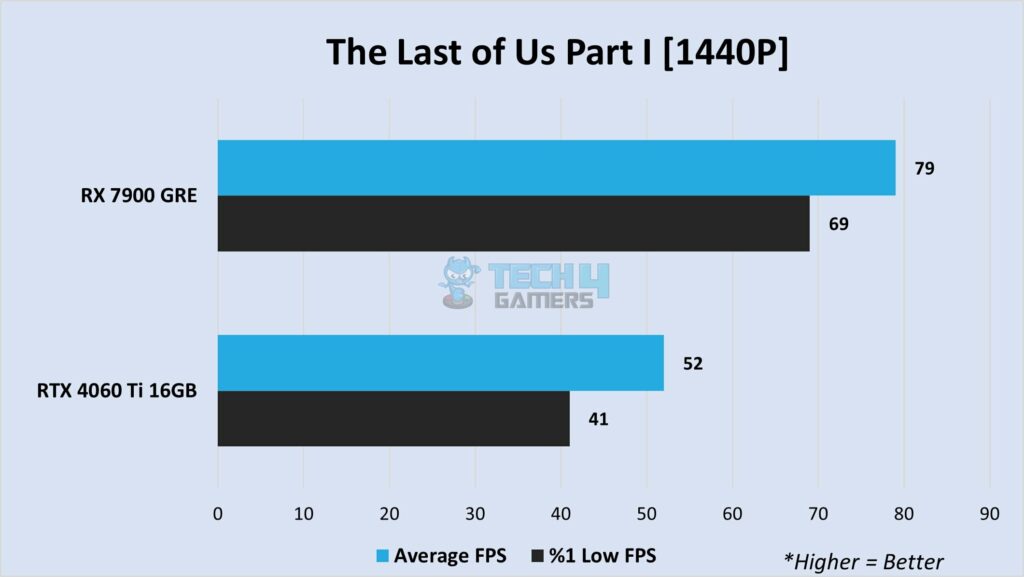
- For my next benchmark, I tested The Last of Us Part 1. In this test, I observed that the RX 7900 GRE averaged 79 FPS, while the RTX 4060 Ti 16GB averaged 52 FPS.
- Concerning the %1 lows, the AMD RX 7900 GRE achieved 69 FPS, while the RTX 4060 Ti 16GB scored 41 FPS, demonstrating a performance difference of 68.3% in favor of the RX 7900 GRE.
The Last Of Us Part 1 – 4K
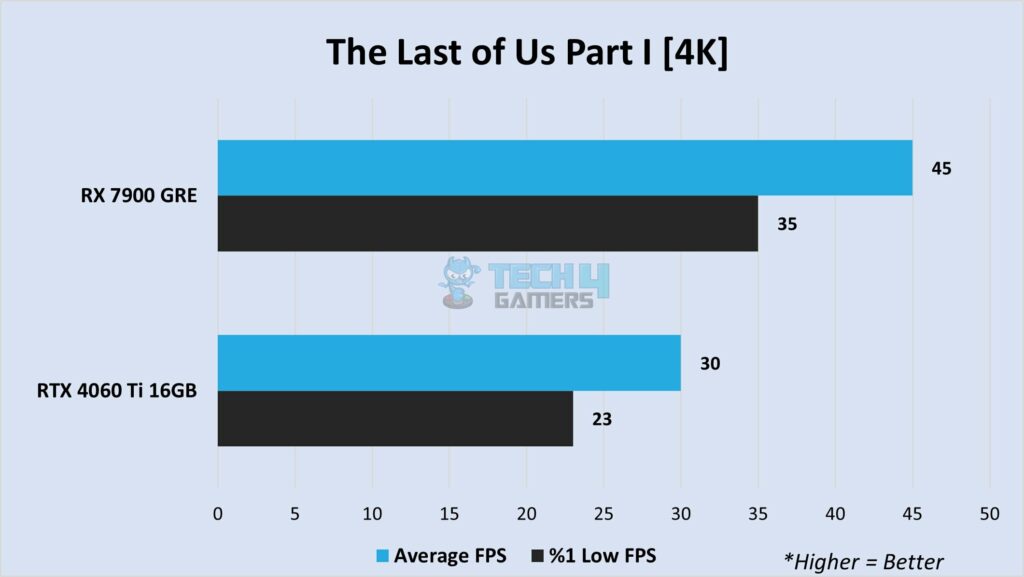
- With The Last of Us Part 1 cranked up to 4K, I found that the RX 7900 GRE scored 45 FPS, an impressive 50% higher than the RTX 4060 Ti 16GB.
- As for the %1 lows, the RTX 4060 Ti 16GB achieved a score of 23 FPS, while that of the RX 7900 GRE was 35 FPS, highlighting a performance difference of 52.2% in favor of the RX 7900 GRE.
Resident Evil 4 – 1440P
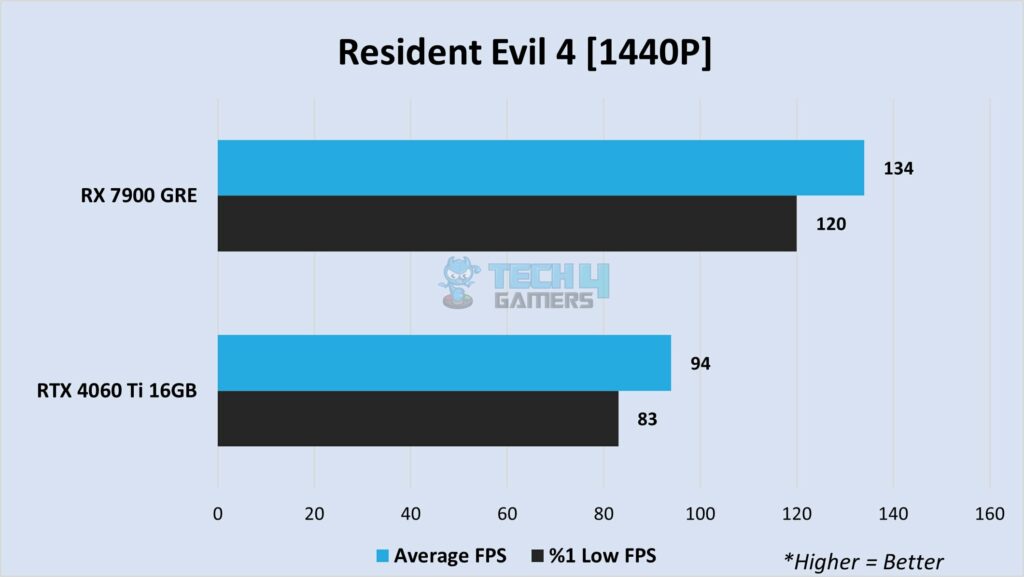
- With Resident Evil 4 running at 1440P, I observed that the RX 7900 GRE averaged 134 FPS, while the RTX 4060 Ti 16GB ran the game at 94 FPS on average.
- The %1 low FPS figures showed only marginal drops for both cards, at 120 FPS for the RX 7900 GRE and 83 FPS for the RTX 4060 Ti 16GB.
Resident Evil 4 – 4K

- Moving on to 4K, I found that the RX 7900 GRE racked up 81 FPS on average, while the RTX 4060 Ti 16GB fell well below the 60 FPS mark.
- Regarding the %1 lows, the RX 7900 GRE scored 69 FPS, while the RTX 4060 Ti 16GB scored 42 FPS.
Forza Horizon 5 – 1440P
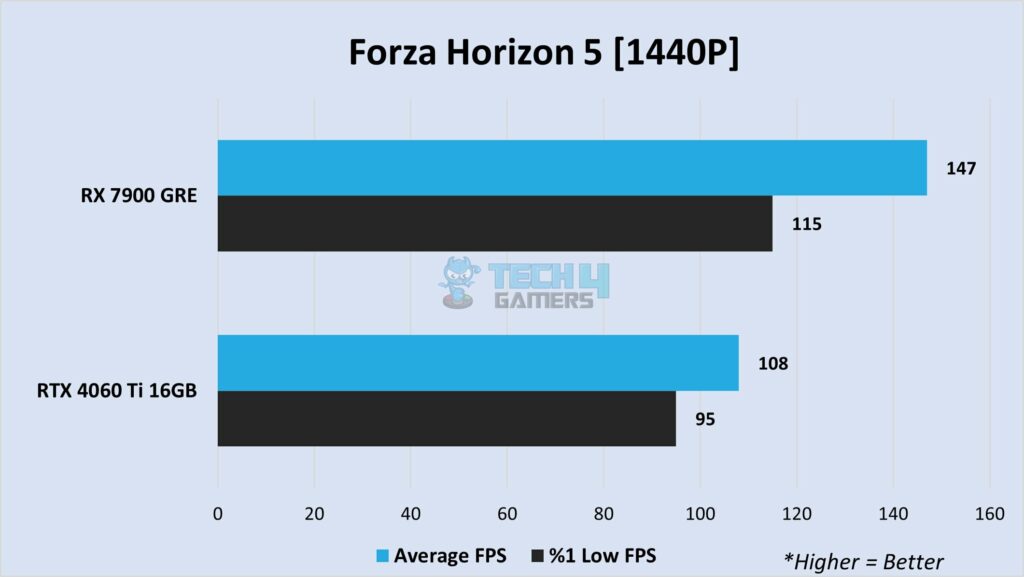
- Concluding my benchmarks with Forza Horizon 5, I found that the RX 7900 GRE averaged a solid 147 FPS at 1440P resolution in this game. In contrast, the RTX 4060 Ti 16GB averaged 108 FPS.
- Looking at the %1 lows, the RX 7900 GRE notched up 115 FPS, while the GeForce RTX 4060 Ti 16GB managed 95 FPS, showcasing a performance difference of 21.1% in favor of the RX 7900 GRE.
Forza Horizon 5 – 4K
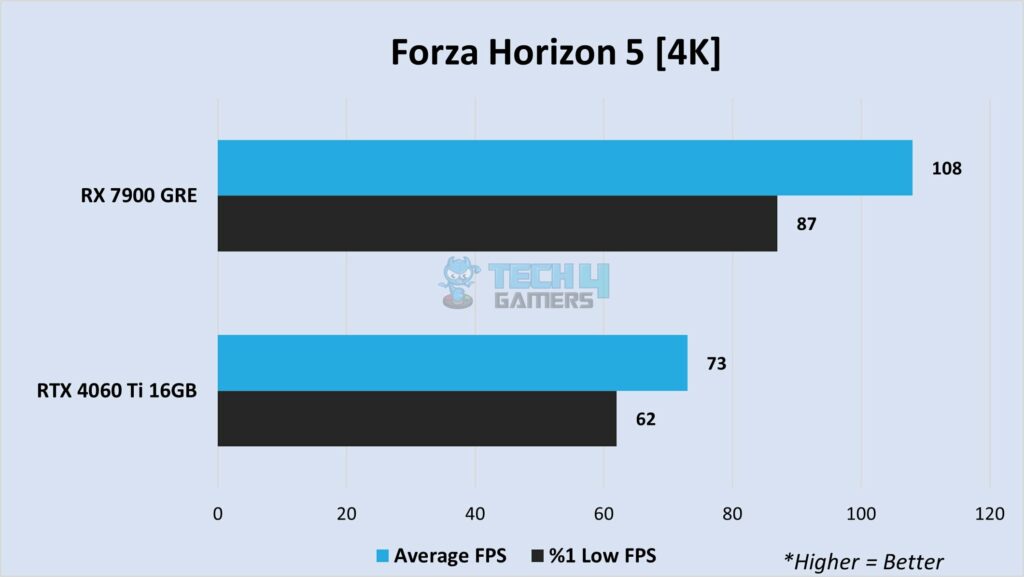
- Lastly, I increased the resolution to 4K, causing the RX 7900 GRE’s average to fall to 108 FPS. Still, it remained clear of the RTX 4060 Ti 16GB’s score of 73 FPS.
- As for the %1 lows, the RX 7900 GRE scored 87 FPS over 62 FPS of the RTX 4060 Ti 16GB, indicating a 40.3% performance difference.
Overall 1440P Gaming Performance
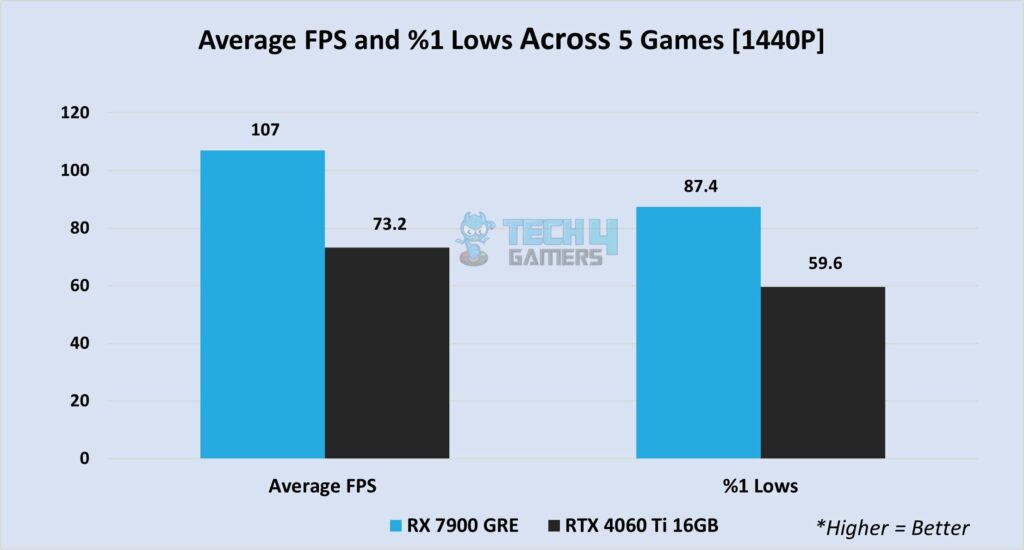
Across my five 1440P tests, the RX 7900 GRE averaged 107 FPS, while the RTX 4060 Ti 16GB averaged 73.2 FPS. Thus, the RX 7900 GRE is about 46.1% faster than the RTX 4060 Ti 16GB in 1440P gaming.
In terms of the low 1% performance, the RX 7900 GRE scored 87.4 FPS, whereas the RTX 4060 Ti 16GB managed 59.6 FPS.
Overall 4K Gaming Performance
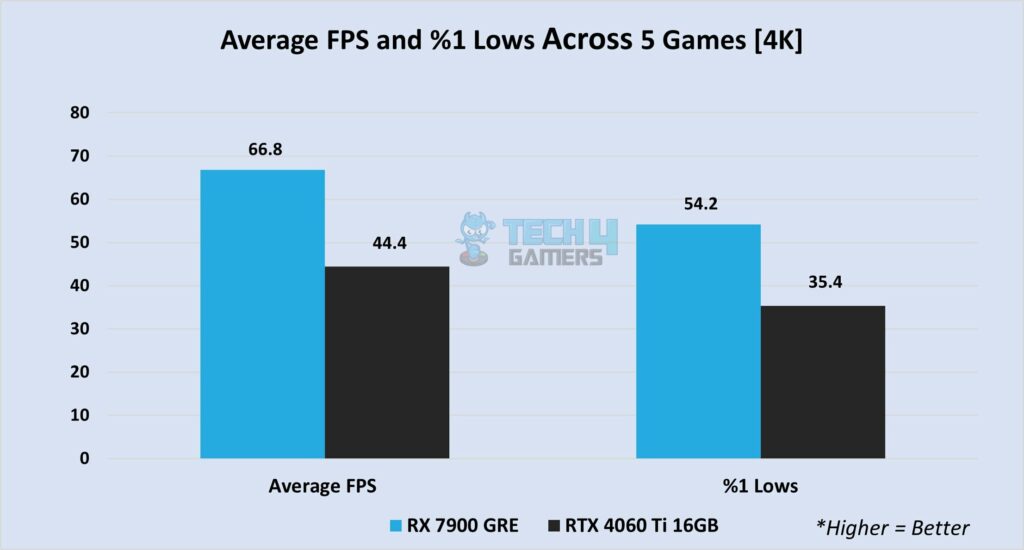
Across the five games that I tested, the RX 7900 GRE averaged 66.8 FPS, while the RTX 4060 Ti 16GB averaged 44.4 FPS. So, the RX 7900 GRE proves 50.4% better than the RTX 4060 Ti 16GB in 4K gaming.
Comparing the 1% low FPS scored by the RX 7900 GRE vs RTX 4060 Ti 16GB, the RX 7900 GRE averaged 54.2 FPS, while the RTX 4060 Ti 16GB averaged 35.4 FPS.
Winner: AMD Radeon RX 7900 GRE
Power Consumption
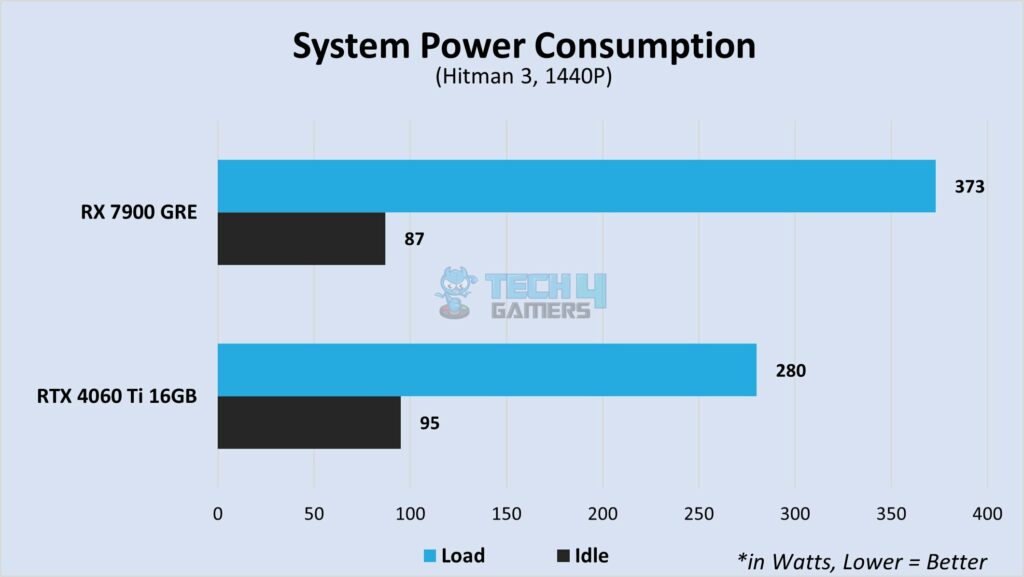
My RX 7900 GRE system averaged 373 watts under load, while the RTX 4060 Ti 16GB bench averaged 280 watts. Thus, the RTX 4060 Ti 16GB consumes about 33.2% less power than the RX 7900 GRE in this scenario. At idle, the RTX 4060 Ti 16GB system averaged just 95 watts, which is 8 watts higher than my RX 7900 GRE PC.
Winner: GeForce RTX 4060 Ti 16GB
Prices And Availability
| GPU | Launch MSRP | Current Price |
|---|---|---|
| Radeon RX 7900 GRE | 💲649 | 💲749 |
| GeForce RTX 4060 Ti 16GB | 💲499 | 💲429 |
| Difference | 30.0% | 74.6% |
Considering the launch MSRPs, the RX 7900 GRE was about 30% more expensive, while in terms of current prices, it is about 74.6% more expensive than the RTX 4060 Ti 16GB. Additionally, it’s worth noting that the RX 7900 GRE is exclusively accessible within China, further limiting its availability elsewhere.
Final Verdict What Do We Recommend?
Radeon RX 7900 GRE: The RX 7900 GRE stands out for its impressive performance, especially compared to the RTX 4060 Ti. Its capability to handle 4K gaming seamlessly presents a compelling option. Nevertheless, it does exhibit higher power consumption, and its availability in markets is somewhat limited.
GeForce RTX 4060 Ti 16GB: The RTX 4060 Ti 16GB stands out as a remarkably energy-efficient that ultimately lowers running expenses. This GPU is good for gaming at 1080p and 1440p games. Its ray tracing and upscaling capabilities are also good.
When it’s time to pick your GPU, the decision ultimately rests in your hands. If the RX 7900 GRE fits your needs and budget, it’s a solid choice if available. However, if you’re looking for a more economical option, the RTX 4060 Ti 16GB provides good performance at a budget-friendly price point and is readily accessible.
Frequently Asked Questions
Although both GPUs use the 5nm process from TSMC, the RTX 4060 Ti 16GB has a higher transistor density (121.8M/mm²) over the RX 7900 GRE (109.1.mm²).
Yes. The RTX 4060 Ti 16GB launched at $499, while the RX 7900 GRE was released with a price tag of $649 in the US.
The RX 7900 GRE provides better performance AND value when it comes to 4K gaming.
More From RX 7900 GRE:
More From RTX 4060 Ti:
Thank you! Please share your positive feedback. 🔋
How could we improve this post? Please Help us. 😔
[Comparisons Specialist]
I’m a passionate computer hardware expert specializing in CPUs and GPUs. With a lifelong curiosity for hardware and extensive hands-on experience, I provide valuable insights, practical advice, and in-depth analysis on these components. Engaging with the hardware community, I exchange knowledge and stay at the forefront of technological advancements.
Get In Touch: uzair@tech4gamers.com