AMD Radeon RX 7900 GRE
Rated: 8/10
Nvidia GeForce RTX 4070
Rated: 7.7/10
Pros & Cons
| GPU | Pros | Cons |
|---|---|---|
| RX 7900 GRE | ✅ Exceptional performance at 1440p. ✅ Excellent value. | ❌ Higher power draw. ❌ Availability limited to China & Europe. |
| RTX 4070 | ✅ Higher clock frequency. ✅ Better thermal & power efficiency. | ❌ Relatively lower performance. |
- We notice that the RX 7900 outlined the RTX 4070 with a remarkable 9.9% boost in FPS across games at 1440p.
- The RTX 4070 commands attention by consuming notably less power than the RX 7900 GRE, securing an impressive 27.5% advantage in energy conservation.
- In the realm of thermal performance, the RTX 4070 emerges as the frontrunner, boasting an 8.2% edge in maintaining lower average temperatures when compared to the RX 7900 GRE.
- We recommend the RX 7900 GRE for its higher performance and if you can source it via China or Europe. We recommend the RTX 4070 for its reasonable price point.
Comparison Table
| Specifications | Radeon RX 7900 GRE | GeForce RTX 4070 |
|---|---|---|
| Shading Units | 5120 | 5888 |
| RT Cores | 80 | 46 |
| TMUs | 320 | 184 |
| ROPs | 192 | 64 |
| L1 Cache | 256 KB per Array | 128 KB (per SM) |
| L2 Cache | 6 MB | 36 MB |
| Bus Width | 256 bit | 192 bit |
| Memory Bandwidth | 576.0 GB/s | 504.2 GB/s |
| Suggested PSU | 600W | 550W |
| Release Date | Jul 27th, 2023 | Apr 12th, 2023 |
| Best Variants | - | Best RTX 4070 Cards |
Architectural Differences
- Process Node: Both contenders, the RX 7900 GRE vs RTX 4070, harness the prowess of a 5nm process node.
- Clock Speed: The RTX 4070 flexes a base clock of 1920 MHz and Boost Clock of 2475 MHz, rivaled by the RX 7900 GRE’s base clock of 1500 MHz and Boost Clock of 2245 MHz.
- VRAM: The RX 7900 GRE wields a staggering 16GB GDDR6 VRAM while the RTX 4070 boasts a compelling 12GB GDDR6X VRAM.
- TDP: In the tug of war for power efficiency, the RX 7900 GRE keeps its cool with a 260W TDP, while the RTX 4070 shoulders a slightly lower 200W TDP.
- Supported Technologies: Finally, when it comes to image enhancements, the RTX 4070 boasts NVIDIA’s DLSS technology, while the RX 7900 GRE brings AMD’s FidelityFX Super Resolution (FSR) to the table.
In the ever-evolving realm of graphics cards, two giants have emerged to captivate the gaming community’s attention: the RX 7900 GRE vs RTX 4070. These powerhouses from rivaling tech titans promise to redefine the gaming experience, but which one truly reigns supreme? We’ll find out in this comparison!
RX 7900 GRE Vs RTX 4070: Gaming Benchmarks
As the battle intensifies, we turn our attention to the gaming arena, where real-world performance truly matters. Therefore, we present to you the performance difference of both of these cards in games played at 1440p.
Testing Rig
- CPU: Intel Core i9-13900K
- Motherboard: ASUS TUF Gaming Z790-Plus D4
- Power Supply: be quiet! Dark Power Pro 13 1300W
- Memory: Corsair Vengeance RGB Pro (2x16GB) – 3200MHz
- CPU Cooler: Arctic Liquid Freezer II
- OS: Windows 11
Resident Evil 4
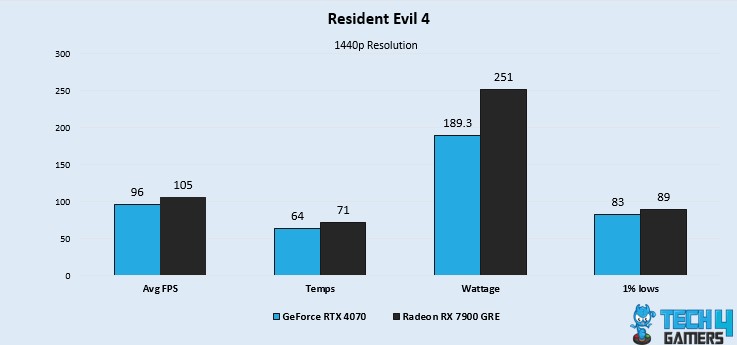
- Notably, the RX 7900 GRE holds a performance advantage over the RTX 4070, achieving an average of 105 FPS compared to the RTX 4070’s 96 FPS, reflecting a difference of 8.9%.
- Delving into the realm of 1% low performance, the RX 7900 GRE achieves exceptional results with a 1% low of 89 FPS, outshining the RTX 4070’s performance of 83 FPS by 6.9%.
Cyberpunk 2077

- We see a substantial gap emerge in favor of the RX 7900 GRE as it achieves an impressive average of 69 FPS, outshining the RTX 4070 by 17.3% with its 58 FPS performance.
- Unveiling the depth of 1% low performance, the RX 7900 GRE demonstrates its prowess with a remarkable 16.8% lead, achieving 58 FPS compared to the RTX 4070’s 49 FPS.
Red Dead Redemption 2
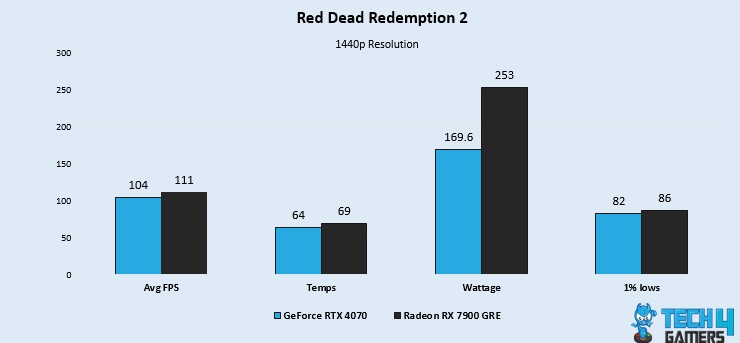
- We observed that the RX 7900 GRE takes the lead in the average FPS performance, reaching 111 FPS against the RTX 4070’s 104 FPS, showcasing a difference of 6.5%.
- The RX 7900 GRE sets a high bar in 1% low performance, securing an impressive 86 FPS, showcasing a 4.7% advantage over the RTX 4070’s performance of 82 FPS.
Remnant 2
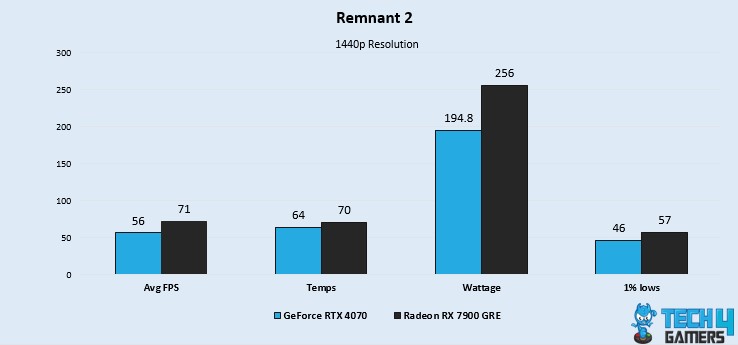
- In a remarkable display of prowess, we notice the RX 7900 GRE commands a substantial 23.6% lead, averaging 71 FPS, while the RTX 4070 trails with 56 FPS.
- In a striking performance leap, the RX 7900 GRE excels in 1% low performance with a remarkable 21.3% lead, reaching 57 FPS, while the RTX 4070 trails at 46 FPS.
Microsoft Flight Simulator
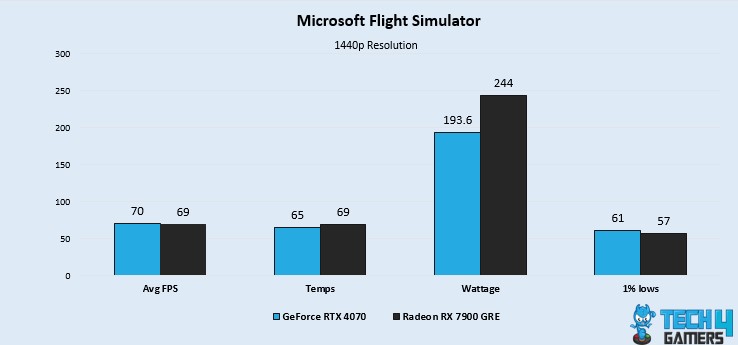
- In a neck-and-neck competition, the RX 7900 GRE maintains a slim 1.4% lead with an average FPS of 69, while the RTX 4070 lags slightly at 70 FPS.
- Powering ahead in 1% low performance, the RX 7900 GRE demonstrates its finesse with a 6.7% lead, maintaining 57 FPS compared to the RTX 4070’s 61 FPS.
Forza Horizon 5
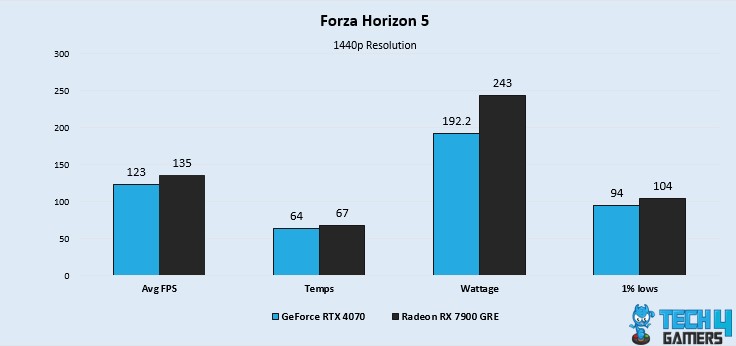
- We observe that the RX 7900 GRE outpaces the RTX 4070 by 9.3%, achieving an average FPS of 135 compared to the latter’s 123 FPS.
- The RX 7900 GRE commands the lead with an exceptional 10.1% advantage, achieving a 1% low of 104 FPS, while the RTX 4070 trails at 94 FPS.
God Of War
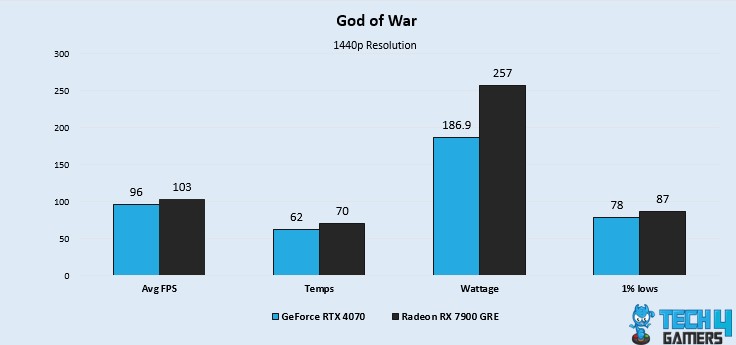
- The RX 7900 GRE secures a lead of 7% with an average FPS of 103, while the RTX 4070 achieves 96 FPS, showcasing a notable performance difference.
- In the realm of 1% low performance, the RX 7900 GRE stands strong with an 87 FPS performance, showcasing a notable 10.9% advantage over the RTX 4070’s 78 FPS.
Hogwarts Legacy
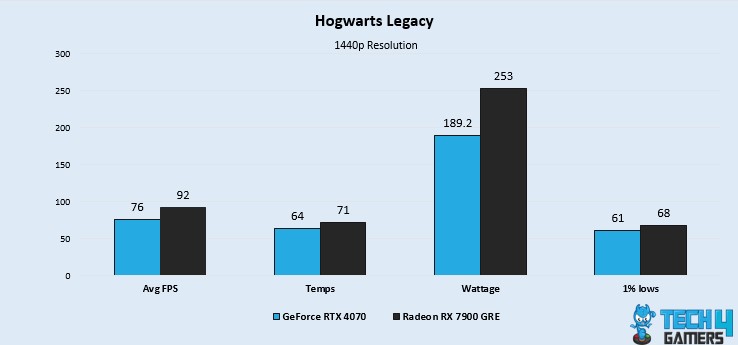
- Here, we see a significant performance margin as the RX 7900 GRE emerges triumphant with a substantial 19% lead, achieving an average FPS of 92 compared to the RTX 4070’s 76 FPS.
- Showcasing its prowess, the RX 7900 GRE maintains a solid lead of 10.8% with a 1% low performance of 68 FPS, outshining the RTX 4070’s 61 FPS.
Hitman III
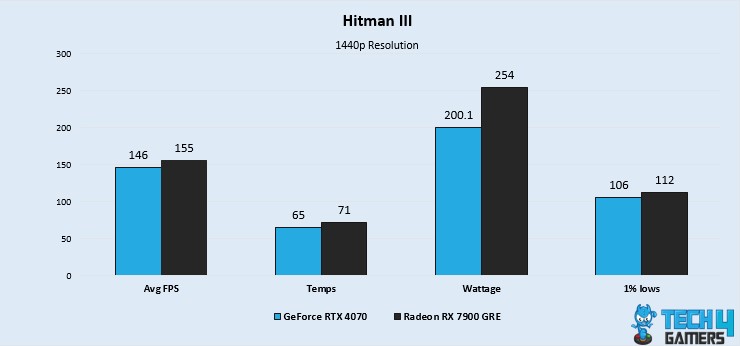
- With a 5.9% advantage, the RX 7900 GRE demonstrates its prowess with an average FPS of 155, outshining the RTX 4070’s 146 FPS.
- The RX 7900 GRE leads the charge with a 1% low performance of 112 FPS, boasting a 5.5% advantage over the RTX 4070’s performance of 106 FPS.
The Last Of Us Part I

- Commanding the lead, we notice the RX 7900 GRE showcases its superiority with an 11.3% difference, achieving an average FPS of 102, while the RTX 4070 trails at 91 FPS.
- In the realm of 1% low performance, the RX 7900 GRE showcases its capability with a 9.2% lead, maintaining performance of 79 FPS compared to the RTX 4070’s 72 FPS.
RTX 4070 Vs RX 7900 GRE: Overall Gaming Performance
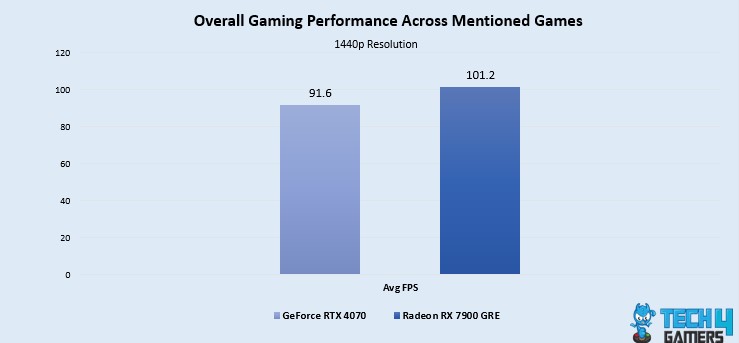
In the ten tested games, we noticed that the RX 7900 GRE leads the pack with an impressive average FPS of 101.2, surging ahead of the RTX 4070’s 91.6. Standing tall in direct comparison, the RX 7900 GRE secures victory, showcasing an impressive 9.9% lead in FPS over the RTX 4070.
Power Consumption
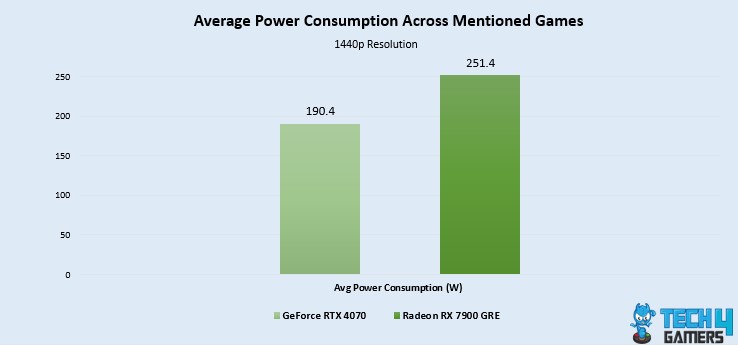
Our investigation unveils that the RX 7900 GRE exhibits higher power consumption, averaging 251.4W, while the RTX 4070 impressively maintains a lower power draw of 190.4W, leading with a significant 27.5% advantage over the RX 7900 GRE in terms of power efficiency.
Thermal Statistics
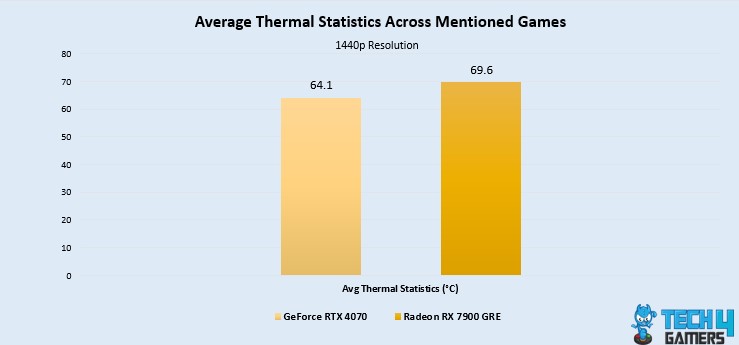
We also observed that the RTX 4070 takes the spotlight with cooler average temperatures at 64.1°C, notably lower than the RX 7900 GRE’s average of 69.6°C. In a nutshell, the RTX 4070 excels in thermal efficiency, holding a significant 8.2% advantage in average temperature over the RX 7900 GRE.
Pricing And Value
| GPU | MSRP | Current Price |
|---|---|---|
| RX 7900 GRE | 💲649 | 💲619 |
| RTX 4070 | 💲599 | 💲581 |
| Price Difference | 8% | 6.3% |
We’ll start with the RX 7900 GRE which has seen a 4.7% price drop since its release. In contrast, the RTX 4070’s price has been decreased by 8.7% for a few base variants but on average its price has been reduced by 3%. This makes the RTX 4070 6.3% cheaper than the RX 7900 GRE.
Final Thoughts – Which One Would We Recommend?
RX 7900 GRE: We recommend you get the RX 7900 GRE because of a 9.9% boost in performance. The only downside is its limited availability. As of now, the RX 7900 GRE is only available in China and has recently started to make its way into Europe. Soon, it will be available in more places but till then it’s harder to obtain.
RTX 4070: The RTX 4070 is a perfect affordable GPU that consists of a little bit of everything: it has decent performance with minimal difference in framerates, lower power consumption, and better thermal efficiency – all within a reasonable price tag. Additionally, it is widely available across the internet.
The GPU you choose depends on your geographical location, budget, and preference. If you’re in China or Europe or could source the RX 7900 GRE, you’re in luck because it is a viable thing to do. If you’re on a budget or cannot acquire the GRE, you should go with the RTX 4070.
More From RX 7900 GRE
More From RTX 4070
Thank you! Please share your positive feedback. 🔋
How could we improve this post? Please Help us. 😔
[Comparisons Specialist]
I’m a passionate computer hardware expert specializing in CPUs and GPUs. With a lifelong curiosity for hardware and extensive hands-on experience, I provide valuable insights, practical advice, and in-depth analysis on these components. Engaging with the hardware community, I exchange knowledge and stay at the forefront of technological advancements.
Get In Touch: uzair@tech4gamers.com