


Intel ARC A770
Rated: 8/10
AMD RX 6600 XT
Rated: 9/10
Pros And Cons
| GPU | Pros | Cons |
|---|---|---|
| Intel Arc A770 | ✅ Ample 16GB GDDR6 VRAM ✅ XeSS Technology Enhanced performance | ❌ XeSS compatible with few games only |
| AMD RX 6600 XT | ✅ Low Power Wattage ✅ Great 1080p Experience | ❌ Lags behind RTX 3060 Ti |
- In our benchmarks, the RX 6600 XT holds a slight edge over the ARC A770, delivering a 3.4% higher overall gaming FPS performance.
- The RX 6600 XT proves more efficient than the ARC A770, consuming 33.4% less power and a 16.9% advantage in thermal efficiency.
- The current prices of the ARC A770 and the RX 6600 XT hold a gap of 30%, with the RX 6600XT coming out as the more economical out of the two cards.
- We would recommend the RX 6600XT as the card delivered an exceptional performance in our benchmarks while being well under budget.
Comparison Table
| Technical Specs | Intel Arc A770 | AMD RX 6600 XT |
|---|---|---|
| GPU Name | DG2-512 | Navi 23 |
| Architecture | Generation 12.7 | RDNA 2.0 |
| Transistors | 21,700 million | 11,060 million |
| TMUs | 160 | 128 |
| ROPs | 128 | 64 |
| Suggested PSU | 600 W | 450W |
| Release Date | Oct 12th, 2022 | Jul 30th, 2021 |
| MSRP | 329 USD | 450 USD |
Architectural Difference
- Process Node: Firstly, the RX 6600 XT and Arc A770 exhibit contrasting process sizes, with the former utilizing 6nm and the latter using 7nm technology.
- Clock Speed: Moreover, Arc A770 has a Base Clock of 2100 MHz and a Boost Clock of 2400 MHz. In contrast, the RX 6600 XT has a Base Clock of 1968 MHz, expandable to a boost clock of 2589 MHz.
- VRAM: Furthermore, the RX 6600 XT features 8GB of GDDR6 VRAM, while the Arc A770 boasts a higher capacity of 16GB of GDDR6 VRAM.
- TDP: Additionally, the RX 6600 XT has a lower TDP of 160W compared to the Arc A770’s slightly higher TDP of 225W.
- Supported Technologies: Lastly, to enhance graphics performance, the Arc A770 leverages XeSS technology, while the RX 6600 XT utilizes FSR technology.
As we shift gears from our previous comparison between the RTX 2070 vs RTX 2070 SUPER, we now embark on a new matchup that brings Intel and NVIDIA into the spotlight. Directing our attention toward the ARC A770 vs RX 6600 XT, we meticulously assess their different performance.
RX 6600 XT Vs Arc A770 – Gaming Benchmarks
Now, we will mention the various games we used as potential benchmarks to evaluate the performance of our subject GPUs in real-time stressed environments.
Testing Rig
- CPU: Intel Core i9-13900K
- Motherboard: MSI MPG Z790 Carbon WiFi II
- Memory: Corsair Vengeance DDR-5 32GB RAM 5600Mhz (2X 16GB) – CL36
- CPU Cooler: be quiet! Dark Rock Pro 4
- Power Supply: be quiet! Dark Power Pro 13 1300W
- Storage Drive: XPG GAMMIX S70 BLADE 2TB NVMe
- Operating System: Windows 10 Pro
A Plague Tale: Requiem
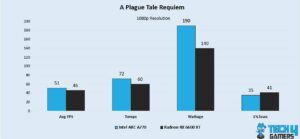
- Starting, the RX 6600 XT falls slightly behind the Arc A770, achieving an average FPS of 46 compared to the Arc A770’s 51 FPS, with a difference of 10.3%.
- Notably, the RX 6600 XT impresses with superior 1% low performance, achieving a remarkable 41 FPS, outperforming the Arc A770’s 35 FPS by 10.5%.
Forza Horizon 5 – Ray Tracing
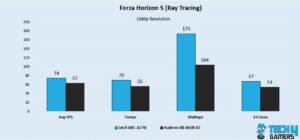
- Surprisingly, the RX 6600 XT lags behind the Arc A770, delivering an average FPS of 63 compared to the Arc A770’s 74 FPS, resulting in a significant difference of 16%.
- In addition, the Arc A770 showcases better 1% low performance at 67 FPS, while the RX 6600 XT lags at 54 FPS, resulting in a significant difference of 21.4%.
Cyberpunk 2077
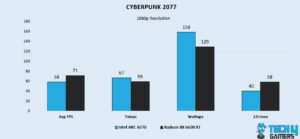
- Impressively, the RX 6600 XT exhibits remarkable performance, achieving an average FPS of 71, surpassing the Arc A770’s 58 FPS, resulting in a significant difference of 20.1%.
- Furthermore, the Arc A770 exhibits a 1% low performance of 40 FPS, outshining the RX 6600 XT’s 58 FPS, showcasing a remarkable difference of 36.7%.
Cyberpunk 2077 – Ray Tracing
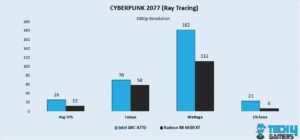
- Starting off, the RX 6600 XT falls short with an average FPS of 12, while the Arc A770 takes the lead with 26 FPS, showcasing a significant difference of 73.6%.
- In addition, the Arc A770 impresses with a 1% low performance of 23 FPS, leaving the RX 6600 XT far behind at 6 FPS, resulting in a staggering difference of 117.2%.
Halo Infinite
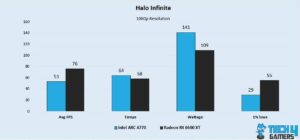
- The RX Arc A770 provided an average FPS of 53, while the RX 6600 XT delivered an impressive 76 FPS, with a difference of 35.6%.
- In addition, the Arc A770 demonstrates a 1% low performance of 29 FPS, surpassing the RX 6600 XT’s 55 FPS, showcasing a significant difference of 61.9%.
Spider-Man: Miles Morales – Ray Tracing
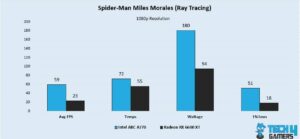
- To begin with, the RX 6600 XT falls behind with an average FPS of 23, whereas the Arc A770 shines with 59 FPS, exhibiting a remarkable difference of 87.8%.
- Furthermore, the Arc A770 exhibits a higher 1% low performance at 51 FPS, while the RX 6600 XT falls behind at 18 FPS, resulting in an astonishing difference of 95.6%.
F1 22
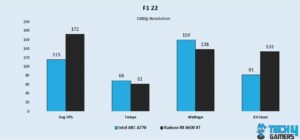
- Starting, the RX 6600 XT trails behind the Arc A770, delivering an average FPS of 172 compared to the Arc A770’s exceptional 115 FPS, showcasing a noticeable difference of 39.7%.
- In addition, the RX 6600 XT impresses with a 1% low performance of 133 FPS, while the Arc A770 lags at 81 FPS, resulting in a substantial difference of 48.5%.
F1 22 – Ray Tracing
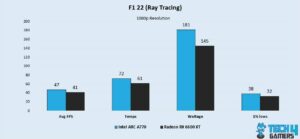
- Notably, the RX 6600 XT falls slightly behind the Arc A770, achieving an average FPS of 41 compared to the Arc A770’s 47 FPS, with a difference of 13.6%.
- In addition, the Arc A770 showcases better 1% low performance at 38 FPS, while the RX 6600 XT achieves 32 FPS, resulting in a notable difference of 17.1%.
RX 6600 XT Vs Arc A770 – Overall Gaming Performance
| Processor | Average FPS | 1% Lows |
|---|---|---|
| Intel ARC A770 | 📈 65.5 | 📉 68.4 |
| AMD RX 6600 XT | 📈 67.8 | 📉 71.9 |
| Winner: AMD RX 6600 XT | ||
The results of our benchmarks displayed the dominance of the Radeon RX 6600XT over the Intel ARC A770 as the former secured 3.4% more average gaming framerate than the latter. The same was the case for 1% low framerates where the RX 6600XT ld by 3.5 FPS on average.
Average Power Consumption
| Games | Intel ARC A770 (W) | AMD RX 6600 XT (W) |
|---|---|---|
| Average Power Consumption | 173⚡️ | 123.7⚡️ |
| Winner: AMD RX 6600 XT | ||
Our benchmark testing showed that the RX 6600 XT stands out for its notable power efficiency, consuming an average of 33.4% less power than the ARC A770. This brings out the RX 6600 XT in the front as an economical and power-efficient GPU.
Average Thermal Statistics
| Games | Intel ARC A770 (°C) | AMD RX 6600 XT (°C) |
|---|---|---|
| Average Thermal Capacity | 70🌡️ | 58🌡️ |
| Winner: AMD RX 6600 XT | ||
In our benchmarks, it is evident that the RX 6600 XT excels in thermal efficiency, outperforming the Arc A770. The RX 6600 XT outperforms the Arc A770 in terms of thermal efficiency with an advantage of 16.9%, making it more effective for maintaining lower temperatures during tasks.
Pricing And Availability
| GPU | MSRP | Current Price |
|---|---|---|
| Intel ARC A770 | 💲329 | 💲379 |
| AMD RX 6600 XT | 💲450 | 💲290 |
| Price Difference | 36.77% | 23.4% |
The ARC A770 is priced at around 23.4% more than the AMD RX 6600 XT. This difference is colossal considering that the users can get better performance, thermals, and power consumption in 23% less amount. This ultimately puts the AMD 6600XT in the front for budget gamers.
Conclusion – Which One We Recommend?
AMD RX 6600XT: With a notable price difference of 23.4% and a modest 3.4% increase in average FPS performance, the RX 6600 XT is an appealing choice over the Arc A770, providing both cost savings and improved gaming capabilities.
Intel ARC A770: conversely, the ARC A770 may not be the best choice considering the higher thermals, power ratings, and a higher price tag just to get lower performance than the RX 6600XT. These reasons fail to get our recommendation for the Intel ARC A770.
Ultimately, we would recommend the RX 6600 XT as it outperforms the Arc A770 across the board, surpassing it in FPS performance, power consumption, and thermal efficiency.
More From Intel ARC A770:
More From AMD RX 6600 XT:
Thank you! Please share your positive feedback. 🔋
How could we improve this post? Please Help us. 😔
[Comparisons Expert]
Abdemanaf is a skilled creative writer who has been honing his craft since 2011. While initially working in different fields, he found a passion for technology and has been exploring the tech world since early 2015. Over the years, he has developed an in-depth knowledge of the latest tech trends and product offerings by various companies.
Abdemanaf’s writing reflects his analytical mindset and ability to think critically. He has a knack for breaking down complex technical information into easily digestible pieces, making his articles engaging and accessible to readers from all backgrounds. In February 2022, he joined Tech4Gamers as a blog and product comparison writer, where he has been able to hone his skills further.
As a writer, Abdemanaf is dedicated to staying up-to-date with the latest technological advancements and trends, enabling him to provide readers with the most relevant and accurate information. He is always eager to learn more and is constantly seeking new challenges to improve his skills.
Get In Touch: manaf@tech4gamers.com


