


Intel ARC A770
Rated: 8.5/10
GeForce RTX 3060 Ti
Rated: 8.3/10
Pros And Cons
| GPU | Pro | Cons |
|---|---|---|
| Intel Arc A770 | ✅ Great 16GB GDDR6 memory ✅ Hardware AI cores | ❌ Low thermal efficiency ❌ Drivers remain finicky at times |
| GeForce RTX 3060 Ti | ✅ Compelling ray tracing performance ✅ Runs cool | ❌ Only 8 GB memory ❌ Overclocking more complicated |
- In our gaming tests, the RTX 3060 Ti holds a significant advantage over the Arc A770, showcasing an average FPS production that is 14.9% higher.
- According to our tests, the RTX 3060 Ti consumes 3.5% more power than the Arc A770 but also boasts a 12.1% thermal efficiency advantage over it.
- As of February 2024, the Arc A770 costs around $289, while a refurbished RTX 3060 also costs the same.
- I recommend the RTX 3060 Ti for its better performance and the Arc A770 for its 16GB VRAM, which is useful for memory-intensive tasks.
Comparison Table
| Technical Specs | Intel Arc A770 | GeForce RTX 3060 Ti |
|---|---|---|
| Shading Units | 4096 | 4864 |
| Tensor Cores | 512 | 192 |
| Ray Tracing Cores | 32 | 48 |
| Base Clock | 2100 MHz | 1410 MHz |
| Boost Clock | 2400 MHz | 1665 MHz |
| Release Date | Oct 12th, 2022 | Dec 1st, 2020 |
| Best Variants | - | Best RTX 3060 Ti graphics cards |
Architectural Difference
- Architecture: The Intel Arc A770 is powered by the Generation 12.7 architecture, while the RTX 3060 Ti utilizes the Ampere architecture.
- Process Node: The Arc A770 uses the DG2-512 chip, which is built on a 6nm process, while the RTX 3060 Ti employs the GA104 chip, which is built on an 8nm node.
- Clock Speed: Regarding the clock frequency, the Arc A770 has a 48.9% higher base clock and a 44.1% greater boost clock than the RTX 3060 Ti.
- VRAM: In terms of memory, the Arc A770 beats the RTX 3060 Ti with its 256-bit 16GB GDDR6 memory, having a bandwidth of up to 512.0 GB/s. In contrast, the RTX 3060 Ti has a 256-bit 8GB GDDR6X memory with a bandwidth of 448.0 GB/s.
- TDP: Comparing the GPU specifications, the RTX 3060 Ti has a TDP of 200 watts, whereas the Arc A770 has a TDP of 225 watts, indicating that it would consume more power than the RTX 3060 Ti.
In this comparison, we’ll test the features, performance, and efficiency of the Arc A770 vs RTX 3060 Ti. Our goal is to determine if Intel’s budget-friendly GPU is a worthwhile choice.
Gaming Benchmarks
We will now conduct thorough benchmarks of the ARC A770 vs GeForce RTX 3060 Ti, engaging in a comprehensive head-to-head comparison. To better understand how well they perform, we played 8 demanding games using these GPUs at 1440p resolution.
Testing Rig
- Operating System: Windows 10 Pro
- CPU: Intel Core i7-13700K
- Motherboard: MSI Z790 Tomahawk Max WiFi Motherboard
- RAM: Kingston Fury Renegade RGB DDR5 32GB 7200MHz
- Storage Drive: Sabrent Rocket 4 Plus 1TB NVMe SSD
- CPU Cooler: Noctua NH-L9x65 chromax.black CPU Air Cooler
- Power Supply: ENERMAX REVOLUTION D.F. X 1050W
STAR WARS Jedi Survivor
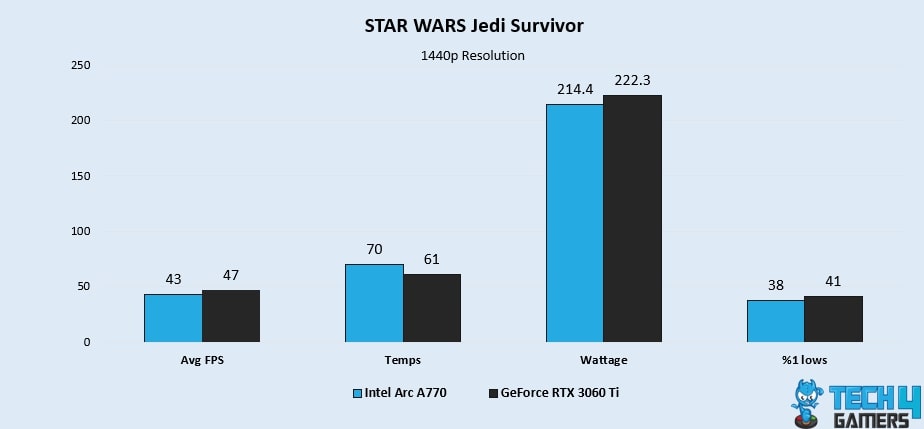
- During our first STAR WARS Jedi Survivor session, the RTX 3060 Ti outperforms the Arc A770, scoring 47 FPS on average, which is 8.8% higher than the Arc A770’s 43 FPS.
- Furthermore, the RTX 3060 Ti exhibits an improved 1% low performance, surpassing the Arc A770 with a remarkable 7.5% enhancement. It showcases 41 FPS, outperforming the Arc A770’s 38 FPS.
CYBERPUNK 2077
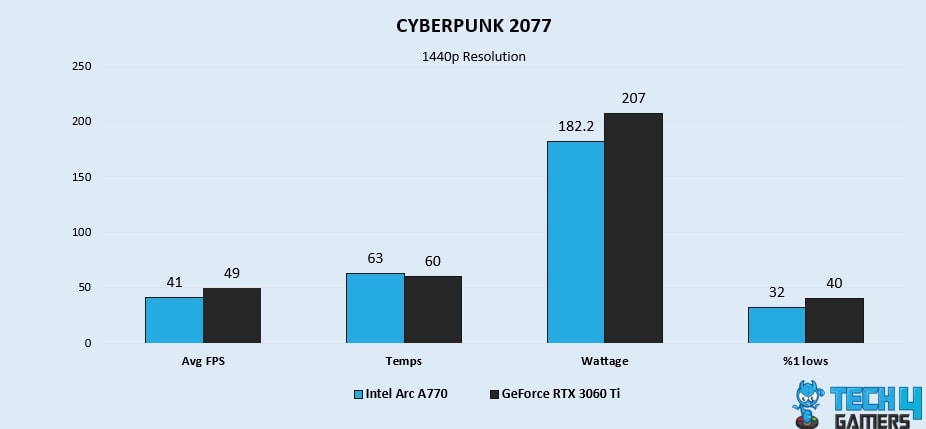
- During our Cyberpunk 2077 gameplay, the RTX 3060 Ti excels over the Arc A770, boasting an impressive average score of 49 FPS, 17.7% higher than the Arc A770’s 41 FPS.
- Furthermore, when it comes to 1% low performance, the RTX 3060 Ti outperforms the Arc A770 by 22.2%. It achieves 40 FPS, surpassing the Arc A770’s 32 FPS.
Red Dead Redemption 2
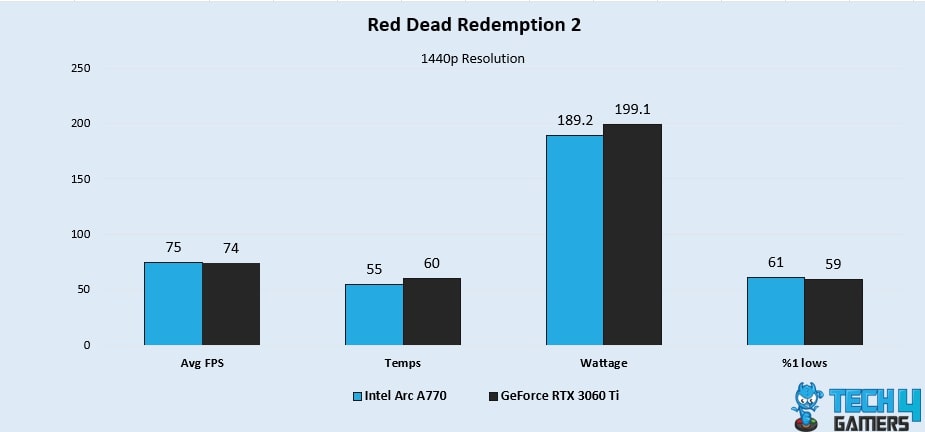
- While playing RDR 2, the RTX 3060 Ti gets beaten by the Arc A770, achieving an average score of 74, 1.3% lower than the Arc A770’s 75 FPS.
- Moreover, the RTX 3060 Ti showcases an inferior 1% low performance, achieving 59 FPS. This performance lags behind the Arc A770’s 61 FPS by 3%.
Forza Horizon 5
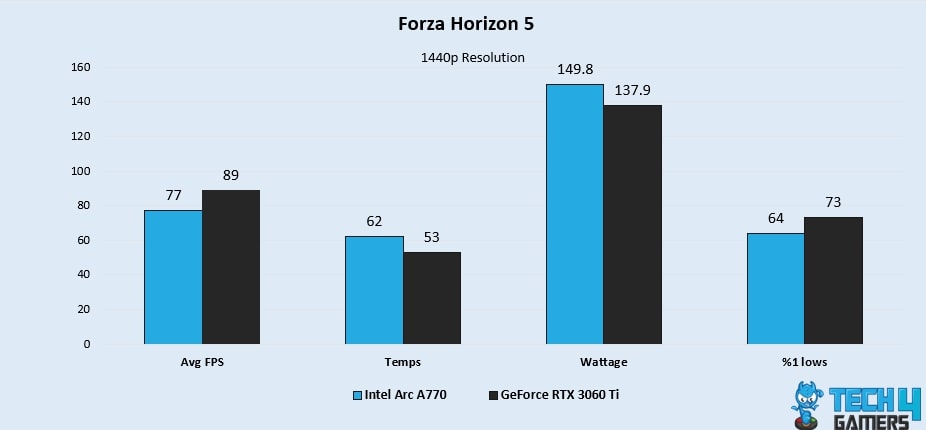
- In Forza Horizon 5, we saw the RTX 3060 Ti outshining the Arc A770 with an impressive average score of 89 FPS, surpassing the Arc A770’s 77 FPS by 14.4%.
- Additionally, in terms of 1% low performance, the RTX 3060 Ti excels by demonstrating a notable 13.1% better performance. It achieves 73 FPS, surpassing the Arc A770’s 64 FPS.
GTA 5
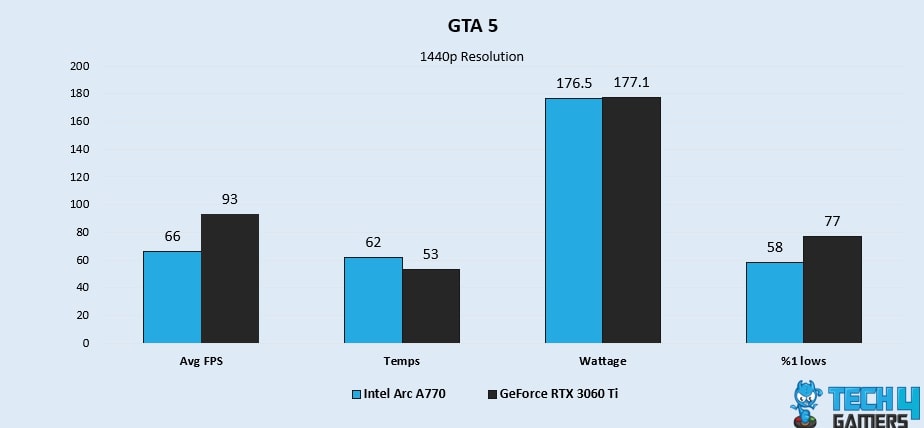
- In GTA 5, the RTX 3060 Ti outperforms the Arc A770, scoring an average of 93, which is 33.9% higher than the Arc A770’s 66 FPS.
- Furthermore, the RTX 3060 Ti impresses with its improved 1% low performance, exhibiting a remarkable 28.1% enhancement. It achieves 77 FPS, surpassing the Arc A770’s 58 FPS.
Hogwarts Legacy
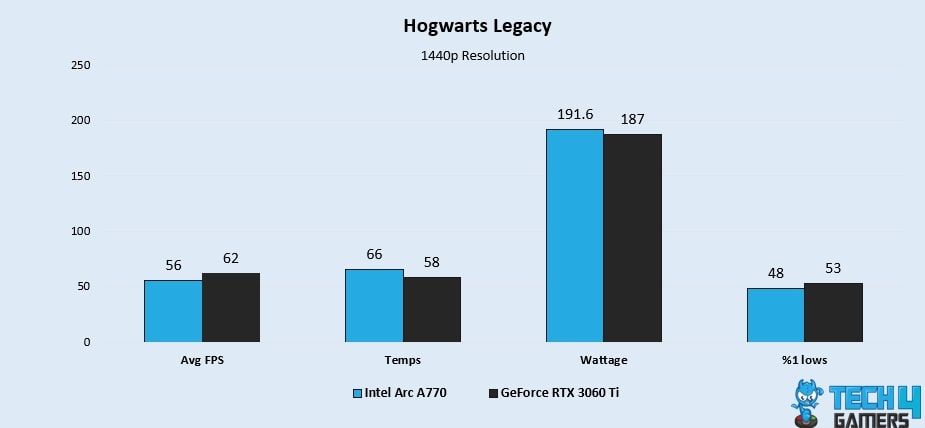
- During our Hogwarts Legacy session, the RTX 3060 Ti demonstrates 10.1% superior performance, achieving an average of 62 FPS, against the Arc A770’s 56 FPS.
- Furthermore, the RTX 3060 Ti demonstrates superior 1% low performance, achieving a 53 FPS. This is about 9.9% better than the Arc A770’s 48 FPS.
Microsoft Flight Simulator
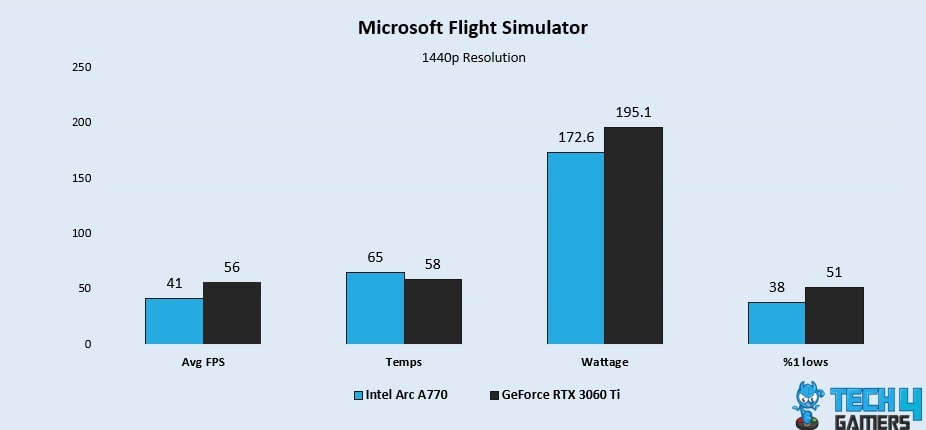
- During MFS, the RTX 3060 Ti outperforms the Arc A770 with an average of 56 FPS, surpassing the Arc A770’s 41 FPS by 30.9%.
- Additionally, in terms of 1% low performance, the RTX 3060 Ti excels with a notable 29.2%. It achieves 51 FPS, surpassing the Arc A770’s 38 FPS.
Spider-Man: Miles Morales
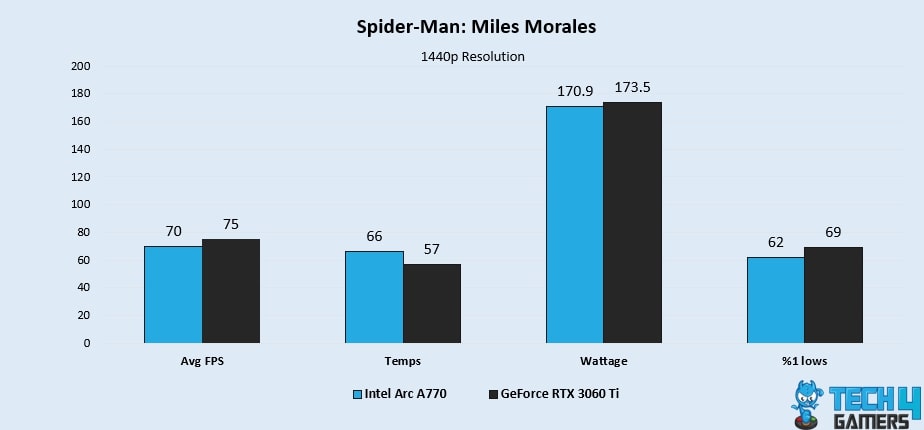
- In our last Spider-Man: Miles Morales gameplay, the RTX 3060 Ti impresses with an average score of 75 FPS, surpassing the Arc A770’s 70 FPS by 6.8%.
- In the 1% low performance, the RTX 3060 Ti surpassed the Arc A770 with a significant 10.6% improvement. It achieved 69 FPS, outperforming the Arc A770’s 62 FPS.
Overall Gaming Performance
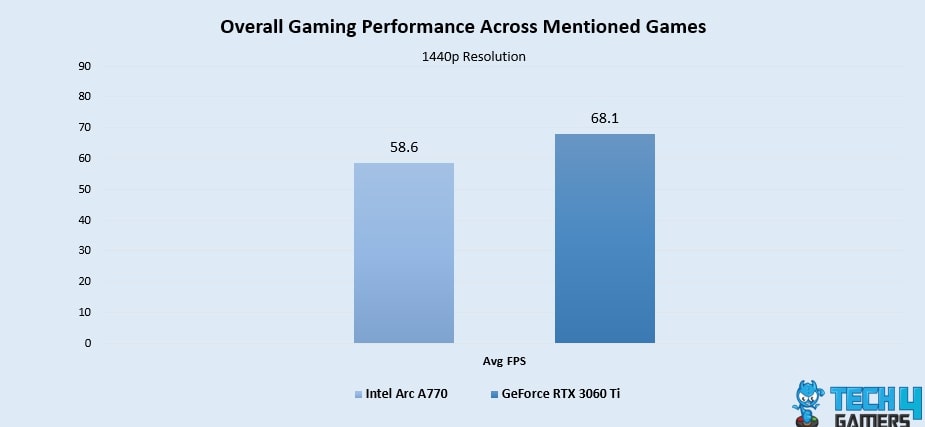
In our performance evaluations, the RTX 3060 Ti stands out with an average frame rate of 68.1 FPS, surpassing the Arc A770’s 58.6 FPS by a notable margin. This establishes the RTX 3060 Ti as the superior choice for gamers, outperforming the Arc A770 by a remarkable 14.9% in FPS performance.
Winner: GeForce RTX 3060 Ti
Power Consumption
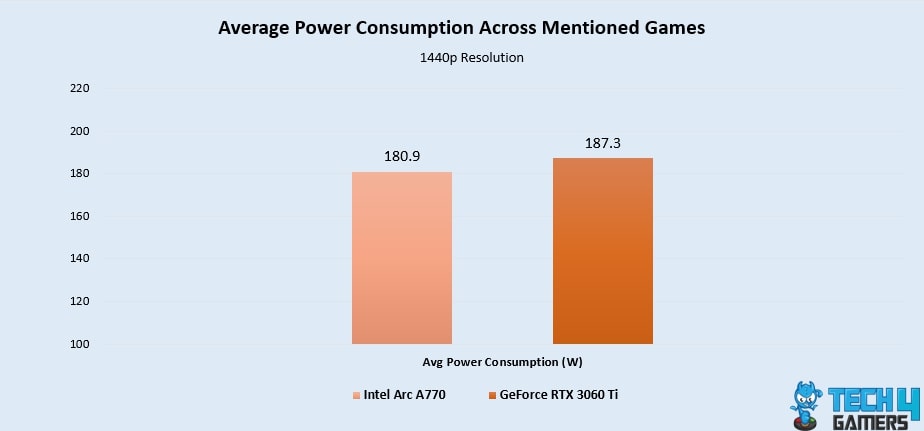
In our comparison of the Arc A770 vs RTX 3060 Ti, we observed that the Arc A770 exhibits 3.5% higher power efficiency than the RTX 3060 Ti. The RTX 3060 Ti operated with an average power draw of 187.3W in our gaming session, while the Arc A770 used 180.9W 0n average.
Winner: Intel Arc A770
Thermal Efficiency
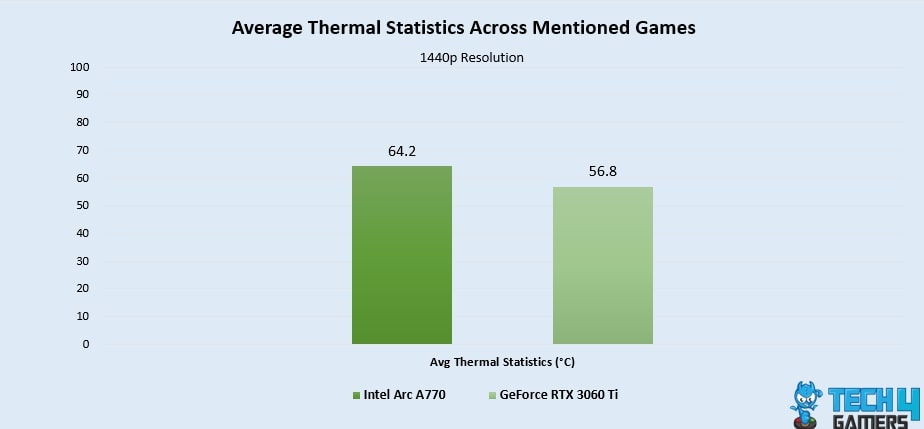
During our gaming temperature testing, the RTX 3060 Ti consistently exhibited superior thermal performance by operating at an average of 56.8°C, whereas the Arc A770 displayed a higher average temperature of 64.2°C. So, the RTX 3060 Ti outperformed the Arc A770 in thermal efficiency by an impressive 12.1%.
Winner: GeForce RTX 3060 Ti
Pricing And Availability
| GPU | Launch MSRP | Current Price |
|---|---|---|
| Intel Arc A770 | 💲329 | 💲289 |
| GeForce RTX 3060 Ti | 💲399 | 💲289 (Refurbished) |
| Price Difference | 21.3% | 0.0% |
Considering the launch prices, the RTX 3060 Ti was launched at a 21.3% higher price point than the Arc A770. However, in today’s market, a new Arc A770 and a renewed RTX 3060 Ti cost almost the same. So, considering the performance and efficiency, the RTX 3060 Ti provides better value.
Final Verdict: What Do We Recommend?
Intel Arc A770: The Arc A770 boasts a 256-bit 16GB GDDR6 memory, delivering exceptional performance in 1080p gaming and good capabilities at 1440p. Moreover, it comes at a highly competitive price point.
GeForce RTX 3060 Ti: The GeForce RTX 3060 Ti offers superior performance at a similar price point, with a relatively lower power consumption. Its upscaling capabilities are further enhanced by Nvidia’s DLSS technology.
Finally, if you want a GPU with better performance and efficiency at a lower cost, a refurbished RTX 3060 Ti is better. However, if you want to purchase a new GPU, then you should go for Arc A770 because a new RTX 3060 Ti costs much more in today’s market and has limited availability.
More From RTX 3060 Ti:
More From Arc A770:
Thank you! Please share your positive feedback. 🔋
How could we improve this post? Please Help us. 😔
[Comparisons Expert]
Shehryar Khan, a seasoned PC hardware expert, brings over five years of extensive experience and a deep passion for the world of technology. With a love for building PCs and a genuine enthusiasm for exploring the latest advancements in components, his expertise shines through his work and dedication towards this field. Currently, Shehryar is rocking a custom loop setup for his built.
Get In Touch: shehryar@tech4gamers.com


Feedback By: