 Threads

Eager to compare the price-to-performance ratio, I recently conducted gaming benchmarks pitting AMD’s RX 7900 XT vs RTX 3080 Ti from NVIDIA. With similar pricing, despite the generational gap, these tests aim to determine which GPU delivers the best value for gamers and enthusiasts alike.
Key Takeaways
- Upgrading from the older RTX 3080, the NVIDIA GeForce RTX 3080 Ti faces tough competition from the AMD Radeon RX 7900 XT, one of AMD’s latest GPUs.
- In my personal experience, the AMD Radeon RX 7900 XT showcases a remarkable 26.1% performance advantage over the RTX 3080 Ti, making it a compelling choice for gamers and enthusiasts.
- The thermal efficiency of the AMD Radeon RX 7900 XT shines through, maintaining a cooler average temperature of 69°C compared to the RTX 3080 Ti’s 74.7°C, enhancing overall stability and gaming performance.
- When looking at price performance, the AMD Radeon RX 7900 XT emerges as the cost-effective option, being 10.5% cheaper than the RTX 3080 Ti, solidifying its position as my top recommendation for high-end gaming graphics.
Comparison Table
| Technical Specs | GeForce RTX 3080 Ti | Radeon RX 7900 XT |
| GPU Name | GA102 | Navi 31 |
| Architecture | Ampere | RDNA 3.0 |
| Transistors | 28,300 million | 57,700 million |
| Shading Units | 10240 | 5376 |
| Tensor Cores | 320 | NA |
| RT Cores | 80 | 84 |
| TMUs | 320 | 336 |
| ROPs | 112 | 192 |
| L1 Cache | 128 KB (per SM) | 256 KB per Array |
| L2 Cache | 6 MB | 6 MB |
| Memory Bus Width | 384 bit | 320 bit |
| Memory Bandwidth | 912.4 GB/s | 800.0 GB/s |
| Suggested PSU | 750W | 700W |
| Release Date | May 31st, 2021 | Nov 3rd, 2022 |
| Approximated Price | 1000 USD | 899 USD |
| Best Variants | Best RTX 3080 Ti Cards |
Architectural Differences
- Process Node: The RTX 3080 Ti utilizes an 8nm process node, whereas the RX 7900 XT employs a more advanced 5nm process node.
- Clock Speed: The RTX 3080 Ti offers a base clock of 1365 MHz and a boost clock of 1665 MHz, while the RX 7900 XT boasts a base clock of 1500 MHz and an impressive boost clock of 2394 MHz.
- VRAM: With a VRAM capacity of 12GB GDDR6X, the RTX 3080 Ti falls short of the RX 7900 XT, which features a substantial 20GB GDDR6 VRAM.
- TDP: The RTX 3080 Ti carries a 350W TDP, which is 50W higher than the RX 7900 XT’s 300W TDP.
- Supported Technologies: While the RTX 3080 Ti is equipped with DLSS, the RX 7900 XT offers FidelityFX Super Resolution (FSR), both aiming to enhance gaming experiences.
Also Read: RX 7900 GRE Vs RX 7900 XT
RX 7900 XT Vs RTX 3080 Ti: Gaming Benchmarks
Now, let’s shift our focus to 4K gaming resolution, as high-end GPUs like the AMD Radeon RX 7900 XT and the NVIDIA GeForce RTX 3080 Ti are often sought after for their ability to handle gaming at this demanding resolution with higher refresh rates.
However, I recognize that 4K gaming places a heavier load on these GPUs, so I conducted a series of thorough tests to evaluate their performance in this resolution. Mark PC presents the results of these tests, shedding light on how these graphics cards fare when the visuals are pushed to the limits at 4K.
Testing Rig
- OS: Windows 11
- CPU: Intel Core i7-13700K
- Motherboards: ASRock Z790 Taichi Lite Motherboard
- RAM: Kingston Fury Renegade RGB DDR5 32GB 7200MHz
- SSD: XPG GAMMIX S70 BLADE 2TB NVMe SSD
- PSU: Enermax Revolution D.F. X 1050W
- CPU Cooler: MSI MAG CORELIQUID E360 CPU Liquid Cooler
Cyberpunk 2077
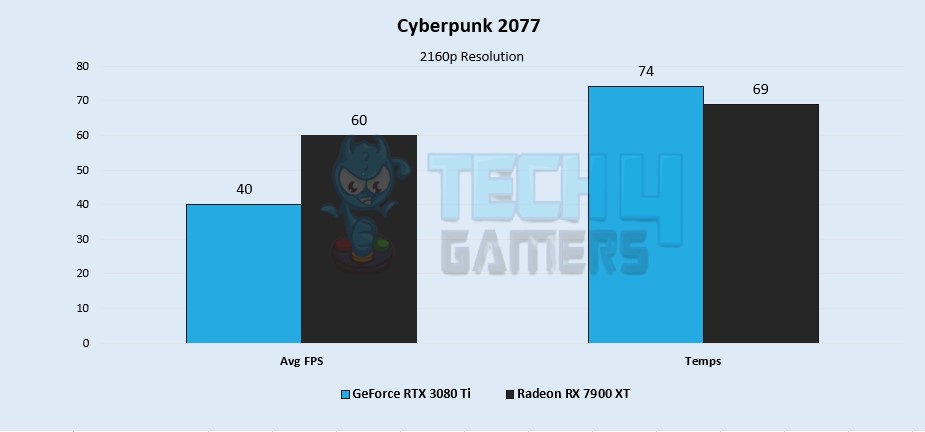
- While testing out Cyberpunk 2077, I found the AMD Radeon RX 7900 XT averages 60 FPS. On the other hand, the NVIDIA GeForce RTX 3080 Ti averages 40 FPS.
- The AMD Radeon RX 7900 XT is 50% faster than the NVIDIA GeForce RTX 3080 Ti in Cyberpunk 2077.
- The NVIDIA GeForce RTX 3080 Ti has an average temperature of 74°C. However, the AMD Radeon RX 7900 XT has an average temperature of 69°C.
Also Check: RTX 3090 Ti Vs RX 7900 XT
Red Dead Redemption 2
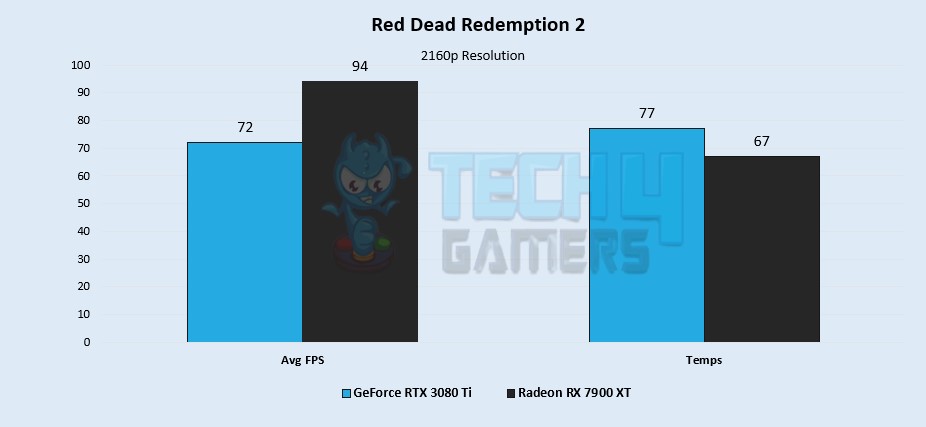
- The AMD Radeon RX 7900 XT averages 94 FPS. Meanwhile, the NVIDIA GeForce RTX 3080 Ti averages 72 FPS.
- Moreover, my personal test revealed the AMD Radeon RX 7900 XT is 30.5% faster than the NVIDIA GeForce RTX 3080 Ti in Red Dead Redemption 2.
- The NVIDIA GeForce RTX 3080 Ti averages 77°C. On the other hand, the AMD Radeon RX 7900 XT averages 67°C.
Similar Comparison: RTX 4070 Vs RX 7900 XT
Assassin’s Creed Valhalla
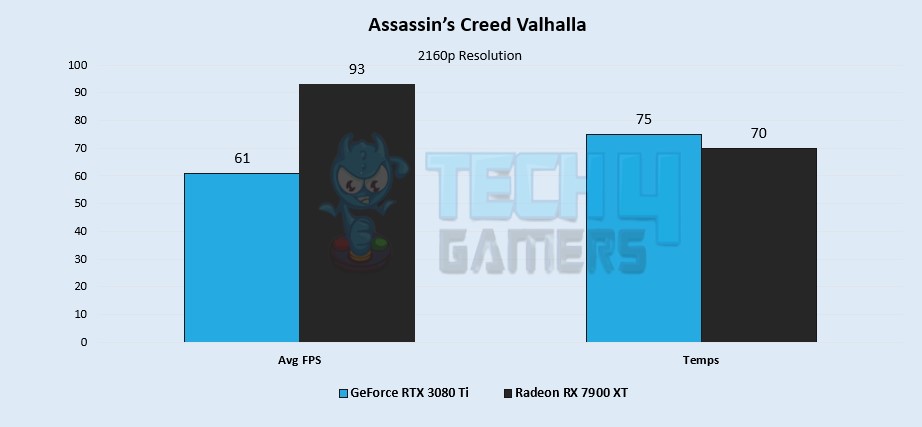
- Starting Assasins Creed Valhalla, the AMD Radeon RX 7900 XT averages 93 FPS. However, the NVIDIA GeForce RTX 3080 Ti averages 61 FPS.
- The AMD Radeon RX 7900 XT is 52.43% faster than the NVIDIA GeForce RTX 3080 Ti in Assassin’s Creed Valhalla.
- My tests further revealed that the NVIDIA GeForce RTX 3080 Ti has an average temperature of 75°C. On the other hand, the AMD Radeon RX 7900 XT has an average temperature of 70°C.
Also Read: RTX 4070 Ti Vs RX 7900 XT
Watch Dogs Legion
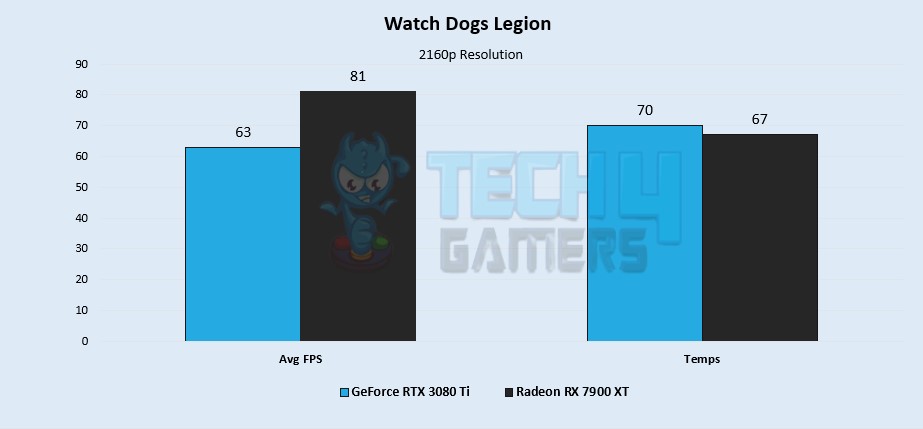
- The AMD Radeon RX 7900 XT averages 81 FPS, while the NVIDIA GeForce RTX 3080 Ti averages 63 FPS.
- While checking the difference in performance, I saw that the AMD Radeon RX 7900 XT is 28.57% faster than the NVIDIA GeForce RTX 3080 Ti in Watch Dogs Legion.
- The NVIDIA GeForce RTX 3080 Ti has an average temperature of 70°C. On the other hand, the AMD Radeon RX 7900 XT has an average temperature of 67°C.
Similar Comparison: RX 7900 XT Vs RX 6800 XT
God Of War
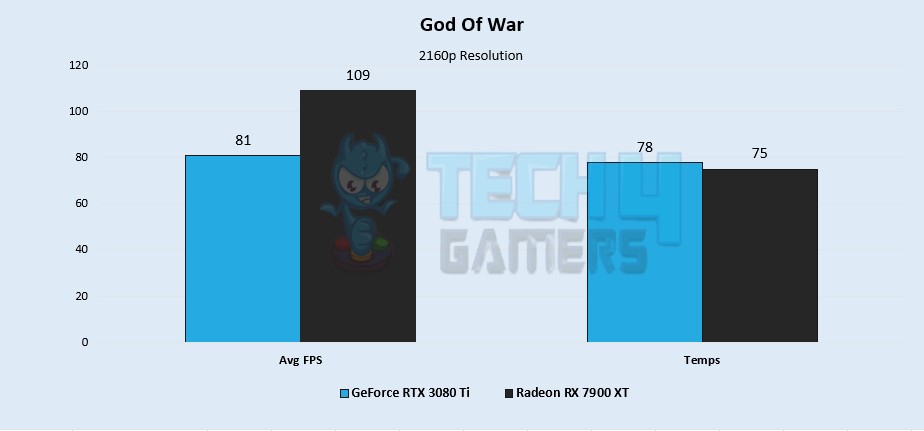
- The AMD Radeon RX 7900 XT averages 109 FPS, whereas the NVIDIA GeForce RTX 3080 Ti averages 81 FPS.
- In addition, similar to my previous testing, the AMD Radeon RX 7900 XT is 34.56% faster than the NVIDIA GeForce RTX 3080 Ti in God of War.
- The NVIDIA GeForce RTX 3080 Ti has an average temperature of 78°C. Meanwhile, the AMD Radeon RX 7900 XT has an average temperature of 75°C.
Also Check: RX 7900 XTX Vs RX 7900 XT
Doom Eternal
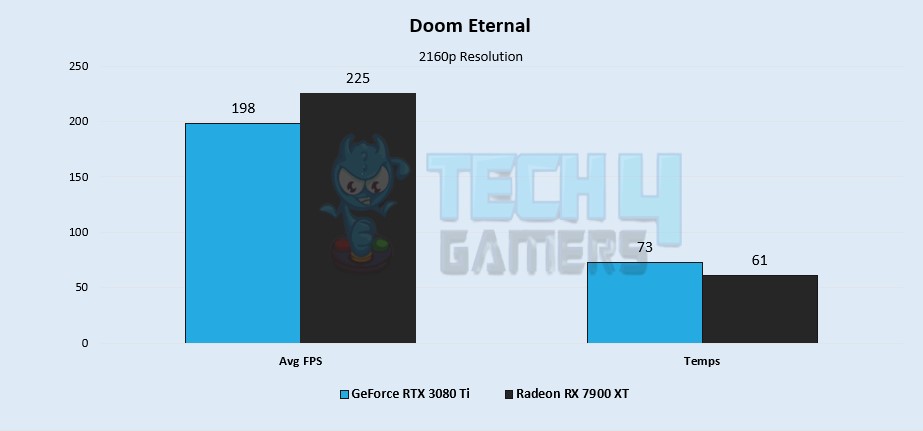
- While collecting the benchmark stats in Doom Eternal, the AMD Radeon RX 7900 XT averages 225 FPS, while the NVIDIA GeForce RTX 3080 Ti averages 198 FPS.
- The AMD Radeon RX 7900 XT is 13.6% faster than the NVIDIA GeForce RTX 3080 Ti in Doom Eternal.
- The NVIDIA GeForce RTX 3080 Ti has an average temperature of 73°C. On the other hand, the AMD Radeon RX 7900 XT has an average temperature of 61°C.
Also Read: RX 7900 XT vs RTX 4080
Horizon Zero Dawn
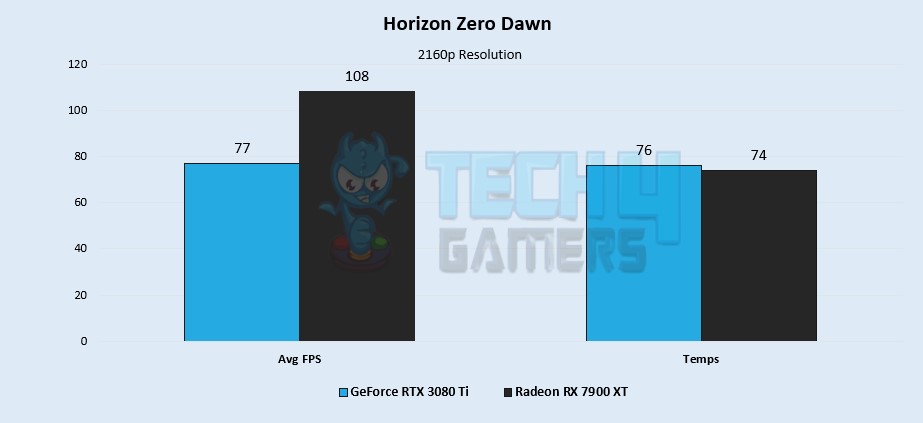
- This time, I was testing the Horizon Zero Dawn, the AMD Radeon RX 7900 XT averages 108 FPS. Meanwhile, the NVIDIA GeForce RTX 3080 Ti averages 77 FPS.
- Here the AMD Radeon RX 7900 XT is 40.25% faster than the NVIDIA GeForce RTX 3080 Ti in Horizon Zero Dawn.
- The RTX 3080 Ti has an average temperature of 76°C. On the other hand, the AMD Radeon RX 7900 XT has an average temperature of 74°C.
Similar Comparison: RX 7900 XT Vs RTX 3080 Ti
Overall Gaming Performance
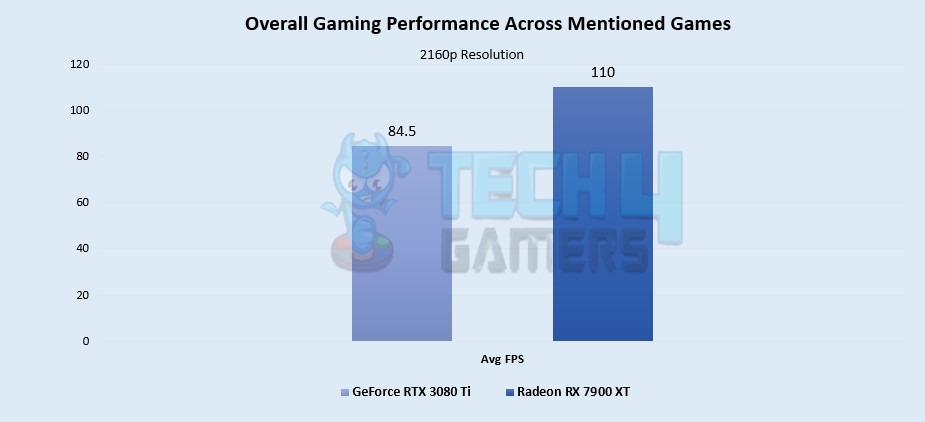
- In the demanding realm of 4K gaming, I found the AMD Radeon RX 7900 XT delivers a remarkable average of 110 FPS.
- Its competitor, the NVIDIA GeForce RTX 3080 Ti, maintains an average of 84.5 FPS at 4K resolution.
- These results emphasize the substantial lead of the AMD Radeon RX 7900 XT, outpacing the RTX 3080 Ti by a significant 26.1%.
Also Check: RX 7900 XT Vs RTX 3080
Average Thermal Statistics
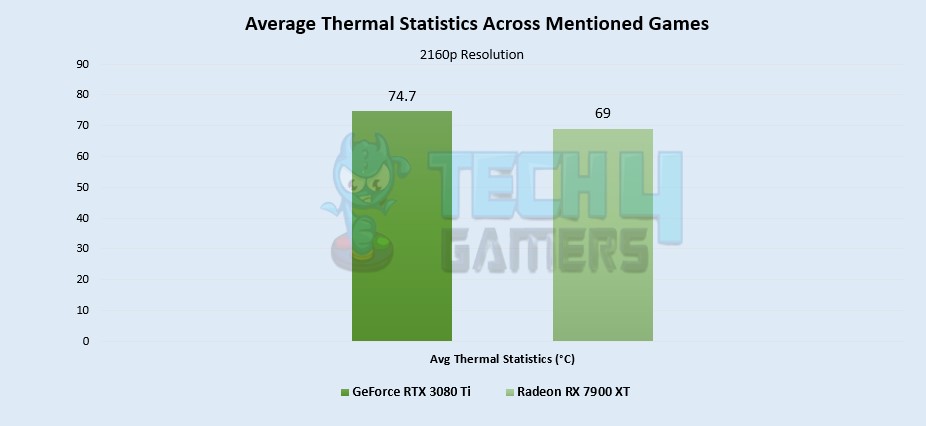
- In my firsthand experience, focusing on GPU temperatures when aiming for 4K gaming is crucial for a smooth and reliable gaming experience.
- The AMD Radeon RX 7900 XT, with its lower average temperature of 69°C, offers a 7.9% advantage in thermal efficiency, translating into a more stable and efficient gaming setup at 4K resolution.
- Comparatively, the NVIDIA GeForce RTX 3080 Ti tends to run hotter, with an average temperature of 74.7°C, potentially limiting overclocking capabilities and causing concern about long-term reliability.
More Comparisons: RX 7900 XT Vs RTX 3080
Price And Availability
As I was searching different platforms, I found the NVIDIA GeForce RTX 3080 Ti is priced at $1000 on popular platforms like Newegg, while the AMD Radeon RX 7900 XT is available for $899. This price disparity can be attributed to the AMD GPU being a newer release compared to the older NVIDIA GPU.
Consequently, the NVIDIA GeForce RTX 3080 Ti is currently 10.5% more expensive than the AMD Radeon RX 7900 XT. Therefore, from a pricing perspective, the AMD GPU offers better value. Additionally, it’s worth noting that the AMD GPU boasts greater availability, with both GPUs readily accessible on websites such as Amazon and Newegg.
Also Read: RTX 4070 Vs RTX 3080 Ti
RX 7900 XT Vs RTX 3080 Ti: Which One Would I Recommend?
- Based on my firsthand experience, I wholeheartedly recommend the AMD Radeon RX 7900 XT, which outperforms the RTX 3080 Ti by an impressive 26.1%.
- The AMD Radeon RX 7900 XT maintains a cooler average temperature of 69°C compared to the RTX 3080 Ti’s 74.7°C, resulting in a 7.9% advantage in thermal efficiency.
- When considering the price-performance ratio, the AMD Radeon RX 7900 XT is a more cost-effective choice, as it is currently 10.5% cheaper than the RTX 3080 Ti, making it my top pick for high-end gaming graphics.
Similar Comparison: RTX 3080 Vs 3080 Ti
Pros And Cons
| GPU | Pros | Cons |
| Radeon RX 7900 XT |
|
|
| GeForce RTX 3080 Ti |
|
|
Also Check: RX 6800 XT Vs RTX 3080 Ti
Frequently Asked Questions
Although the difference isn’t a lot, the RTX 3080 Ti is slightly faster than the RTX 3080.
Although no hardware is favourable with an inflated price tag, the RTX 3080 Ti does provide decent performance. Depending on your use-case scenario, it can be worth its price.
Thanks to its latest RDNA 3 architecture, the RX 7900 XT does support up to 8K 165Hz. However, I have yet to see a performance that can make 8K resolution playable.
Thank you! Please share your positive feedback. 🔋
How could we improve this post? Please Help us. 😔
[Comparisons Expert]
Abdemanaf is a skilled creative writer who has been honing his craft since 2011. While initially working in different fields, he found a passion for technology and has been exploring the tech world since early 2015. Over the years, he has developed an in-depth knowledge of the latest tech trends and product offerings by various companies.
Abdemanaf’s writing reflects his analytical mindset and ability to think critically. He has a knack for breaking down complex technical information into easily digestible pieces, making his articles engaging and accessible to readers from all backgrounds. In February 2022, he joined Tech4Gamers as a blog and product comparison writer, where he has been able to hone his skills further.
As a writer, Abdemanaf is dedicated to staying up-to-date with the latest technological advancements and trends, enabling him to provide readers with the most relevant and accurate information. He is always eager to learn more and is constantly seeking new challenges to improve his skills.
Get In Touch: manaf@tech4gamers.com


