


Radeon RX 7900 GRE
Rated: 8.5/10
Radeon RX 7900 XT
Rated: 8.8/10
Pros And Cons
| GPU | Pros | Cons |
|---|---|---|
| RX 7900 GRE | ✅ Impressive performance for 1440p gaming ✅ Generous 16GB GDDR6 VRAM | ❌ Requires minimum 600W power supply |
| RX 7900 XT | ✅ Exceptional 4K performance ✅ Budget-friendly alternative to some RTX cards | ❌ Falls short in software compared to Nvidia's offerings |
- The RX 7900 XT demonstrates an 18.8% lead in FPS performance, outperforming the RX 7900 GRE.
- The RX 7900 GRE gains an edge with an impressive 18.3% advantage in power efficiency compared to the RX 7900 XT.
- With a lead of 3.3% in thermal handling, the RX 7900 XT stands out as a cooler option, maintaining efficient temperature control.
- Both GPUs are priced higher than their MSRP, with the RX 7900 GRE experiencing a more significant increase. Despite this, the RX 7900 GRE offers a cost-effective option with a 32.2% price advantage over the RX 7900 XT.
Comparison Table
| Technical Specifications | Radeon RX 7900 GRE | Radeon RX 7900 XT |
|---|---|---|
| GPU Name | Navi 31 | Navi 31 |
| Architecture | RDNA 3.0 | RDNA 3.0 |
| CUDA Cores | 5120 | 5376 |
| RT Cores | 80 | 84 |
| ROPs | 192 | 192 |
| Suggested PSU | 600W | 700W |
| Best Variants | Best RX 7900 XT Cards |
Architectural Differences
- Process Node: Notably, the RX 7900 GRE and RX 7900 XT both share the same cutting-edge 5nm process node, a testament to their high-end design and manufacturing.
- Clock Speed: When it comes to clock speeds, the RX 7900 GRE boasts a Base Clock of 1500 MHz and Boost Clock of 2245 MHz, while the RX 7900 XT steps in with a Base Clock of 2025 MHz and Boost Clock of 2394 MHz.
- VRAM: In terms of VRAM, both the RX 7900 GRE and RX 7900 XT offer impressive capacities, with the GRE featuring 16GB GDDR6 VRAM and the XT going a step further with 20GB GDDR6 VRAM.
- TDP: The RX 7900 GRE demonstrates its efficiency with a 260W TDP, a notable aspect that aligns well with its performance-oriented design, while the RX 7900 XT carries a slightly higher 300W TDP.
- Supported Technologies: Moving to supported technologies, both the RX 7900 GRE and RX 7900 XT embrace the advantages of FidelityFX Super Resolution (FSR), enhancing visuals and performance in various gaming scenarios.
Our detailed comparison will help you understand the major differences between RX 7900 GRE and RX 7900 XT as we’ll test them in several games. We are also going to go through their specs along with their architectural differences.
Gaming Performance Benchmarks
It’s time to take a look at the RX 7900 GRE and RX 7900 XT gaming benchmarks.
Testing Rig
- CPU: Intel Core i7 13700k
- Motherboard: MSI MEG Z790 ACE MAX Motherboard
- Memory: XPG Lancer RGB 32GB 7200MHz DDR5 Ram
- Power Supply: ENERMAX REVOLUTION D.F. X 1050W
- CPU Cooler: Corsair ICUE H150I ELITE
- Storage Drive: XPG GAMMIX S70 BLADE 2TB NVMe SSD
- Operating System: Windows 10 pro
Far Cry 6
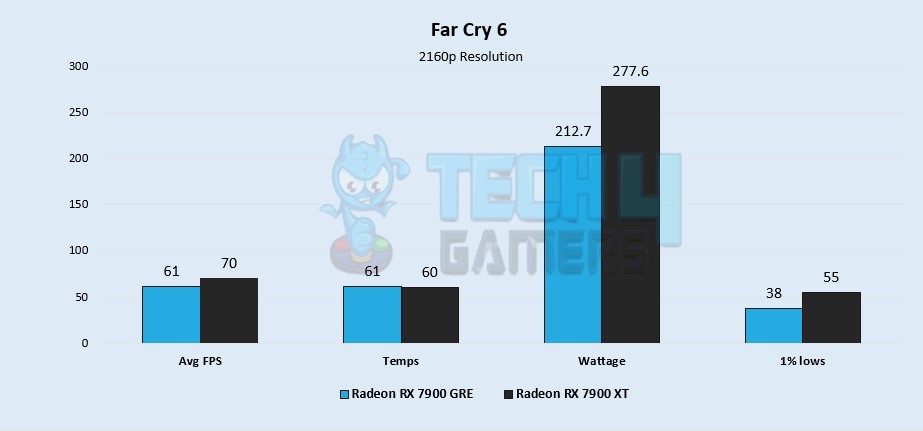
- When playing Far Cry 6, the RX 7900 GRE falls behind with an average FPS of 61, while the RX 7900 XT leads with an impressive 70 FPS, marking a substantial 13.7% performance gap.
- In addition, the RX 7900 XT takes a decisive lead, boasting a remarkable 1% low performance of 55 FPS, while the RX 7900 GRE lags at 38 FPS, showcasing a substantial performance difference of 36.5%.
Cyberpunk 2077
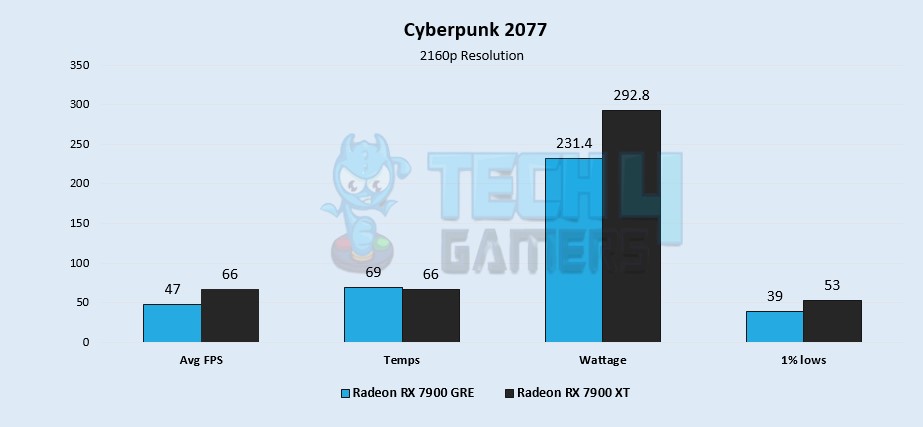
- I noticed a disparity in average FPS performance, as the RX 7900 GRE achieves 47 FPS, trailing the RX 7900 XT’s dominant 66 FPS by an impressive 33.6%.
- Moreover, the RX 7900 XT establishes its supremacy with a 1% low performance of 53 FPS, outpacing the RX 7900 GRE’s 39 FPS, revealing a substantial % performance difference of 30.4%.
Marvel Spiderman Remastered
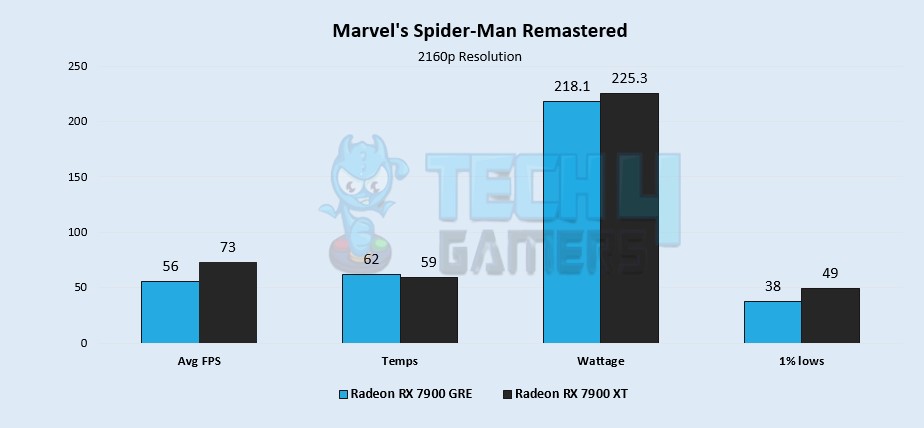
- In the realm of average FPS, the RX 7900 XT excels with 73 FPS, surpassing the RX 7900 GRE’s 56 FPS, showcasing a notable 26.3% performance difference.
- In the realm of 1% low performance, the RX 7900 XT commands a lead with a performance of 49 FPS, while the RX 7900 GRE trails at 38 FPS, showcasing a notable performance difference of 25.2%.
Hitman III
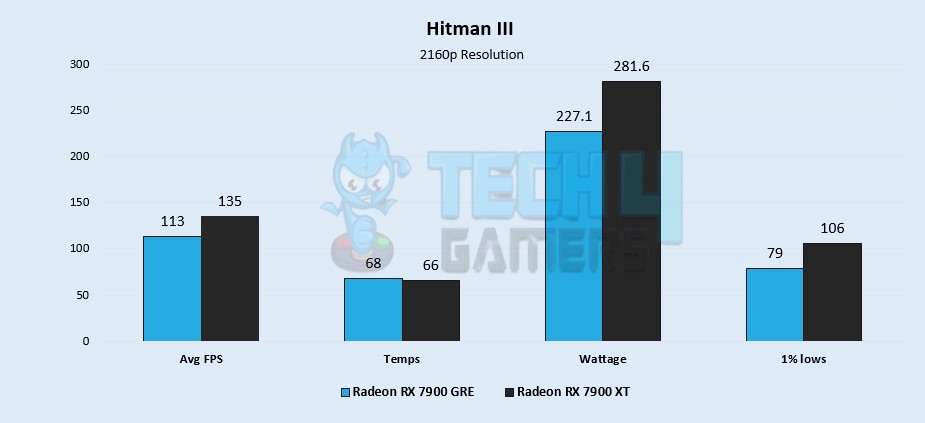
- Demonstrating a significant performance difference, the RX 7900 XT leads with an average FPS of 135, leaving the RX 7900 GRE behind with a performance of 113, marking a 17.7% variance.
- The RX 7900 XT showcases its power with an exceptional 1% low performance of 81 FPS, while the RX 7900 GRE achieves 79 FPS, revealing a substantial performance difference of 29.1%.
Horizon Zero Dawn
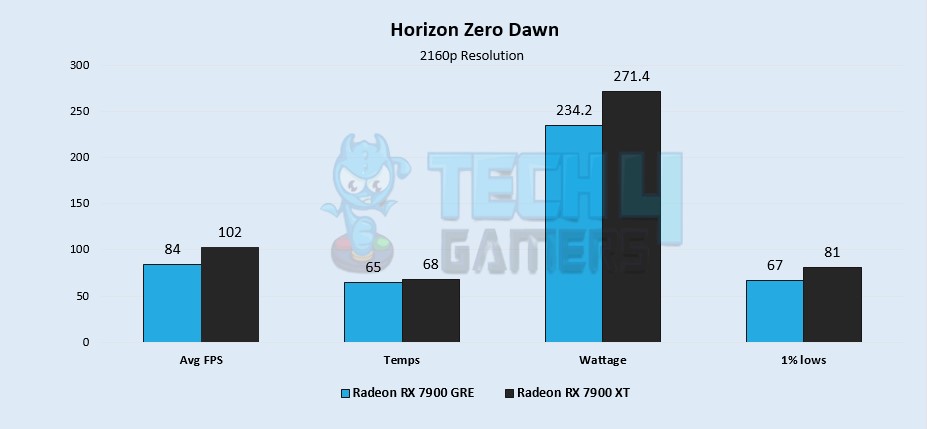
- While playing the Horizon Zero Dawn, the RX 7900 XT asserts its dominance in average FPS, achieving 102 FPS, while the RX 7900 GRE falls short with 84 FPS, revealing a performance gap of 19.3%.
- With an impressive 1% low performance of 81 FPS, the RX 7900 XT takes the lead over the RX 7900 GRE, which delivers 67 FPS, highlighting a performance difference of 18.9%.
God Of War
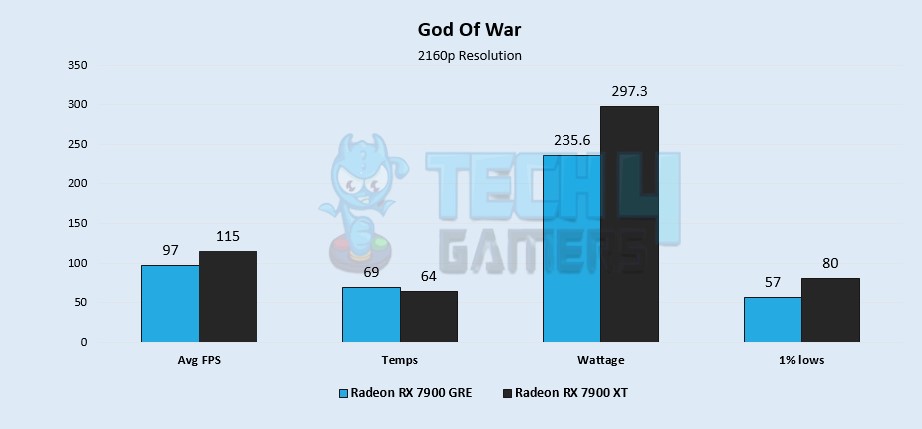
- During my session of God of War, the RX 7900 GRE achieves 97 FPS, but the RX 7900 XT outshines with a performance of 115 FPS, showcasing a 16.9% performance difference.
- In addition, the RX 7900 XT proves its dominance in 1% low performance, reaching 80 FPS, while the RX 7900 GRE falls behind at 57 FPS, resulting in a substantial performance difference of 33.5%.
Forza Horizon 5
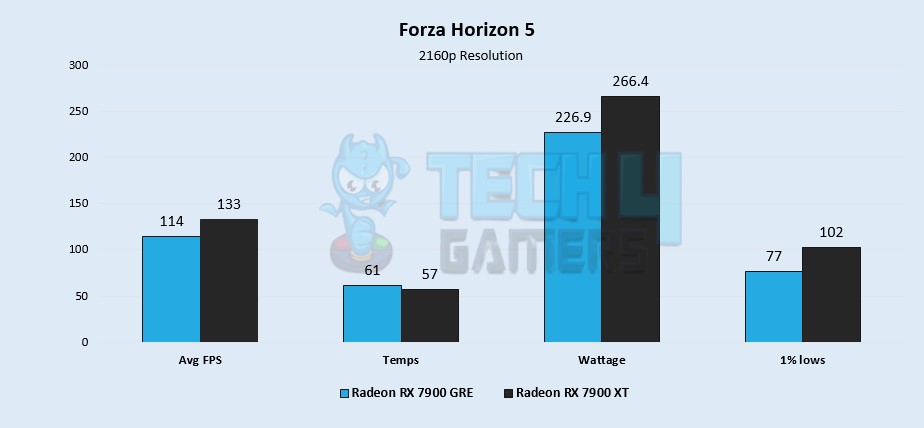
- When I played Forza Horizon 5, the RX 7900 GRE achieves 114 FPS, while the RX 7900 XT takes the lead with a performance of 133 FPS, marking a significant 15.3% variance.
- Commanding the lead in 1% low performance, the RX 7900 XT delivers an impressive 102 FPS, leaving the RX 7900 GRE at 77 FPS and showcasing a substantial performance difference of 27.9%.
Assasin’s Creed Valhalla
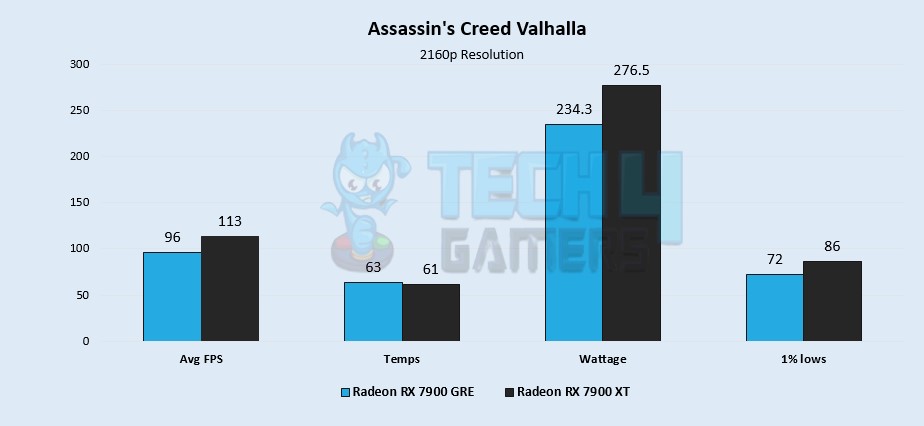
- While testing the last game, the RX 7900 GRE’s average FPS of 96 falls behind the RX 7900 XT’s impressive performance of 113, showcasing a 16.2% performance difference that favors the latter.
- In addition, the RX 7900 XT showcases its strength in 1% low performance with 86 FPS, outperforming the RX 7900 GRE’s 72 FPS, resulting in a performance difference of 17.7%.
Overall Gaming Performance
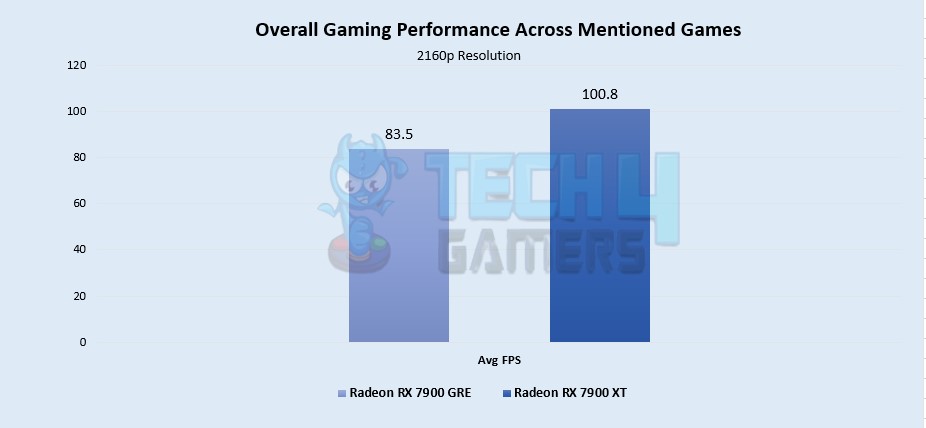
In my testing, I found that the RX 7900 XT performs better than the RX 7900 GRE. With an average FPS of 100.8, the RX 7900 XT outshines the RX 7900 GRE, which only manages an average FPS of 83.5. I was impressed to see that the RX 7900 XT takes the lead by a significant margin of 18.8%.
Winner: RX 7900 XT
Average Power Consumption
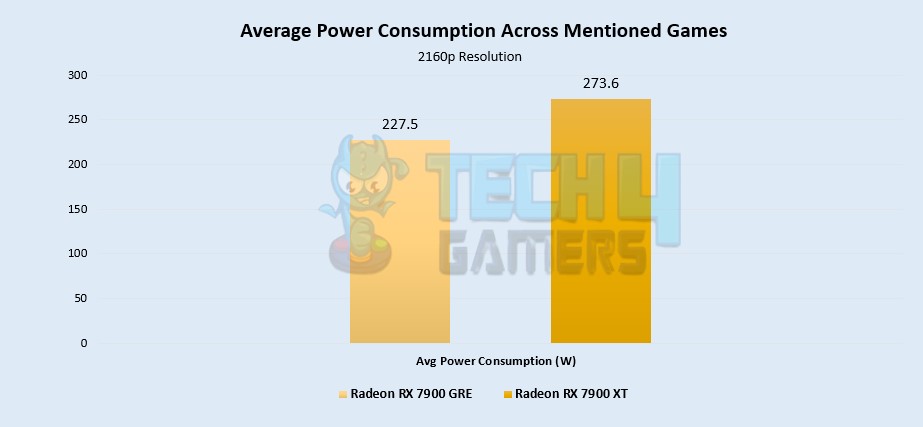
The RX 7900 XT operates with a power consumption of 227.5W, while the RX 7900 GRE consumes 273.6W. This indicates a notable contrast in power efficiency between the two. Surprisingly, the RX 7900 GRE manages to surpass the RX 7900 XT with an impressive 18.3% power efficiency advantage.
Winner: RX 7900 GRE
Average Thermal Statistics
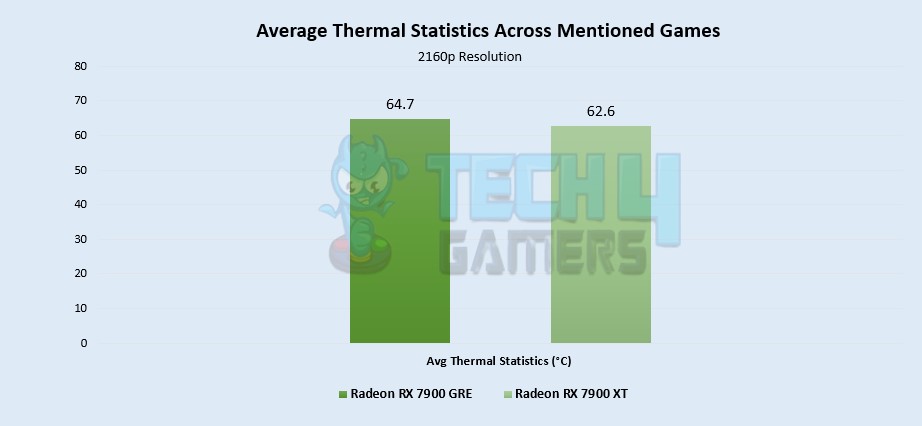
Operating at an average temperature of 62.6°C, the RX 7900 XT demonstrates effective heat control, whereas the RX 7900 GRE maintains 64.7°C. Finally, the RX 7900 XT sets a notable standard by achieving a 3.3% boost in thermal efficiency over the RX 7900 GRE.
Winner: RX 7900 XT
Pricing And Availability
| GPU | MSRP | Current Price |
|---|---|---|
| RX 7900 GRE | 💲649 | 💲779 |
| RX 7900 XT | 💲899 | 💲699 |
| Difference | 32.29% | 10.8% |
The current prices of both GPUs are higher than their MSRP, with the RX 7900 GRE experiencing a more significant increase. This could be due to various factors such as supply and demand dynamics, component costs, and market trends.
Final Verdict: Which Graphics Card to Choose?
Radeon RX 7900 GRE: The RX 7900 GRE offers a cost-effective option for gamers seeking high-performance graphics. With its impressive 18.3% edge in power efficiency over the RX 7900 XT, it manages to deliver top-notch performance while sipping less power. Plus, its enticing 32.2% price advantage makes it a compelling choice for those mindful of their budget. However, it does experience a setback in FPS performance, trailing behind the RX 7900 XT by 18.8%.
Radeon RX 7900 XT: The RX 7900 XT demonstrates its dominance with higher FPS performance and superior thermal efficiency. It outperforms the RX 7900 GRE by a notable 18.8% in FPS performance, making it the preferred choice for gamers prioritizing raw gaming performance. Moreover, its 3.3% lead in thermal efficiency ensures efficient heat management even during intense gaming marathons.
Gamers prioritizing raw gaming performance might prefer the RX 7900 XT, while those concerned about power efficiency and budget might lean toward the RX 7900 GRE.
More From the RX 7900 GRE
More From the RX 7900 XT
Thank you! Please share your positive feedback. 🔋
How could we improve this post? Please Help us. 😔
[Comparisons Expert]
Abdemanaf is a skilled creative writer who has been honing his craft since 2011. While initially working in different fields, he found a passion for technology and has been exploring the tech world since early 2015. Over the years, he has developed an in-depth knowledge of the latest tech trends and product offerings by various companies.
Abdemanaf’s writing reflects his analytical mindset and ability to think critically. He has a knack for breaking down complex technical information into easily digestible pieces, making his articles engaging and accessible to readers from all backgrounds. In February 2022, he joined Tech4Gamers as a blog and product comparison writer, where he has been able to hone his skills further.
As a writer, Abdemanaf is dedicated to staying up-to-date with the latest technological advancements and trends, enabling him to provide readers with the most relevant and accurate information. He is always eager to learn more and is constantly seeking new challenges to improve his skills.
Get In Touch: manaf@tech4gamers.com


