The latest generation of graphics cards has been giving mediocre performance while being highly-priced. This is why we’ve set up RX 7800 XT vs RX 7900 XT against each other to evaluate if the latest effort from AMD has broken this sub-standard track record or if it blends in with the rest of the competition.
- The RX 7900 XT showed us that it is 33% faster at 4K than the RX 7800 XT.
- We noticed that the RX 7800 XT consumed around 70 watts less than the RX 7900 XT.
- The RX 7900 XT is best suited for users seeking ultimate performance at 4K, while the RX 7800 XT poses as a budget-friendly option with optimum performance.
Comparison Table
| Technical Specs | Radeon RX 7900 XT | Radeon RX 7800 XT |
|---|---|---|
| Streaming Processors | 5376 | 3840 |
| RT Cores | 84 | 60 |
| TMUs | 336 | 240 |
| Memory Speed | 800.0 GB/s | 620 GB/s |
| Approximate Price | $760-$950 | $510 to $580 |
| Best Variants | Best RX 7900 XT | Best RX 7800 XT |
Architectural Differences
- Process Node: Both cards feature AMD’s RDNA 3 core architecture, employing a hybrid design using both 5nm and 6nm transistors.
- Clock Speed: The 7900 XT boasts higher clock speeds with a base of 1500MHz compared to the RX 7800XT’s 1295MHz. However, the RX 7800XT surpasses in boost clock at 2430MHz versus the 7900 XT’s 2394MHz.
- TDP: The RX 7900 XT has a TDP of 300 watts, whereas the RX 7800 XT pushes the TDP down to around 263 watts.
- VRAM & Memory Bandwidth: The RX 7900 XT uses 20GB, whereas the RX 7800XT uses 16GB of VRAM. Both VRAM buffers use GDDR6 memory, though the bandwidth on the higher-tier card is also proportionally higher.
- Bus Width: The fewer memory modules on the RX 7800 XT allow it to have a 256-bit bus, whereas the RX 7900 XT makes use of a wider 320-bit memory bus.
- Other Features: Both cards support ray tracing with performance roughly equivalent to the RTX 30 series. These cards also boast FSR chops, which AMD has made available on a driver level to allow compatibility with any game running on your system.
RX 7800 XT Vs RX 7900 XT: Gaming Benchmarks At 4K
The best way to evaluate the performance is to hold them against each other in real-world benchmarks, which is why we decided to put them to the test.
Testing Rig
- CPU: Ryzen 7 7800X3D
- RAM: Sabrent Rocket DDR5 16GB – 4600MHz
- Storage Drive: XPG Gammix S70 Blade 2TB NVMe
- Power Supply: be quiet! Dark Power Pro 13 1300W
- CPU Cooler: Corsair ICUE H150I Elite
- OS: Windows 11
A Plague Tale: Requiem
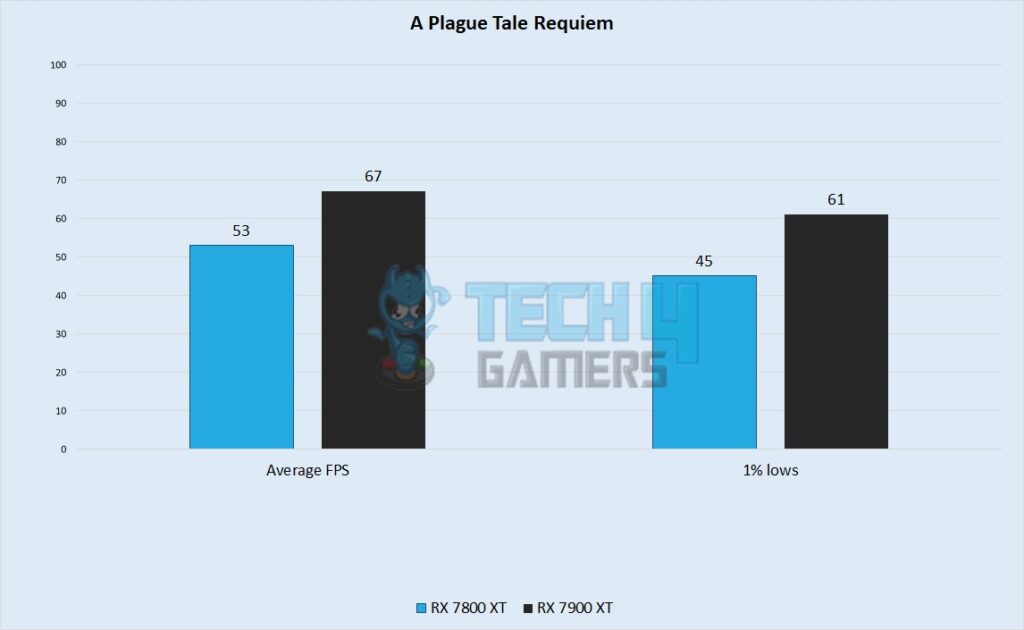
- The RX 7800 XT missed the 60 FPS mark, giving a performance of 53 FPS on average. In contrast, its elder brother flew past it with an average performance of 67 FPS.
- In terms of 1% lows, the RX 7800 XT maintained a minimum framerate of 45 FPS, whereas the RX 7900 XT had a much more bearable performance of around 61 FPS.
Resident Evil 4
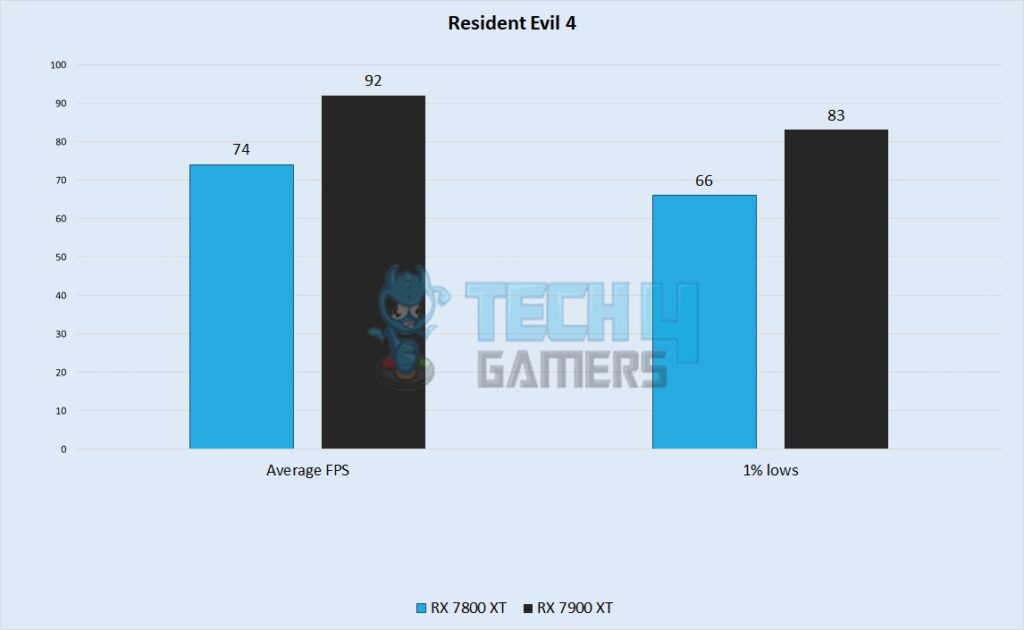
- Playing at the highest graphics preset on the RX 7800 XT, we observed an average of 74 FPS, whereas the RX 7900 XT averaged 92 FPS, outshining its little brother.
- 1% lows were adequate on the cheaper card, where the RX 7800 XT maintained 66 FPS, whereas the RX 7900 XT displayed an average of 83 FPS.
Cyberpunk 2077
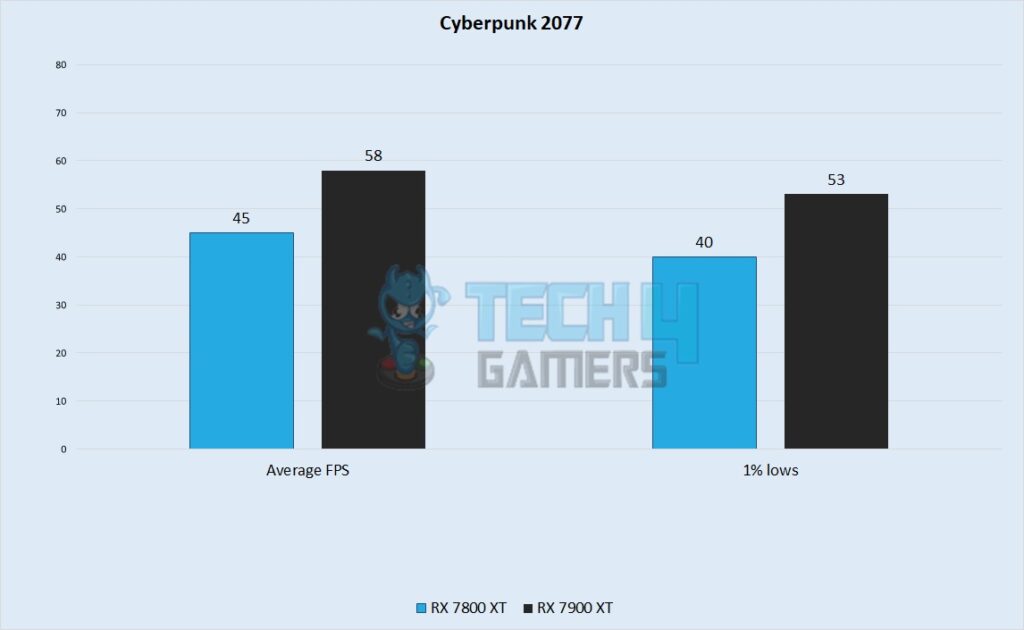
- In our observation, Cyberpunk 2077 had a playable experience on the RX 7800 XT, managing 45 FPS at the highest preset whereas the RX 7900 XT obtained 58 FPS.
- The 7800 XT maintained a minimum 1% low of around 40 FPS in the more demanding scenes. In contrast, the 7900 XT had a minimum framerate of around 53 FPS.
Hogwarts Legacy
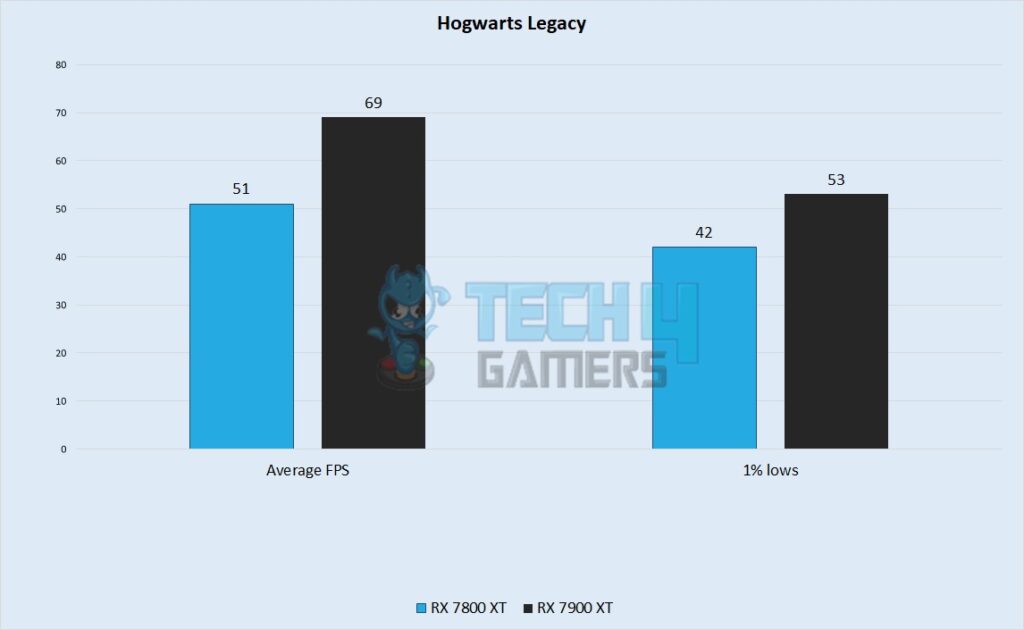
- In my observation, the RX 7800 XT handled this game with an average framerate of 51 FPS, whereas the RX 7900 XT had an average framerate of around 69 FPS.
- The stutters in this game were very noticeable, with the 7800 XT dropping its framerate to 42 FPS, whereas the 7900 XT dropped its framerate to around 53 FPS.
Forza Horizon 5
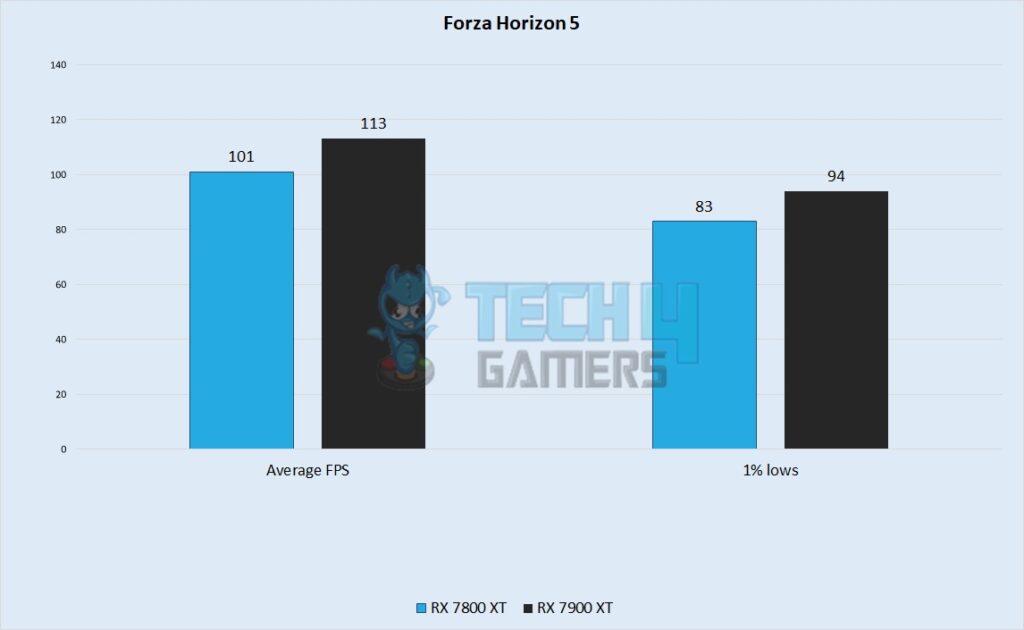
- The RX 7900 XT had an average framerate of 113 FPS, whereas the RX 7800 XT still managed a rather fluid 101 FPS average.
- The RX 7800 XT showed us 1% lows of around 83 FPS, whereas the RX 7900 XT dropped its framerate to 94 FPS occasionally.
Marvel’s Spider-Man Remastered
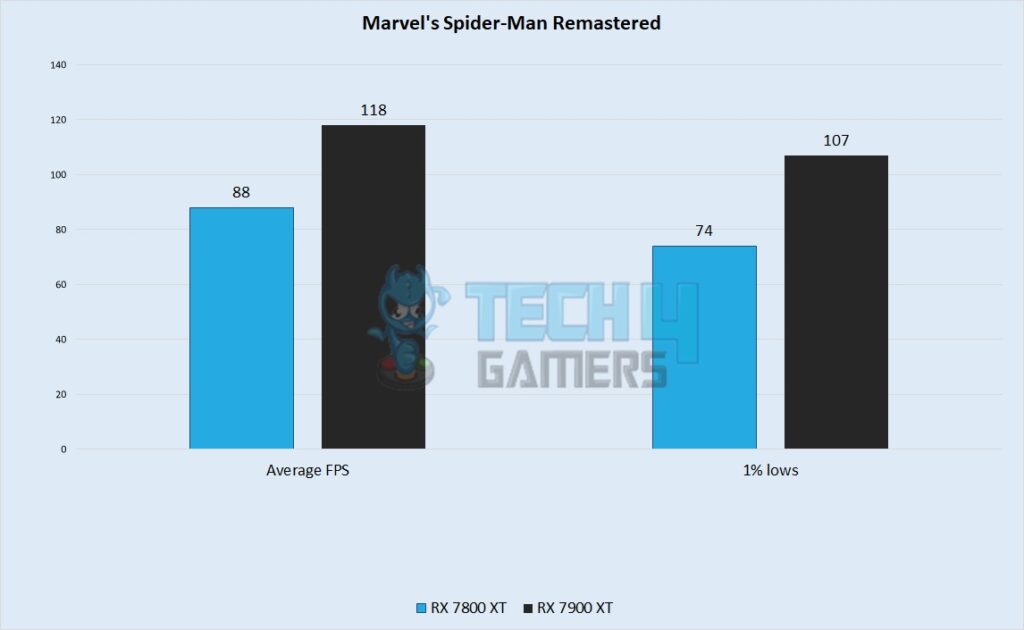
- Here, the RX 7800 XT ran at a framerate of around 88 FPS on average, whereas the RX 7900 XT was much smoother with an astonishing 118 FPS average.
- The 7800 XT showed us lows of around 74 FPS, whereas the RX 7900 XT remained above a hundred frames at all times with lows of around 107 FPS.
The Last Of Us
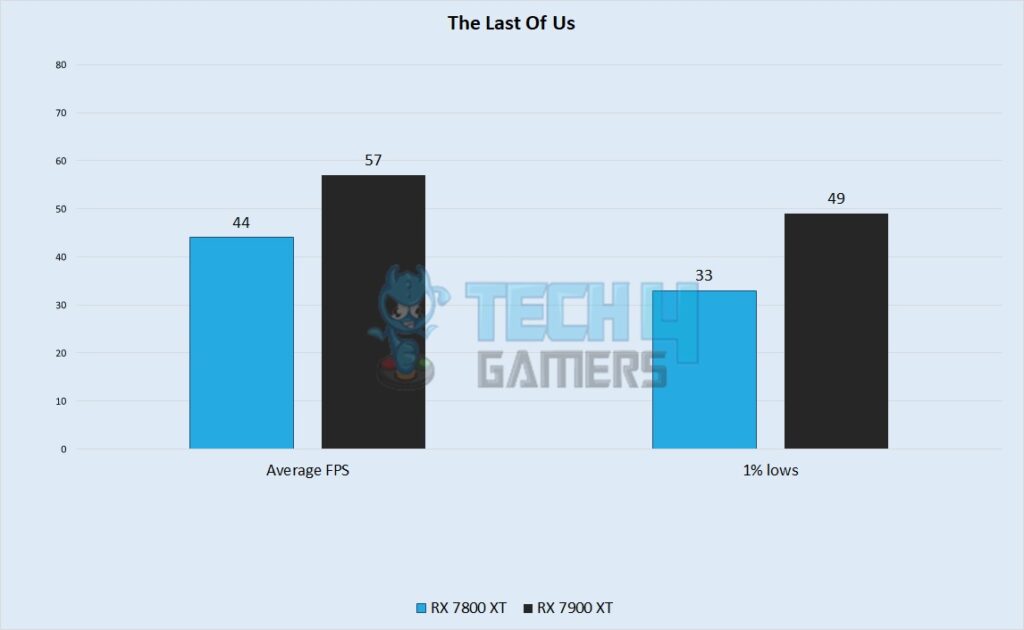
- In this game, we saw that the RX 7800 XT ran at an average of around 44 FPS, whereas the RX 7900 XT was more playable, showing us around 57 FPS.
- To our surprise, 1% lows dipped quite far below the averages of these cards, with the RX 7800 XT reaching 33 FPS. Whereas the 7900 XT faired better at lows of 49 FPS.
Fortnite
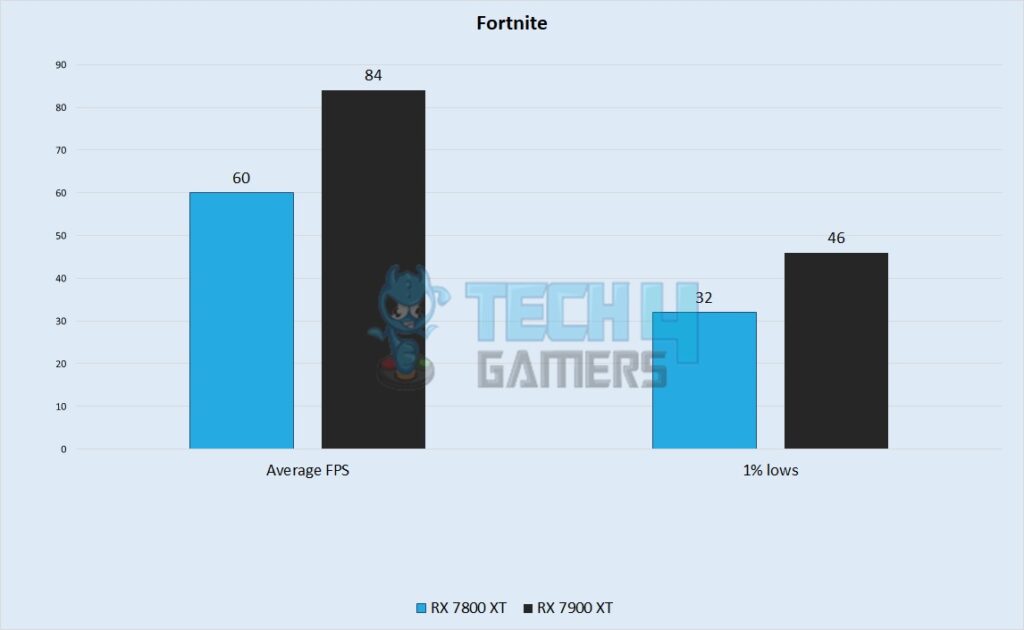
- Using the DX11 API, Fortnite ran on the barely reached 60 FPS using the Epic settings. In contrast, the RX 7900 XT was much smoother and showed us an average of 84 FPS.
- Though well-optimized, Fortnite has always had a stuttering problem. Here, the 7900 XT dropped its performance to 46 FPS, whereas the 7800 XT went down to 32 FPS.
Overall Gaming Performance
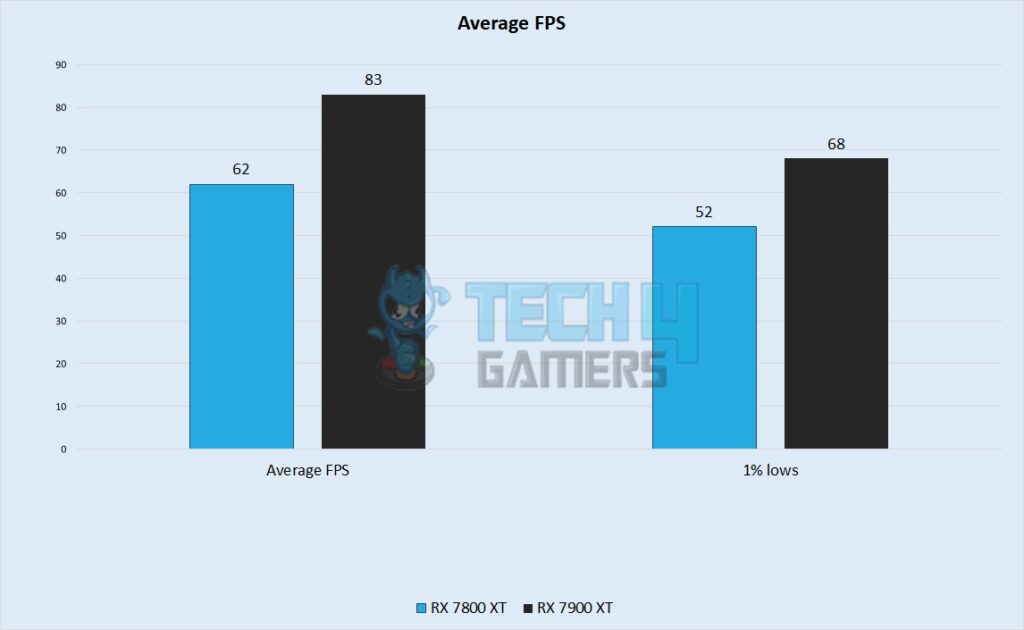
According to our calculations at 4K, the RX 7800 XT gave us an average framerate of 62 FPS, whereas its 1% lows dipped to around 52 FPS. The 7900 XT, however, showed us a much smoother side than its little brother. It averaged a framerate of around 83 FPS, whereas its lows were around 68 FPS.
Power Consumption
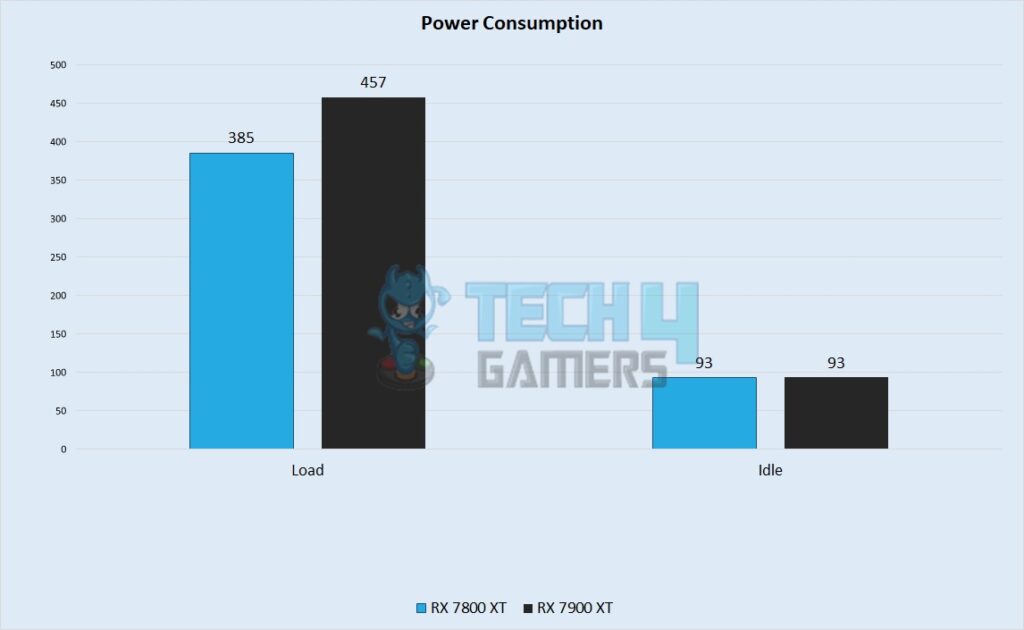
We saw the 7900 XT consume 457 watts under load, whereas it was cruising at around 93 watts when idle. In contrast, the 7800 XT came in around 70 watts less than its big brother, with a load power consumption of around 385 watts, while the idle power consumption stood unchanged at 93 watts.
Price And Availability
The RX 7900 XT comes in at a current price of around $760-$950, whereas the 7800 XT massively undercuts it at a price range of $510-$580. Both of these cards are widely available around the world and can be had from any computer parts retailer or online sites.
RX 7900 XT Vs RX 7800 XT: Which One Do I Recommend?
RX 7900 XT: If you wish to obtain a GPU with incredible performance without being bound by any budget, we recommend you get the RX 7900 XT. It is also a future-proof card that is designed to deliver high performance, especially at 4K.
RX 7800 XT: If you’re looking to get high performance along with relatively better power efficiency on a budget, we highly recommend you go for the RX 7800 XT. This card promises the ultimate gaming experience at 1440p.
Whichever GPU you choose to go with, ensure that it goes well with your preferences and requirements.
Pros And Cons
| GPU | Pros | Cons |
|---|---|---|
| RX 7900 XT | ✅ Better performance ✅ 4K gaming at the highest settings. | ❌ Higher power consumption. ❌ Higher price tag. |
| RX 7800 XT | ✅ Better bang for your buck. ✅ Lower power consumption | ❌ Lower performance. ❌ No major changes over its predecessor |
Frequently Asked Questions
AMD’s frame generation technology, dubbed Fluid Motion Frames, will be released at the start of 2024 at the earliest.
If you’re only concerned with the performance of your card, the RX 7800 XT gives around the same performance as its predecessor whilst being a few Jacksons more expensive.
The RX 7900 XT has 84 compute units, whilst the 7800 XT has around 60 compute units.
More From RX 7800 XT
More From RX 7900 XT
Thank you! Please share your positive feedback. 🔋
How could we improve this post? Please Help us. 😔
[Comparisons Specialist]
I’m a passionate computer hardware expert specializing in CPUs and GPUs. With a lifelong curiosity for hardware and extensive hands-on experience, I provide valuable insights, practical advice, and in-depth analysis on these components. Engaging with the hardware community, I exchange knowledge and stay at the forefront of technological advancements.
Get In Touch: uzair@tech4gamers.com