AMD Radeon RX 7800 XT
Rated: 8.5/10
AMD Radeon RX 7900 GRE
Rated: 8.3/10
Pros And Cons
| GPU | Pros | Cons |
|---|---|---|
| RX 7900 GRE | ✔️ Enhanced Ray tracing acceleration. ✔️ A higher clock speed. | ❌ Higher power consumption. ❌ Higher price point. |
| RX 7800 XT | ✔️ Affordable price. ✔️ Multiple display outputs. | ❌ Slightly lower clock frequencies. ❌ Smaller VRAM. |
- In my experience, the RX 7900 GRE takes the lead by an astounding 3.6% increase in average frame rates compared to the RX 7800 XT.
- The RX 7900 GRE outperforms the RX 7800 XT by an astonishing 5.5% when at rest and a 3.1% while it’s under load.
- I’ve noticed that the RX 7800 XT operates at exceptionally cooler temperatures and is 9.7% more thermally efficient than the RX 7900 GRE.
- I recommend the RX 7800 XT for its better value and the RX 7900 GRE is best suited for users who prefer a little edge in performance and who can source this card.
Comparison Table
| Specs | RX 7900 GRE | RX 7800 XT |
|---|---|---|
| Architecture | RDNA 3.0 | RDNA 3.0 |
| RT Cores | 80 | 60 |
| CUDA Cores | 5120 | 3840 |
| Release Date | July 27th, 2023 | Aug 25th, 2023 |
| Approximated Price | $649 | $510-$550 |
| Best CPU | – | Best RX 7800 XT |
Architectural Differences
- Process Size: Both cards employ the innovative 5nm manufacturing process size.
- Clock Speed: With a base clock of 1500 MHz, the RX 7900 GRE can be ramped up to 2245 MHz. In contrast, the RX 7800 XT consists of a base frequency of 1295 MHz that can be accelerated up to 2124 MHz.
- VRAM: The huge 16GB GDDR6 memory capacity of the RX 7900 GRE and RX 7800 XT significantly boosts gaming performance and guarantees a fluid gaming experience.
- Bus Width & Memory Bandwidth: While both the cards boast a 256-bit memory bus width, they consist of 576.0 GB/s and 620.8 GB/s of memory bandwidth respectively.
- TDP: Both the GPUs have similar TDP ratings, where the RX 7800 XT has a TDP of 263W, while the RX 7900 GRE has a 260W TDP rating.
Two of 2023’s latest offerings are the RX 7800 XT vs RX 7900 GRE. Despite being launched in the same year, both of these cards belong to different families. Their differences are very widespread, which I’ll be gradually discussing throughout this comparison.
RX 7800 XT Vs RX 7900 GRE: Benchmarks At 1440p
Now, it is high time we introduce you to their benchmark results played at 1440p so you judge the performance of these cards with ease.
Testing Rig
- CPU: Ryzen 7 7800X3D
- Memory: G Skill Z Trident DDR5 – 6000MHz
- Storage Drive: XPG Gammix S70 Blade 2TB NVMe
- Power Supply: be quiet! Dark Power Pro 13 1300W
- CPU Cooler: Corsair ICUE H150I Elite
A Plague Tale: Requiem
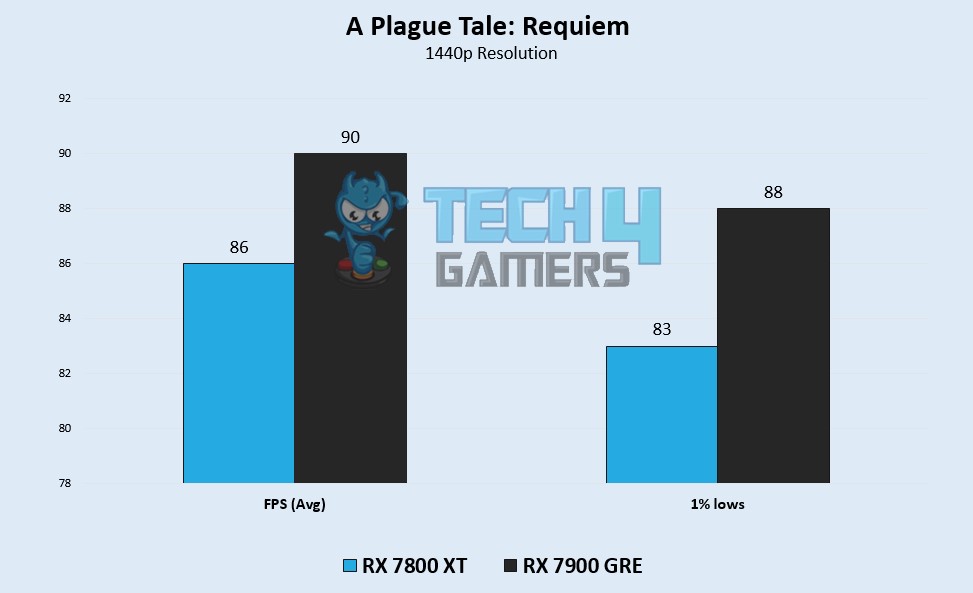
- With a fantastic average FPS of 90 FPS achieved by the RX 7900 GRE, the RX 7800 XT showed slightly constrained performance, which only reached 86 FPS.
- A 1% low FPS of 88 FPS is continually maintained by the RX 7900 GRE. Whereas, the RX 7800 XT lagged slightly behind, showcasing 83 FPS.
Resident Evil 4
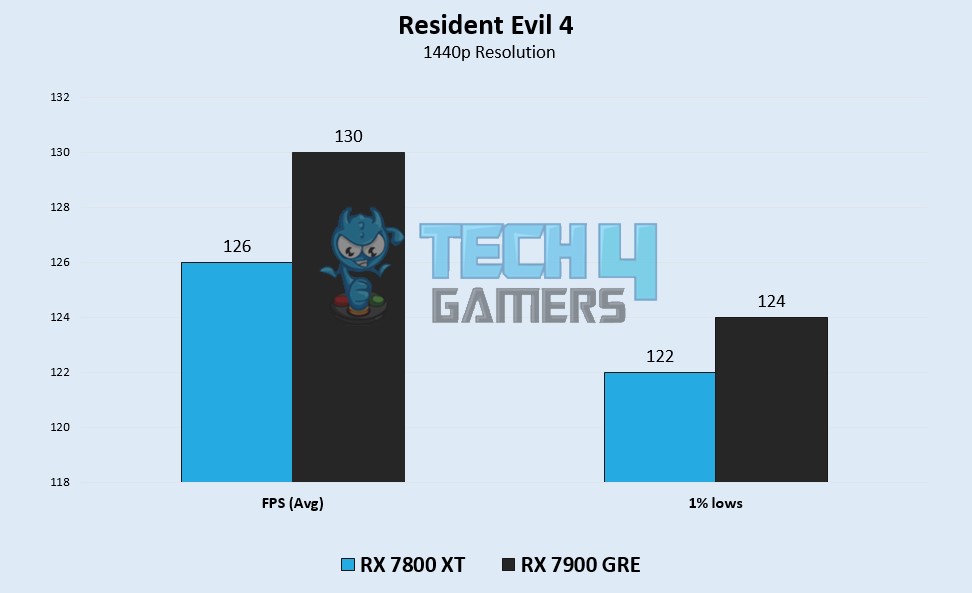
- After my careful examination, I’ve noticed that the RX 7900 GRE gained an average of 130 FPS. Whereas, the RX 7800 XT performs a little underwhelming, averaging 126 FPS.
- The RX 7900 GRE showed impressive consistency, holding a 1% low of 124 FPS while the RX 7800 XT displayed 122 FPS.
Cyberpunk 2077

- On Cyberpunk 2077, you can see the slightest difference in the average FPS where the RX 7900 GRE obtained 93 FPS over RX 7800 XT’s 92 FPS.
- As for the 1% lows, the RX 7900 GRE displayed a 1% low of 88 FPS as opposed to the RX 7800 XT getting 87 FPS.
Hogwarts Legacy
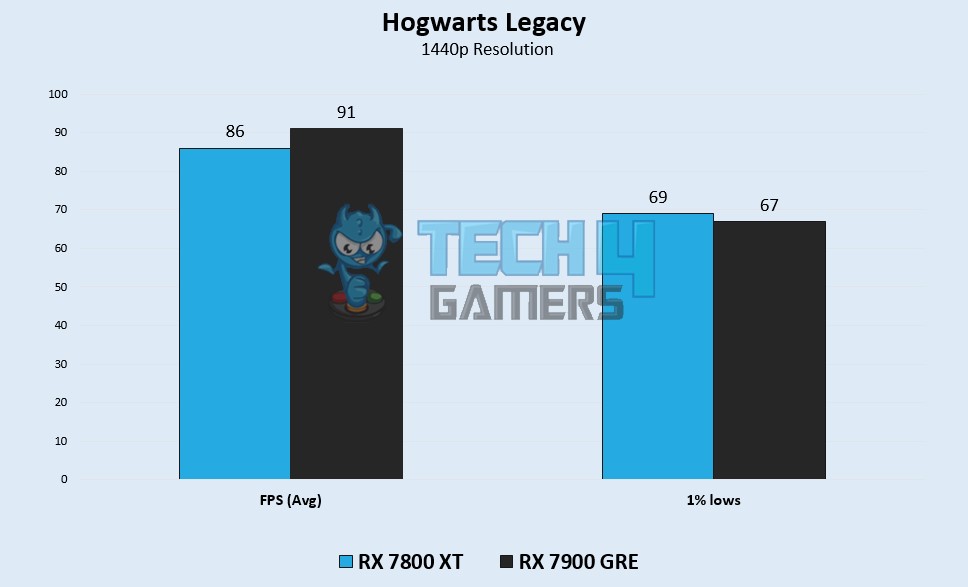
- In this game, the RX 7900 GRE outperforms the RX 7800 XT, with an astounding average of 91 FPS as opposed to the RX 7800 XT’s slightly restrained 86 FPS.
- The RX 7800 XT showed an average 1% low of 69 FPS. While, the RX 7900 GRE, hit a 1% low of 67 FPS.
The Last Of Us Part 1
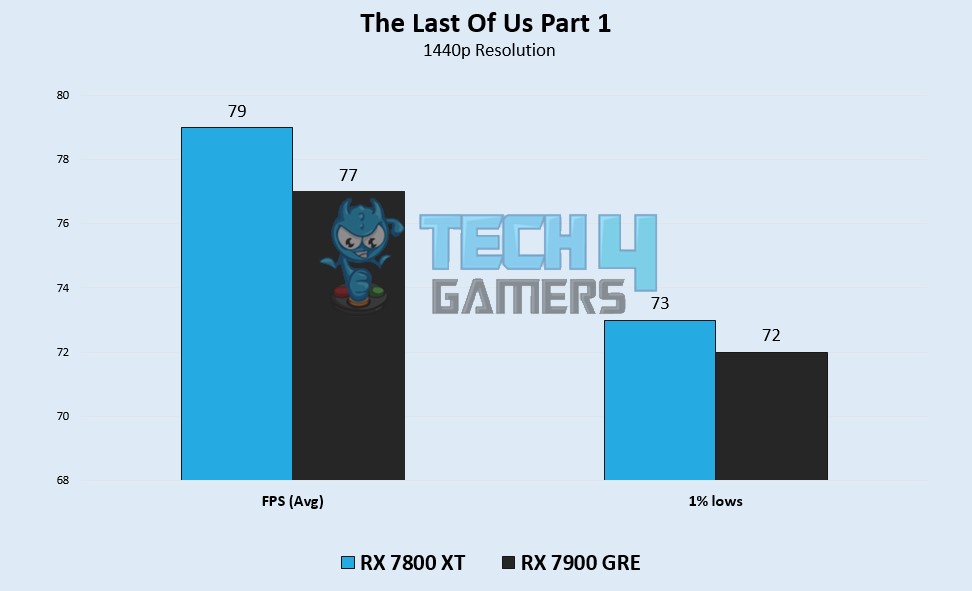
- In The Last of Us Part 1, the RX 7800 XT took the lead with a superb average FPS of 79, overshadowing the RX 7900 GRE’s somewhat lower performance at 77 FPS.
- As for the 1% lows, the RX 7800 XT obtained 73 FPS. In contrast, the RX 7900 GRE showed extremely close results, with the 1% low reaching 72 FPS.
Marvel’s Spider-Man Remastered
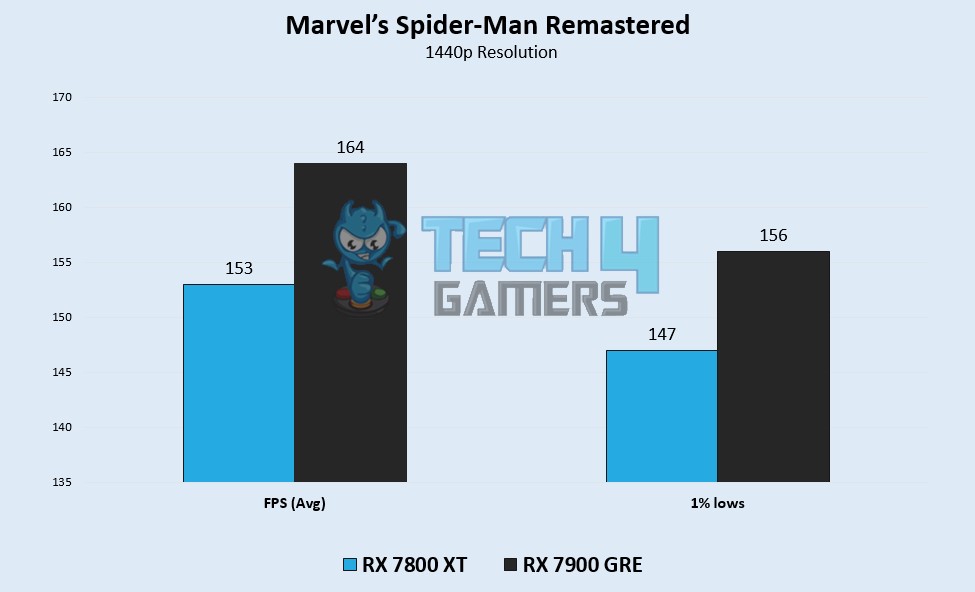
- Finally, the RX 7900 GRE achieved an astonishing average of 164 FPS over the RX 7800 XT’s 153 FPS, displaying a difference of almost 10 FPS.
- Regarding 1% lows, the RX 7900 GRE showed its excellence by obtaining 156 FPS. In contrast, the RX 7800 XT registers at an average of 147 FPS.
Overall Gaming Performance
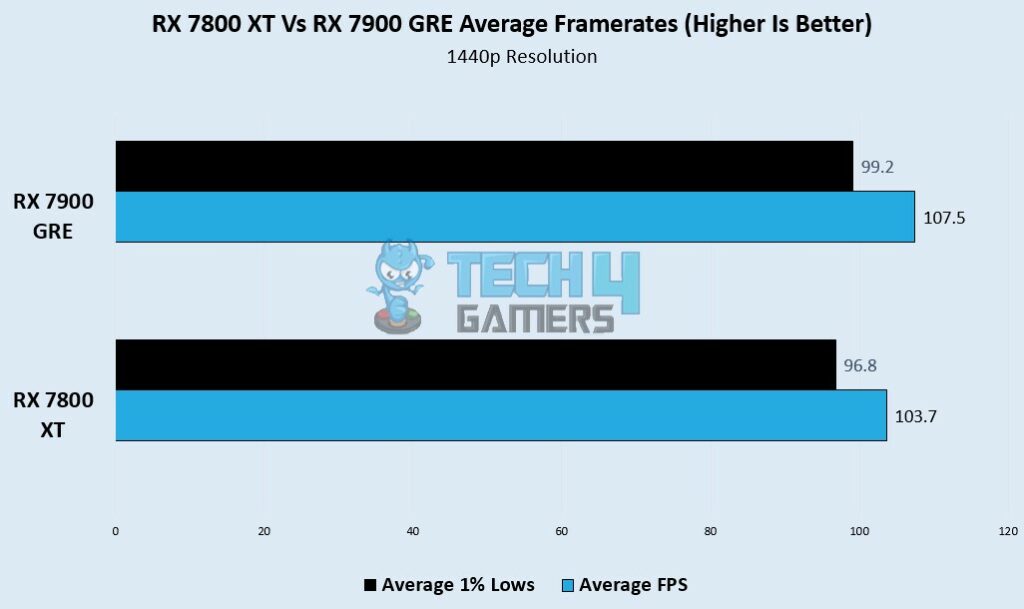
The RX 7900 GRE obtains an average of 107.5 FPS, representing a significant 3.6% increase over the RX 7800 XT’s average of 103.7 FPS. In terms of 1% lows, the RX 7900 GRE achieves an average of 99.2 FPS over 96.8 FPS obtained by the RX 7800 XT.
Thermal Statistics
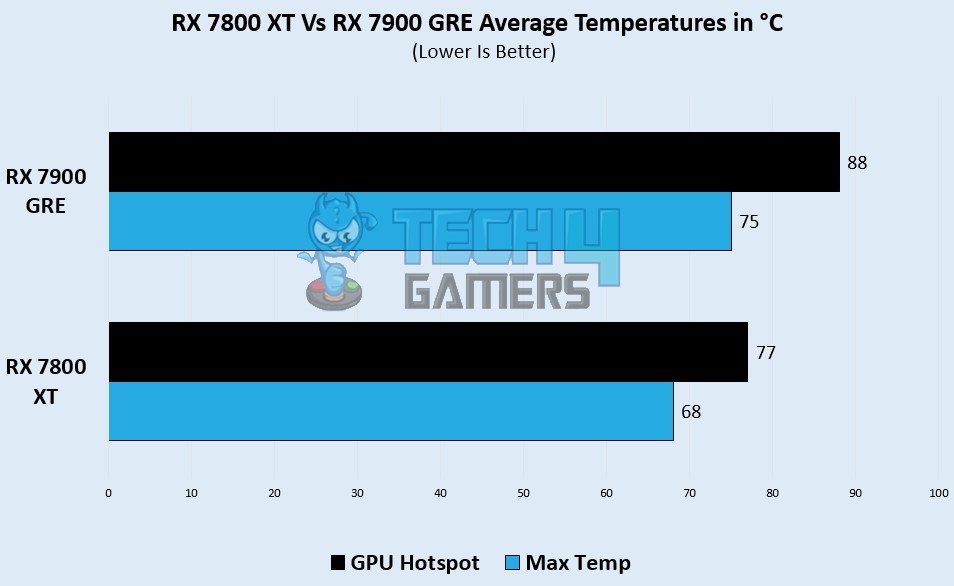
The RX 7800 XT can handle a maximum temperature of 68°C, while the RX 7900 GRE reaches slightly higher temperatures of 75°C. While the RX 7900 GRE runs slightly hotter by reaching a maximum GPU hotspot temperature of 88°C over RX 7800 XT’s 77°C.
Power Consumption
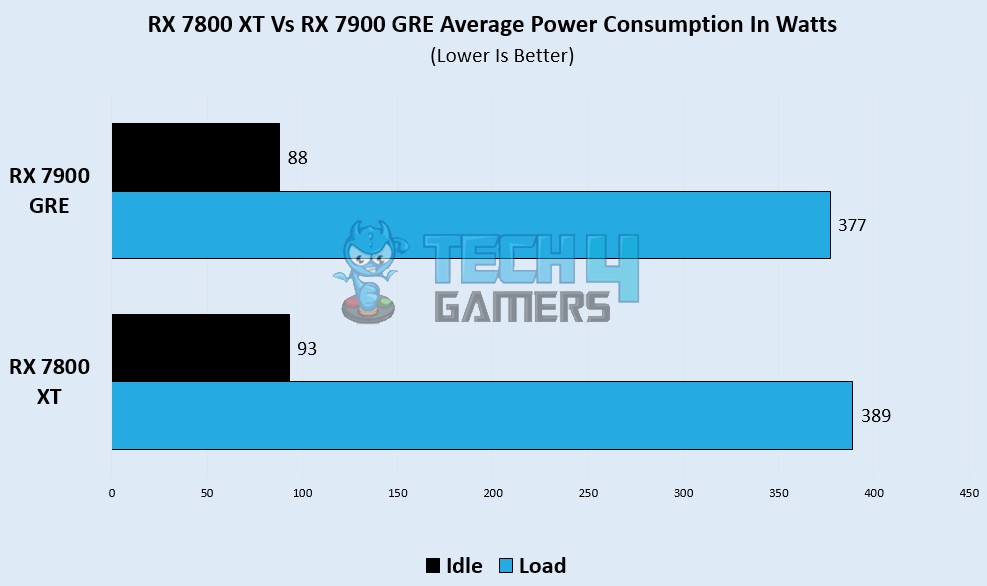
Under load, the RX 7900 GRE consumes 377W energy at its peak, whereas the RX 7800 XT’s peak was recorded at 389W. At idle, the RX 7800 XT comes in at a meager 93W whereas, the RX 7900 GRE exhibits even better efficiency with an 88W power draw.
Pricing And Availability
The RX 7900 GRE comes with a price tag of $649. However, it serves as a rare commodity due to its extremely low availability. In contrast, with a price range of $510-$550, the RX 7800 XT acts as a relatively cheaper option and it is more available than the RX 7900 GRE.
Conclusion – Which One Would We Recommend?
RX 7900 GRE: The RX 7900 GRE was only limited to China when it first came out. However, it has started entering the European market and will shortly spread across Europe, which would expand its availability. We recommend you get this card if you can acquire it or source it.
RX 7800 XT: Due to the RX 7900 GRE’s extremely low availability, I advise you to get the RX 7800 XT. Moreover, RX 7800 XT’s cheap launch pricing, better thermal efficiency, and lesser difference in FPS make it valuable to those looking for high-end gaming experiences on a tight budget.
Whichever decision you choose to go for regarding the RX 7800 XT Vs RX 7900 GRE, ensure that it matches your preferences, location, and budget so you benefit from the decision in the long run.
Frequently Asked Questions
Both GPUs are DirectX 12 Ultimate compliant, guaranteeing compatibility with current and prospective games. Although compatibility concerns are uncommon, verifying the prerequisites for each game before buying is usually a good idea.
Depending on your priorities, maybe. The higher power drain of the RX 7900 GRE can be justified if you prioritize pure gaming performance. The RX 7800 XT, however, would be a better option if you’re worried about power efficiency and have a restricted power source.
Both GPUs can run games at 4K resolution on high settings. However, the RX 7900 GRE could perform a little bit better in this case.
Regular driver updates that might improve performance in different games are applied to both AMD GPUs. For the best gaming experience, it’s essential to keep your GPU drivers updated.
More From RX 7800 XT
More From RX 7900 GRE
Thank you! Please share your positive feedback. 🔋
How could we improve this post? Please Help us. 😔
[Comparisons Specialist]
I’m a passionate computer hardware expert specializing in CPUs and GPUs. With a lifelong curiosity for hardware and extensive hands-on experience, I provide valuable insights, practical advice, and in-depth analysis on these components. Engaging with the hardware community, I exchange knowledge and stay at the forefront of technological advancements.
Get In Touch: uzair@tech4gamers.com