


AMD Radeon RX 7900 GRE
Rated: 7.5/10
AMD Radeon RX 6950 XT
Rated: 8/10
Pros & Cons
| GPU | Pros | Cons |
|---|---|---|
| RX 7900 GRE | ✅ Great price-to-performance ratio. ✅ Better thermal & power efficiency. | ❌ Higher price. ❌ Availability limited to China & Europe. |
| RX 6950 XT | ✅ High 1080p performance. ✅ Widely available. | ❌ Not the best for 4K gaming. |
- Despite its slight advantage, the RX 6950 XT edges out the RX 7900 GRE by 7.5% in FPS performance, suggesting competitive gaming capabilities.
- The RX 7900 GRE distinguishes itself by consuming 16.4% less power than the RX 6950 XT, contributing to energy savings and efficiency.
- As for thermal management, the RX 7900 GRE maintains a 2.7% lead over the RX 6950 XT, ensuring a cooler operating temperature for improved longevity and performance.
- We recommend you get the RX 6950 XT if you prioritise high gaming performance at 1080p and we recommend the RX 7900 GRE if you acquire it.
Comparison Table
| Specifications | Radeon RX 7900 GRE | Radeon RX 6950 XT |
|---|---|---|
| Architecture | RDNA 3.0 | RDNA 2.0 |
| Shading Units | 5120 | 5120 |
| Tensor Cores | NA | NA |
| RT Cores | 80 | 46 |
| TMUs | 320 | 320 |
| ROPs | 192 | 128 |
| L1 Cache | 256 KB per Array | 128 KB (per SM) |
| L2 Cache | 6 MB | 4 MB |
| Bus Width | 256 bit | 256 bit |
| Suggested PSU | 600W | 700W |
| Release Date | Jul 27th, 2023 | May 10th, 2022 |
Architectural Differences
- Process Node: The RX 7900 GRE boasts a cutting-edge 5nm process node, surpassing the RX 6950 XT’s 7nm process node for enhanced efficiency and performance.
- Clock Speed: Embracing dynamic clocking, the RX 7900 GRE exhibits a base clock of 1500 MHz and a boost clock of 2245 MHz, differing from the RX 6950 XT’s base and boost clocks of 1860 MHz and 2310 MHz.
- VRAM & Memory Bandwidth: Both the GPUs are equipped with a substantial 16GB GDDR6 VRAM and a 576.0 GB/s of memory bandwidth.
- TDP: Moving on to power efficiency, while the RX 7900 GRE maintains a responsible 260W TDP, the RX 6950 XT carries a slightly higher 335W TDP.
- Supported Technologies: Summing it all up, the RX 7900 GRE and RX 6950 XT share the advantage of FSR technology, enhancing gaming visuals and performance across the board.
The RX 7900 GRE vs RX 6950 XT are powerful graphics cards that have been making waves in the gaming world. Join us as we unravel the intricacies of these GPUs and uncover the performance they bring to the table.
RX 7900 GRE Vs RX 6950 XT: Gaming Benchmarks
As we delve into the world of gaming benchmarks, we’re all set to witness a head-to-head showdown between these cards. Our exploration will take us through a diverse range of games, and evaluate the performance of these GPUs in terms of FPS and their 1% lows, both of which are crucial for testing GPUs.
Testing Rig
- CPU: Intel Core i9-13900K
- GPU 1: Power Color RX 7900 GRE 16GB
- GPU 2: ASUS ROG Strix RX 6950XT 16GB
- Motherboard: Asus ROG Strix Z790 E Gaming
- Memory: XPG Lancer RGB 32B 6000MHz DDR5 RAM
- SSD: XPG GAMMIX S70 BLADE 2TB NVMe
- Power Supply: be quiet! Dark Power Pro 13 1300W
- CPU Cooler: Corsair ICUE H150I ELITE
Far Cry 6
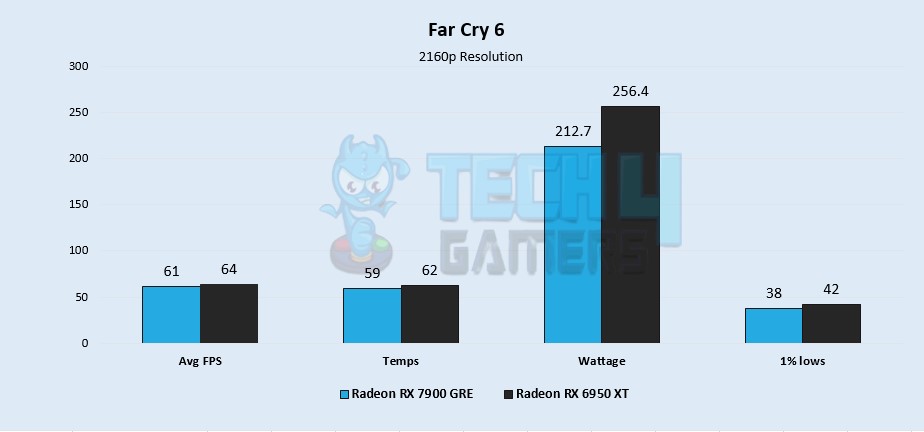
- The RX 6950 XT maintains a 4.8% lead with an average FPS of 64, outperforming the RX 7900 GRE, which achieves 61 FPS, showcasing a discernible performance gap.
- The RX 6950 XT demonstrates a notable 10% advantage in 1% low performance with 42 FPS, surpassing the RX 7900 GRE’s performance of 38 FPS.
Cyberpunk 2077
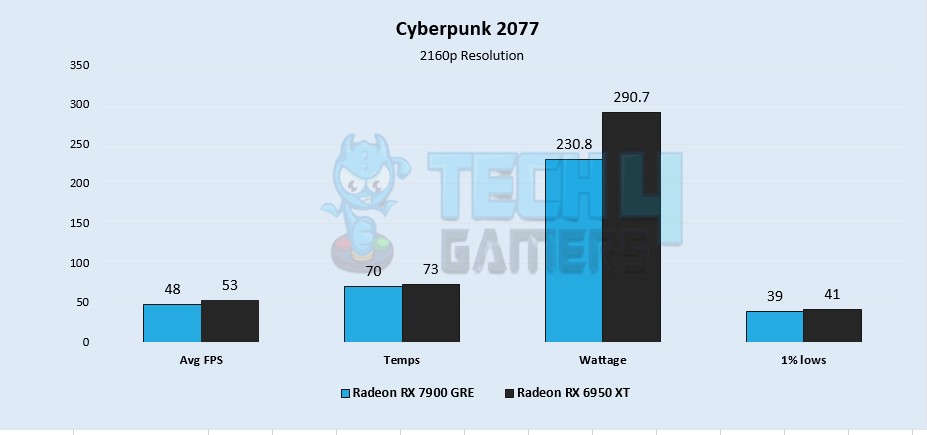
- Demonstrating a 9.9% advantage, the RX 6950 XT achieves an average FPS of 53, overshadowing the performance of the RX 7900 GRE at 48 FPS, emphasizing the distinctions between these GPUs.
- With a slight 5% lead, the RX 6950 XT achieves a 1% low of 41 FPS, outshining the RX 7900 GRE’s performance of 39 FPS.
Marvel Spiderman Remastered
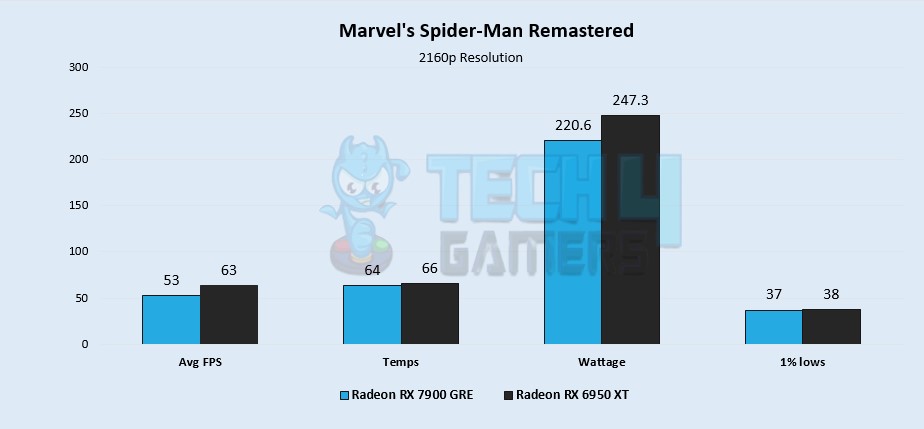
- With an average FPS of 63, we see that the RX 6950 XT takes the lead by 17.2% compared to the RX 7900 GRE’s performance of 53 FPS, highlighting the evident performance difference between the two GPUs.
- In addition, the RX 6950 XT maintains a marginal 2.6% advantage in 1% low performance, achieving 38 FPS compared to the RX 7900 GRE’s 37 FPS.
Hitman III
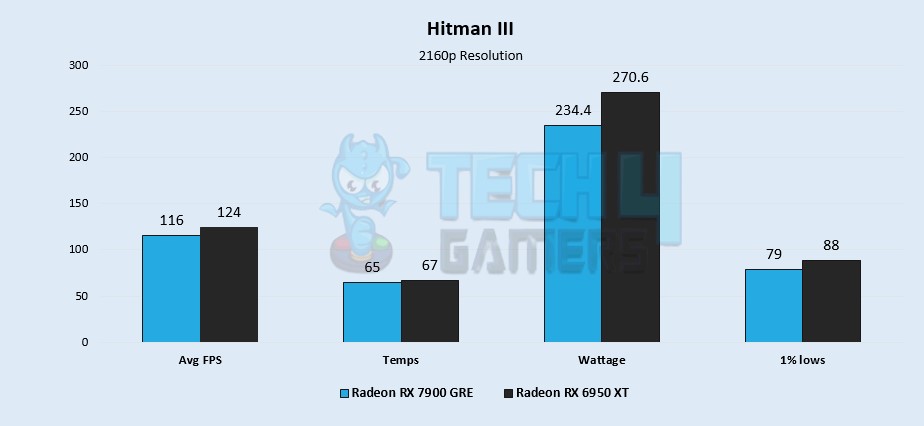
- In terms of average FPS, the RX 6950 XT leads by 6.6% with a performance of 124, surpassing the RX 7900 GRE’s performance of 116 FPS, signifying a notable distinction in performance.
- In 1% low performance, the RX 6950 XT excels with a remarkable 10.7% lead, achieving 88 FPS, while the RX 7900 GRE trails at 79 FPS.
Horizon Zero Dawn
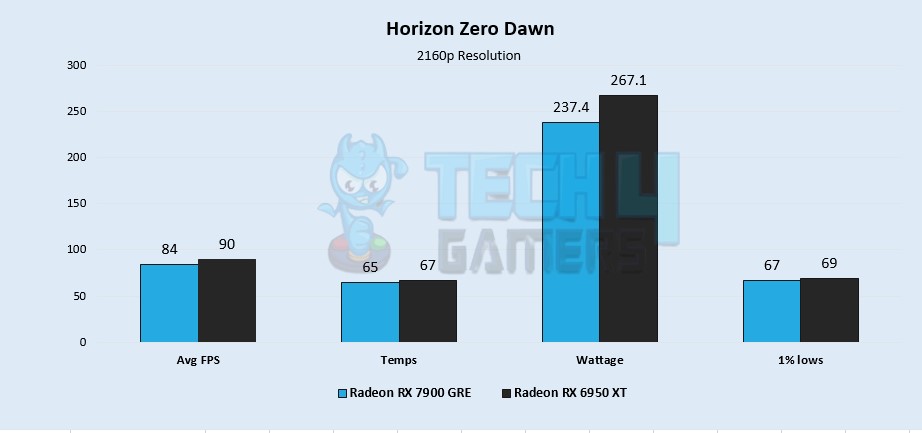
- Outperforming the RX 7900 GRE, we notice that the RX 6950 XT secures a lead of 6.8% with an average FPS of 90, compared to the RX 7900 GRE’s performance of 84 FPS.
- Demonstrating its strength, the RX 6950 XT achieves a 1% low of 69 FPS, showcasing a 2.9% advantage over the RX 7900 GRE’s 67 FPS.
God Of War
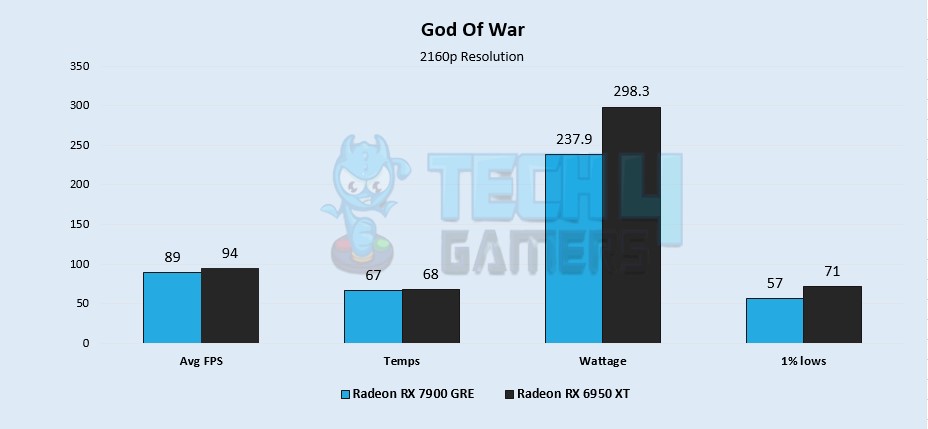
- We observe that the RX 6950 XT demonstrates a 5.4% lead with an average FPS of 94, outshining the RX 7900 GRE’s performance of 89 FPS, indicating a noteworthy margin.
- In addition, the RX 6950 XT establishes a significant 21.8% lead in 1% low performance, achieving 71 FPS, while the RX 7900 GRE achieves 57 FPS.
Forza Horizon 5
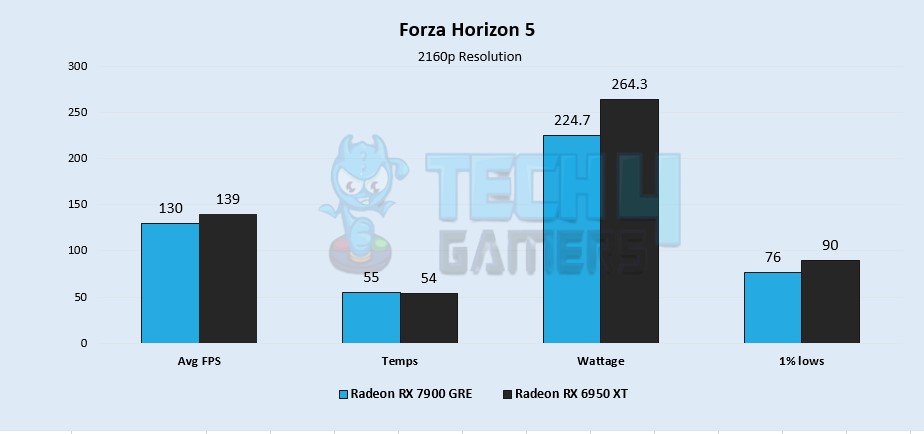
- With an average FPS of 139, the RX 6950 XT establishes a 6.6% lead over the RX 7900 GRE, which achieves 130 FPS, marking a significant difference in gaming performance.
- Commanding the lead, the RX 6950 XT boasts a 1% low of 90 FPS, surpassing the RX 7900 GRE’s performance of 76 FPS by 16.8%.
Assasin’s Creed Valhalla
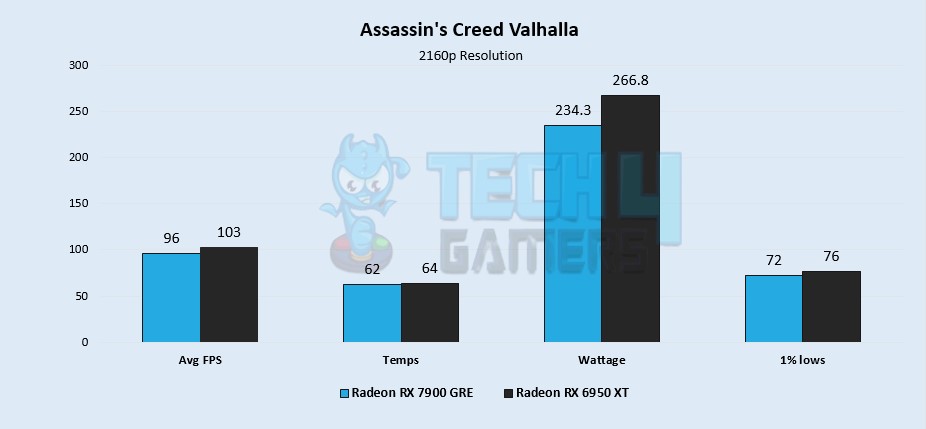
- Here, we notice the RX 6950 XT boasts a 7% lead with a performance of 103, compared to the RX 7900 GRE’s performance of 96 FPS, underscoring a noticeable performance difference.
- Moreover, the RX 6950 XT maintains a 5.4% advantage in 1% low performance, achieving 76 FPS, while the RX 7900 GRE achieves 72 FPS.
RX 6950 XT Vs RX 7900 GRE: Overall Gaming Performance
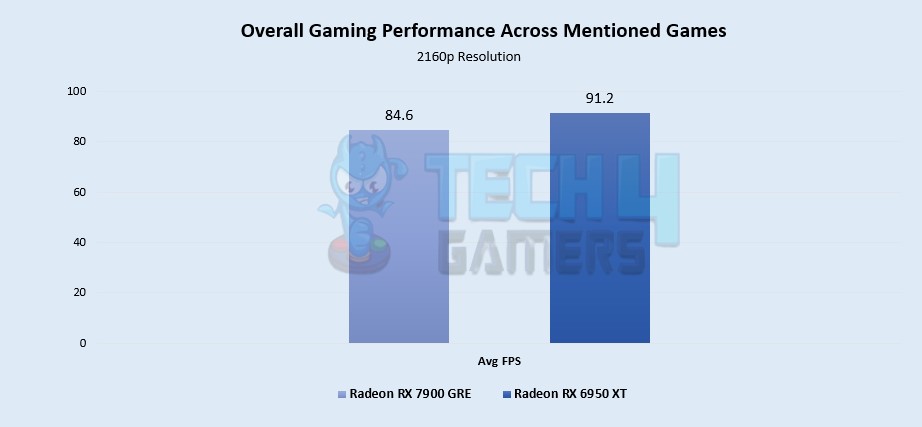
The RX 6950 XT establishes its superiority with a superior average FPS of 91.2, outpacing the RX 7900 GRE’s average FPS of 84.6. Emerging as the frontrunner, the RX 6950 XT boasts a 7.5% advantage over the RX 7900 GRE in terms of FPS, highlighting its gaming performance.
Power Consumption
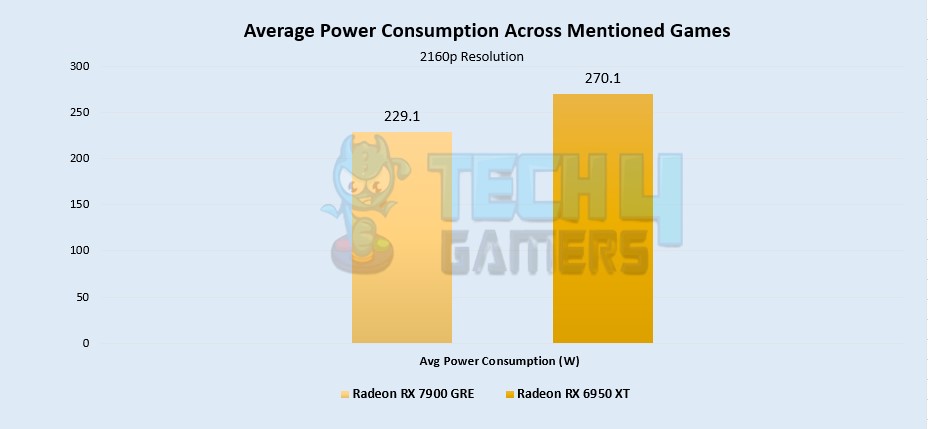
The RX 7900 GRE firmly asserts its supremacy over the RX 6950 XT, consuming 270.1W of power, while the RX 7900 GRE demonstrates greater efficiency with a consumption of 229.1W. With a substantial 16.4% advantage in power efficiency, the RX 7900 GRE takes the lead in surpassing the RX 6950 XT in terms of energy optimization.
Thermal Statistics
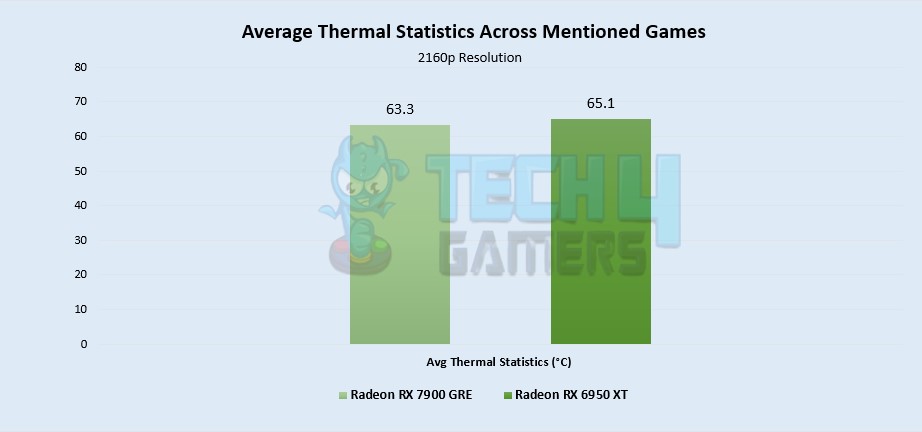
The RX 7900 GRE maintains an average temperature of 63.3°C, providing better cooling compared to the RX 6950 XT’s average temperature of 65.1°C. Establishing a noteworthy standard, the RX 7900 GRE demonstrates a commendable 2.7% enhancement in thermal efficiency, underscoring its advantage over the RX 6950 XT.
Pricing And Value
| GPU | MSRP | Current Price |
|---|---|---|
| RX 7900 GRE | 💲649 | 💲619 |
| RX 6950 XT | 💲1099 | 💲874 |
| Price Difference | 51.4% | 34.1% |
We already see a huge difference in the launch prices of both graphic cards, with around 51.4% to be precise. In terms of their current price tag, the RX 7900 GRE is now 4.7% cheaper than its release price. Whereas, the RX 6950 XT’s price has been reduced by 22.8%. Still, the RX 7900 GRE is 34.1% cheaper than the RX 6950 XT.
Conclusion – Which One Would We Recommend?
RX 6950 XT: The RX 6950 XT poses as a more powerful card that will grant you excellent performance at 1080p and decent performance at 1440p. , we still recommend you go for the RX 6950 XT since it is available around the world over the internet and in physical stores as well.
RX 7900 GRE: This GPU has it all: a better price point, lower power draw, and high thermal efficiency. However, RX 7900 GRE has limited availability which makes it harder to get for most users. If you can get your hands on the RX 7900 GRE, we recommend you get it instantly because it offers decent performance at a reasonable price point.
Both GPUs are excellent on their own. However, it all boils down to where you live and what your budget and preferences are.
More From RX 7900 GRE
More From RX 6950 XT
Thank you! Please share your positive feedback. 🔋
How could we improve this post? Please Help us. 😔
[Comparisons Expert]
Shehryar Khan, a seasoned PC hardware expert, brings over five years of extensive experience and a deep passion for the world of technology. With a love for building PCs and a genuine enthusiasm for exploring the latest advancements in components, his expertise shines through his work and dedication towards this field. Currently, Shehryar is rocking a custom loop setup for his built.
Get In Touch: shehryar@tech4gamers.com


