 Threads
The Core i9-14900K represents the apex of Intel’s cutting-edge 14th-generation desktop processors, representing the epitome of computing excellence. In contrast, the Ryzen 9 7950X3D is the premium edition of AMD’s latest CPU generation. Today, we will thoroughly examine the Core i9-14900K vs Ryzen 9 7950X3D to discern the superior performance powerhouse.
Key Takeaways
- The Core i9-14900K employs Intel’s Raptor Lake Resume architecture and LGA1700 socket. While the Ryzen 9 7950X3D boasts AMD’s advanced Zen 4 architecture with an AM5 socket.
- In my tests, the Core i9-14900K is more capable than the Ryzen 9 7950X3D in productivity and gaming performance at 1080p.
- Considering my power usage results, the Ryzen 9 7950X3D is about 38% more power efficient in real gaming scenarios.
- The Core i9-14900K presents a more attractive option at $589 than the Ryzen 9 7950X3D, which costs $699.
Comparison Table
| Feature | Intel Core i9-14900K | AMD Ryzen 9 7950X3D |
|---|---|---|
| Codename | Raptor Lake | Raphael AM5 |
| No. of Cores | P-Cores: 8 E-Cores: 16 Total Cores: 24 | 16 |
| No. of Threads | 32 | 32 |
| Cores Technology | TSMC 10nm | TSMC 5nm FinFET |
| Base Frequency | 3.2 GHz | 4.2 GHz |
| Boost Frequency | Up to 6.0 GHz | Up to 5.7 GHz |
| Integrated Graphics | Intel UHD Graphics 770 | AMD Radeon Graphics |
| Graphics Max Frequency | Up to 1.65 GHz | Up to 2.20 GHz |
| Memory Type & Frequency | DDR5: Up to 5600 MT/s DDR4: Up to 3200 MT/s | DDR5: Up to 5200 MT/s |
| Cache | 36 MB Intel Smart Cache | 128MB AMD 3D V-Cache |
| Max. Operating Temperature | 100°C | 89°C |
| TDP | 125W - 253W | 120W |
| Launch Date | Q4'23 | Q1'23 |
| MSRP | $589 | $699 |
| Best Motherboards | Best Motherboards For i9-14900K | Best Motherboards For R9 7950X3D |
| Best CPU Coolers | Best CPU Coolers For i9-14900K | Best Coolers For Ryzen 9 7950X3D |
| Best RAM | Best RAM For Core i9-14900K | BEST RAM For Ryzen 9 7950X3D |
| Best GPU | BEST GPU For Core i9-14900K | BEST GPU For Ryzen 9 7950X3D |
Architectural Difference
- Architecture: The Core i9-14900K features Intel’s optimized hybrid Raptor Lake Resume architecture. In contrast, AMD offers its futuristic Zen 4 architecture with the Ryzen 9 7950X3D.
- CPU Socket: The Ryzen 9 7950X3D’s AM5 socket tops the Core i9-14900K’s FCLGA1700. An AM5 socket delivers a superior data rate and cooling performance with the help of its higher pin count of 1718.
- Clock Speed: Regarding clock speeds, the Ryzen 9 7950X3D boasts a notable 31.25% upsurge in its base clock, whereas the Core i9-14900K surpasses it with a 5.26% higher rate in boost clock performance.
- CPU Memory: Looking at memory specs, the Core i9-14900K provides 192GB DDR5 memory, while the Ryzen 9 7950X3D offers 128GB DDR5 memory. Moreover, the Core i9-14900K has about 7.7% greater memory speed.
- Integrated Graphics: Regarding the iGPU, both the processors feature two cored iGPUs. However, the AMD Radeon Graphics of the Ryzen 9 7950X3D deliver superior performance with their 33.3% higher clock.
Gaming Benchmarks
Now, let’s test the abilities of the Core i9-14900K vs Ryzen 9 7950X3D on various games, all at 1080p resolution, to explore their performance. For benchmarks, I subjected every game to the ultra settings for better insights.
Test Bench
- OS – Windows 11
- CPU Cooler – Cooler Master MasterLiquid Lite ML240L RGB
- Graphics Card – GIGABYTE RTX 4090 Gaming OC 24G
- SSD – XPG Gammix S70 Blade 2TB NVMe
- Power Supply – ENERMAX REVOLUTION D.F. X 1050W
- GPU –GIGABYTE RTX 4090 Gaming OC 24G
Assassin’s Creed Mirage
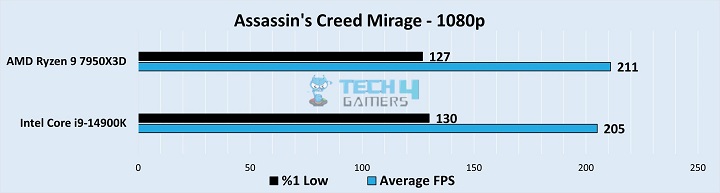
- Starting with the extremely CPU-intensive Assassin’s Creed Mirage, I got about 3.0% better performance with the Ryzen 9 7950X3D (211 FPS) than the Core i9-14900K (205 FPS).
- Regarding the low 1% performance, the Ryzen 9 7950X3D (127 FPS) lagged behind the Core i9-14900K (130 FPS).
Cyberpunk 2077
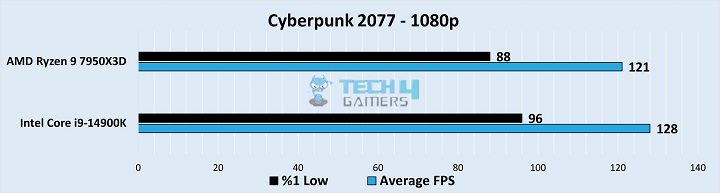
- In Cyberpunk 2077, the Core i9-14900K outperformed the Ryzen 9 7950X3D by approximately 5.8%, achieving 128 FPS on average compared to the latter’s 121 FPS.
- Coming to the low 1% performance metric, the Ryzen 9 7950X3D fell slightly short with a low 1% frame rate of 88 FPS, trailing behind the Core i9-14900K’s 96 FPS.
Forza Horizon 5
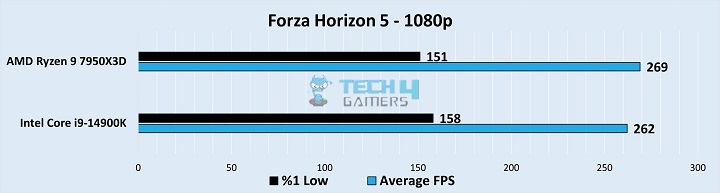
- In Forza Horizon 5, I observed that the Ryzen 9 7950X3D (269 FPS) exhibited approximately 2.7% superior performance than the Core i9-14900K (262 FPS).
- At the worst 1% performance, the Ryzen 9 7950X3D lagged slightly behind. It recorded a low 1% frame rate of 151 FPS, while the Core i9-14900K surpassed it with a score of 158 FPS.
Hitman 3
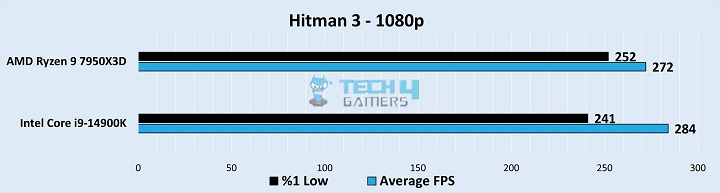
- In my encounter with Hitman 3, I noticed that the Core i9-14900K outperformed the Ryzen 9 7950X3D by approximately 4.4% with a frame rate of 284 FPS, compared to the latter’s 272 FPS.
- However, in the context of the low 1% performance, the Ryzen 9 7950X3D takes the lead, achieving 252 FPS at low 1%, while the Core i9-14900K scored only 241 FPS.
Hogwarts Legacy
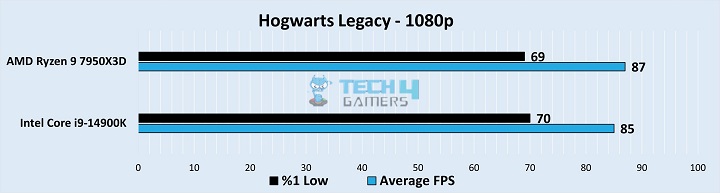
- When I played Hogwarts Legacy, I observed that the Core i9-14900K lagged behind the Ryzen 9 7950X3D by 2 FPS or roughly 2.4%, achieving an average of 85 FPS.
- Considering the low 1% performance, the Core i9-14900K takes the forefront, attaining 70 FPS at the 1% mark, while the Ryzen 9 7950X3D managed 69 FPS.
Microsoft Flight Simulator
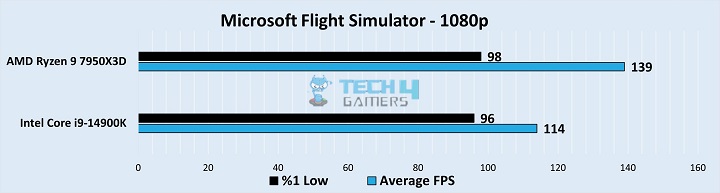
- While playing Microsoft Flight Simulator, I discerned that the Core i9-14900K exhibited a 25 FPS or approximately 22.0% deficit compared to the Ryzen 9 7950X3D’s brilliant 139 FPS average, achieving only 114 FPS.
- Regarding the low 1% frame rate, the Ryzen 9 7950X3D leads the way, securing 98 FPS, whereas the Core i9-14900K only achieved 96 FPS.
Remnant 2
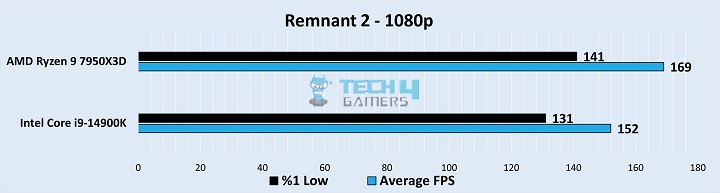
- In my Remnant 2 session, I noticed that the Core i9-14900K displayed an 11.2% shortfall in average frame rate, with 17 FPS less than the impressive 169 FPS average of the Ryzen 9 7950X3D, reaching a mere 152 FPS.
- During this gameplay, the Ryzen 9 7950X3D takes the lead in low 1% performance, boasting a solid 141 FPS, while the Core i9-14900K managed only 131 FPS.
Starfield
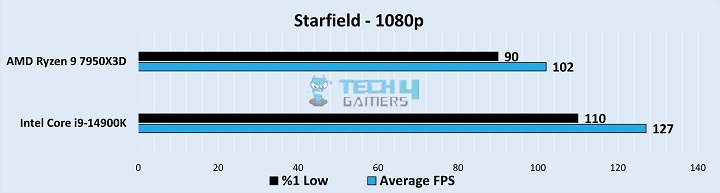
- I got a 24.5% better average performance when using the Core i9-14900K. It delivered a remarkable 127 FPS, while the Ryzen 9 7950X3D produced only 102 FPS on average.
- During Starfield, the Core i9-14900K excels in 1% low performance, delivering a robust 110 FPS, while the Ryzen 9 7950X3D only attains 90 FPS.
The Last of Us Part I
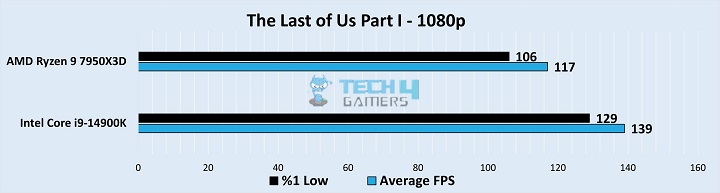
- While using the Core i9-14900K in The Last of Us Part I, I achieved an 18.8% performance benefit. It yielded an impressive average of 139 FPS, whereas the Ryzen 9 7950X3D managed only 117 FPS.
- During the gameplay, the Core i9-14900K excels in 1% low performance, delivering a substantial 129 FPS, while the Ryzen 9 7950X3D falls short at 106 FPS.
The Witcher 3: Wild Hunt
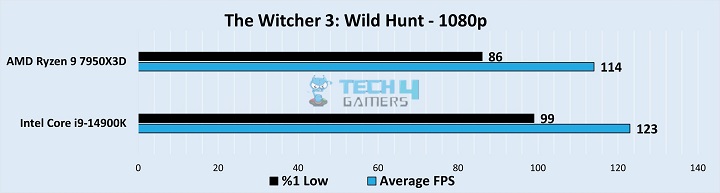
- When employing the Core i9-14900K, I garnered a noteworthy 7.9% performance enhancement, achieving an impressive 123 FPS on average. In contrast, the Ryzen 9 7950X3D mustered a mere 114 FPS.
- In The Witcher 3: Wild Hunt, the Ryzen 9 7950X3D could only manage 86 FPS, whereas the Core i9-14900K produced a solid 99 FPS in 1% low performance.
Overall Gaming Performance
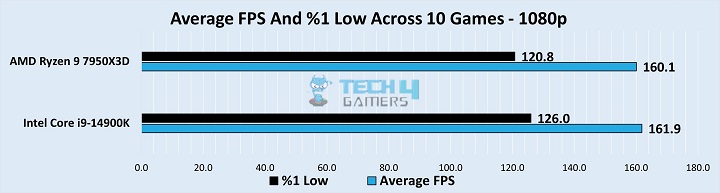
Average Frame Rate
The gaming performance battle of the Core i9-14900K vs Ryzen 9 7950X3D has been intense. Each CPU excels in different games, creating a seesaw of performance where one outshines the other.
Upon calculating the averages, I determined that the Core i9-14900K achieved an average of 161.9 FPS, slightly edging out the Ryzen 9 7950X3D, which achieved 160.1 FPS.
Thus, the Core i9-14900K has a slight 1.1% performance advantage over the Ryzen 9 7950X3D for 1080P gaming.
Low 1% Frame Rate
After analyzing the 1% low-performance metrics, the Core i9-14900K maintained an average of 126.0 FPS, surpassing the Ryzen 9 7950X3D, which scored 120.8 FPS.
So, the Core i9-14900K boasts a marginal 4.3% performance edge over the Ryzen 9 7950X3D at the worst 1% performance scenarios. Moreover, here is our benchmark video of some of the tests we conducted for this article.
Gaming Power Consumption
Reminder: Per the CPUs’ specs, the Core i9-14900K boasts a max TDP of 253 watts, whereas the Ryzen 9 7950X3D is rated at 120 watts, a whopping 110.8% difference.
| Game | Intel Core i9-14900K (watts) | AMD Ryzen 9 7950X3D (watts) |
|---|---|---|
| Assassin's Creed Mirage | 122 | 77 |
| Cyberpunk 2077 | 134 | 89 |
| Forza Horizon 5 | 87 | 74 |
| Hitman 3 | 91 | 73 |
| Hogwarts Legacy | 78 | 63 |
| Microsoft Flight Simulator | 69 | 70 |
| Remnant 2 | 86 | 73 |
| Starfield | 141 | 82 |
| The Last of Us Part I | 144 | 88 |
| The Witcher 3: Wild Hunt | 101 | 73 |
| Average Power Consumption | 105.3 | 76.2 |
During my gaming session, the Core i9-14900K ran at an average of 105.3 watts of power, while the Ryzen 9 7950X3D consumed an average of 76.2 watts.
The Core i9-14900K consumed less power while delivering performance equivalent to half the total games played. In essence, the Ryzen 9 7950X3D offers more performance per watt.
However, in terms of overall energy efficiency, the Ryzen 9 7950X3D outperforms the Core i9-14900K by a substantial 38.2%, thus saving electricity costs.
Must Read: Gaming PC Power Usage
Gaming Temperatures
| Game | Intel Core i9-14900K (°C) | AMD Ryzen 9 7950X3D (°C) |
|---|---|---|
| Assassin's Creed Mirage | 59 | 60 |
| Cyberpunk 2077 | 64 | 62 |
| Forza Horizon 5 | 54 | 57 |
| Hitman 3 | 54 | 56 |
| Hogwarts Legacy | 50 | 60 |
| Microsoft Flight Simulator | 51 | 57 |
| Remnant 2 | 51 | 54 |
| Starfield | 62 | 61 |
| The Last of Us Part I | 64 | 72 |
| The Witcher 3: Wild Hunt | 56 | 57 |
| Average Temperature | 56.5 | 59.6 |
Each processor demonstrates superior thermal performance in specific games, resulting in a dynamic balance where one beats the other.
In the aggregate, the Core i9-14900K maintained an average gaming temperature of 56.5°C, while the Ryzen 9 7950X3D registered an average of 59.6°C.
So, comparing the overall thermal efficiency, the Ryzen 9 7950X3D beats the Core i9-14900K with its 5.5% more promising temperature regulation. If you’re experiencing overheating problems, seek our expert guide on How To Lower GPU Temperature.

In my opinion both of these processors performed quite well which should be expected as they are the top variants from both Intel and AMD, but when it comes to numbers the Ryzen 9 7950X3D becomes the obvious recommendation as it provides nearly identical performance to the Core i9-14900K while saving more than 38.2% electricity costs and 5.5% better thermal performance.
– Abde Manaf
Price And Availability
Before I wrap up the comparison, let’s discuss the pricing and accessibility of both processors. Intel unveiled the Core i9-14900K, priced at $589, as its initial offering. On the flip side, AMD rolled out the Ryzen 9 7950X3D at a $699 price point in early 2023.
The Core i9-14900K is currently selling at its MSRP, while the Ryzen 9 7950X3D can be found for just $632. Regarding availability, both processors are widely available through official Intel and AMD stores and popular e-commerce platforms such as Amazon and Newegg.
Which One Would I Recommend?
Addressing the decision between the Core i9-14900K vs Ryzen 9 7950X3D, it ultimately comes down to your specific needs and priorities.
If you desire the best gaming performance, content creation, and value, I recommend the Intel Core i9-14900K. It has optimized architecture, offers superior gaming performance, and excels in creative workloads. Furthermore, it offers superior value in every aspect.
However, If you’re searching for a gaming processor that combines robust power efficiency, I recommend the AMD Ryzen 9 7950X3D. The Ryzen 9 7950X3D is 38.2% more energy-efficient and delivers more power performance-per-watt than the Core i9-14900K.
| Intel Core i9-14900K | Intel Core i9-14900K | AMD Ryzen 9 7950X3D | AMD Ryzen 9 7950X3D |
|---|---|---|---|
| Pros | Cons | Pros | Cons |
| Gaming Performance | Power Hungry | High power efficiency | Heat issues |
| Content creation | Minor generational upgrade | Gaming Performance | High pricing |
| Productivity performance | Integrated graphics | No compatibility for DDR4 | |
| 6.0 GHz boost clock | 16 full-power cores |
Pros And Cons
| Intel Core i9-14900K | Intel Core i9-14900K | AMD Ryzen 9 7950X3D | AMD Ryzen 9 7950X3D |
|---|---|---|---|
| Pros | Cons | Pros | Cons |
| Great Gaming Performance | Power Hungry | High power efficiency | Heat issues |
| Good for Content creation | Minor generational upgrade | Integrated graphics | No compatibility for DDR4 |
The Ryzen 9 7950X3D is more energy-efficient (saving electricity cost) and can offer better multi-core performance, advantageous for tasks like video editing and 3D rendering. Yes, the Core i9-14900K requires motherboards with an LGA1700 socket and supports Intel’s Z790 chipset. The AMD Radeon Graphics of the Ryzen 9 7950X3D is much better than the Intel UHD Graphics 770 of the Core i9-14900K. The AMD Radeon Graphics performs better thanks to a 33.3% faster frequency.Frequently Asked Questions
More From Ryzen 9 7950X3D
Thank you! Please share your positive feedback. 🔋
How could we improve this post? Please Help us. 😔
[Comparisons Expert]
Abdemanaf is a skilled creative writer who has been honing his craft since 2011. While initially working in different fields, he found a passion for technology and has been exploring the tech world since early 2015. Over the years, he has developed an in-depth knowledge of the latest tech trends and product offerings by various companies.
Abdemanaf’s writing reflects his analytical mindset and ability to think critically. He has a knack for breaking down complex technical information into easily digestible pieces, making his articles engaging and accessible to readers from all backgrounds. In February 2022, he joined Tech4Gamers as a blog and product comparison writer, where he has been able to hone his skills further.
As a writer, Abdemanaf is dedicated to staying up-to-date with the latest technological advancements and trends, enabling him to provide readers with the most relevant and accurate information. He is always eager to learn more and is constantly seeking new challenges to improve his skills.
Get In Touch: manaf@tech4gamers.com


