


AMD Ryzen 9 7950X3D
Rated: 9.5/10
Intel Core i9 13900KS
Rated: 8/10
Pros And Cons
| CPU | Pros | Cons |
|---|---|---|
| Intel Core i9-13900KS | ✅ High count of cores & threads ✅ Max turbo clock of up to 6.0 GHz ✅ Premium binned silicon | ❌ High priced ❌ Minimal gains over the standard model ❌ Consumes more power |
| AMD Ryzen 9 7950X3D | ✅ Performs admirably across the board ✅ Intelligent workload management ✅ Energy-efficient | ❌ High price ❌ Limited overclocking ❌ No support for DDR4. |
- In gaming performance, I found that the Ryzen 9 7950X3D is 4% better for 1080p gaming, while the Core i9-13900KS leads in productivity with a 5% higher benchmark score.
- The Ryzen 9 7950X3D uses 12.1% less energy and performs better per watt than the i9-13900KS. It also has a 5.2% higher thermal efficiency.
- The current price of the Intel i9-13900KS is 7.4% more expensive than the Ryzen 9 7950X3D, making Ryzen the more affordable one.
- We recommend the Ryzen 9 7950X3D for gaming and efficiency, while the Core i9-13900KS is ideal for top productivity.
Comparison Table
| Feature | AMD Ryzen 9 7950X3D | Intel Core i9-13900KS |
|---|---|---|
| Architecture | Zen 4 | Raptor Lake Hybrid architecture |
| Former Codename | Raphael AM5 | Raptor Lake |
| Socket | AM5 | FCLGA 1700 |
| Integrated Graphics | AMD Radeon Graphics | Intel UHD Graphics 770 |
| iGPU Base Clock | 400 MHz | 300 MHz |
| iGPU Boost Clock | 2200 MHz | 1650 MHz |
| PCI Express Version | 5 | 5.0 and 4.0 |
| Total PCIe Lanes | 28 | 20 |
| Unlocked For Overclocking | Yes | Yes |
| Motherboard | Motherboards For Ryzen 9 7950X3D | Motherboards For i9-13900KS |
| RAM | RAM For Ryzen 9 7950X3D | RAM For Core i9-13900KS |
| Cooler | CPU Coolers For Ryzen 9 7950X3D | CPU Coolers For Core i9-13900KS |
Architectural Differences
- Core Count: The Ryzen 9 7950X3D has 16 performance cores that add up to 32 threads, while the Core i9 13900KS has 8 performance cores in addition to 16 efficiency cores, totaling 32 threads.
- Cache: Where the i9 has its advantage in terms of core count, the Ryzen 9 7950X3D is undefeated regarding its 128MB L3 cache, while the Core i9 only had 36MB in comparison.
- TDP: The 13900KS has a significantly higher TDP than the Ryzen, around 253 watts versus the 162 watts of the Ryzen. Bear in mind both of these are PL2 TDPs.
- Processing Nodes: The Ryzen 9 has a 5nm manufacturing process, significantly more advanced than the 10nm processing nodes that the 13900KS uses.
- Memory: The Ryzen 9 7950X3D supports up to 128GB of DDR5-5200 RAM, while the Intel processor supports faster DDR5 RAM at 5600MHz; in addition to the DDR4-3200 RAM, it can also be used in junction with.
Both large CPU manufacturers have left no stone unturned in pursuing getting as much gaming performance as possible. In the Ryzen 9 7950X3D vs i9-13900KS comparison, we will compare the magnum opus from both companies to declare a definitive winner.
Ryzen 9 7950X3D Vs i9-13900KS – Gaming Benchmarks
We will now discuss the results obtained from the gaming benchmarks performed on the two processors.
Gaming Rig
- OS: Windows 10 pro
- CPU 1: AMD Ryzen 9 7950X3D
- Motherboard 1: GIGABYTE X670E Aorus Master
- CPU 2: Intel Core i9-13900KS
- Motherboard 2: MSI MPG Z790 Carbon WiFi II
- GPU: GIGABYTE RTX 4090 Gaming OC 24G
- RAM: Corsair Dominator Platinum RGB 32GB DDR5 6000MHz RAM
- SSD: XPG GAMMIX S70 BLADE 2TB NVMe
- HDD: WD Blue 4TB Desktop Hard Disk Drive
- PSU: be quiet! Dark Power Pro 13 1300W
- Cooler: Cosair ICUE H150I Elite
Hitman 3
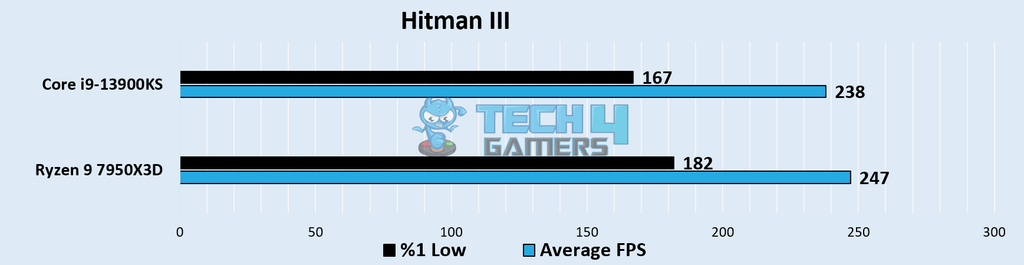
- When we tested Hitman 3, it only had a 3.9% difference in performance between the two processors. The 13900KS had an average of 238 FPS, while the Ryzen 7950X3D was a bit further ahead with an average of 247 FPS.
- 1% lows hung around 167 FPS for the 13900KS, while the 7950X3D had lows of around 182 FPS, making the gaming experience smoother by a significant amount.
Assassin’s Creed Valhalla
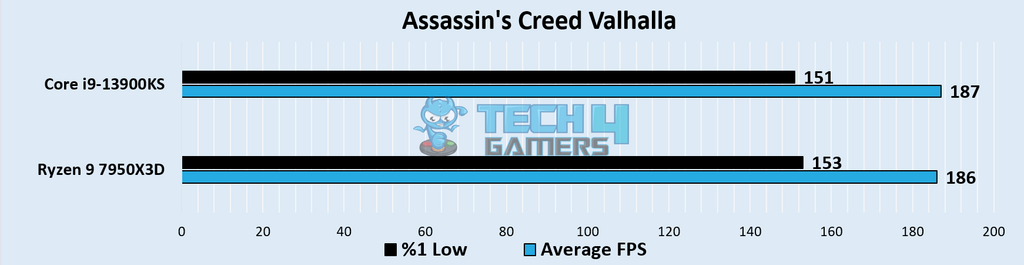
- The i9-13900KS produced an average frame rate of 187 FPS in our test of AC Valhalla, while the Ryzen 9 7950X3D produced 186 FPS in the same conditions.
- Considering the 1% low performance in Assassin’s Creed Valhalla, the Ryzen 9 7950X3D mustered up 153 FPS, while the Core i9-13900KS provided 151 FPS.
Far Cry VI
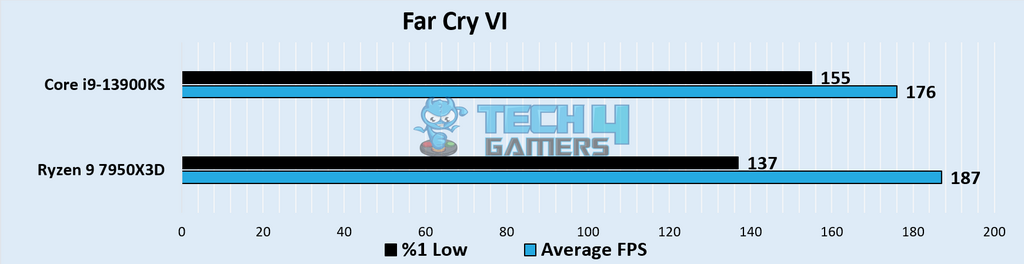
- When we tested Far Cry 6 on both processors, the 7950X3D had a 6.25% lead over its rival. Its framerate hovered around 187 FPS, while the 13900KS sat closer to 176 FPS.
- When considering the 1% low performance in Far Cry 6, the Ryzen 9 7950X3D managed 137 FPS compared to the Core i9-13900KS’s 155 FPS.
Forza Horizon V
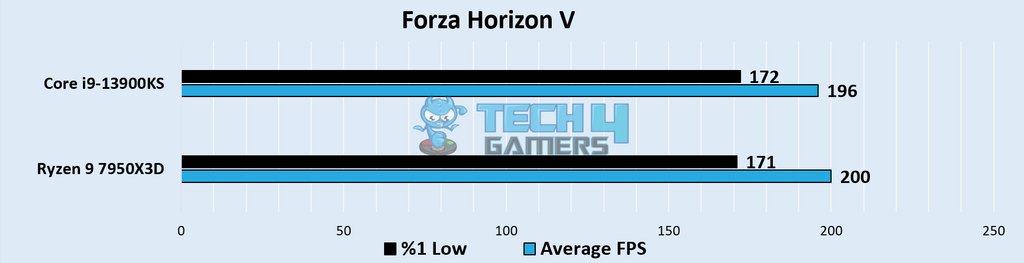
- The Ryzen overtook the i9 in our test of Forza Horizon 5 by about 2.04%, with an average framerate of around 200 FPS compared to the 196 FPS of the 13900KS.
- The 1% lows were the same between the two processors, with the 13900KS recording 172 FPS as its minimum, while the Ryzen 9 recorded 171 FPS as its minimum.
God Of War
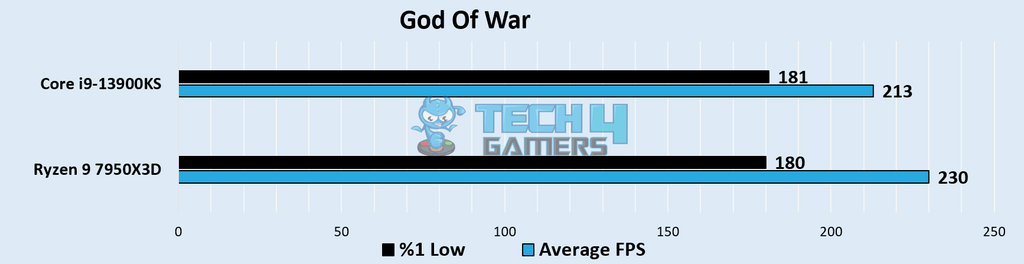
- The 13900KS displayed an average framerate of 213 FPS in our short test of God Of War, while the Ryzen was around 9% faster with an average framerate of 230 FPS.
- The 1% lows were almost equivalent on both processors in this game, with the i9 getting a minimum of around 181 FPS, while the Ryzen 9 fell closer to a minimum of 180 FPS.
Cyberpunk 2077
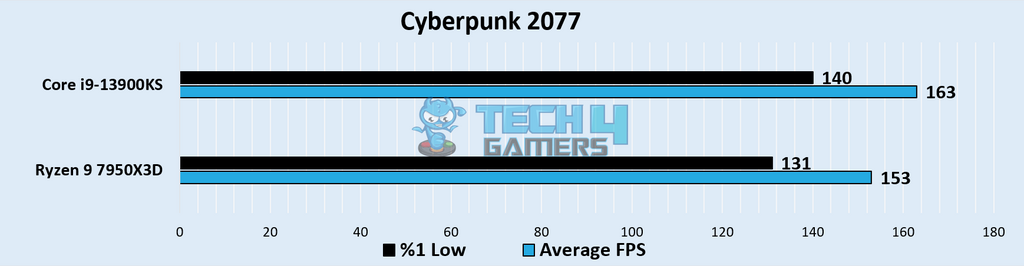
- When we tested Cyberpunk 2077, the i9 was around 6.54% faster with an average framerate of 163 FPS, while the Ryzen had a framerate of around 153 FPS.
- Regarding the 1% low FPS, the Ryzen 9 7950X3D managed 131 FPS compared to the Core i9-13900KS’s 140 FPS.
Horizon Zero Dawn
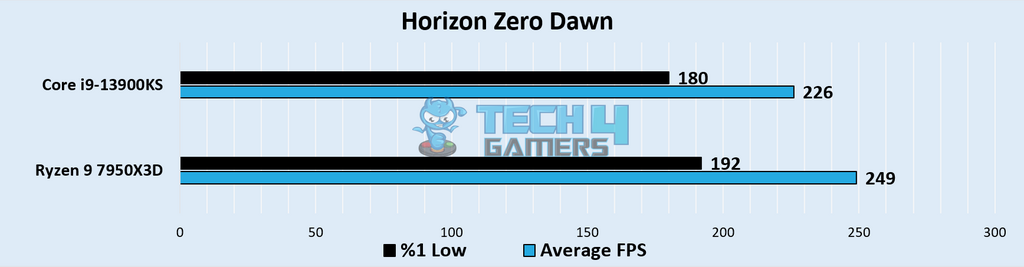
- The Ryzen regained its advantage in our test of Horizon Zero Dawn, with a framerate of 249 FPS as opposed to the 226 FPS average of the i9. This came out to an advantage of around 10.2%.
- The minimums hit around 180 FPS on the i9, while the Ryzen was ahead by a significant margin with 1% lows of 192 FPS.
Productivity Benchmarks
We added new productivity tests to our benchmark suite, using the same setup as the gaming benchmarks for consistency.
Cinebench R23
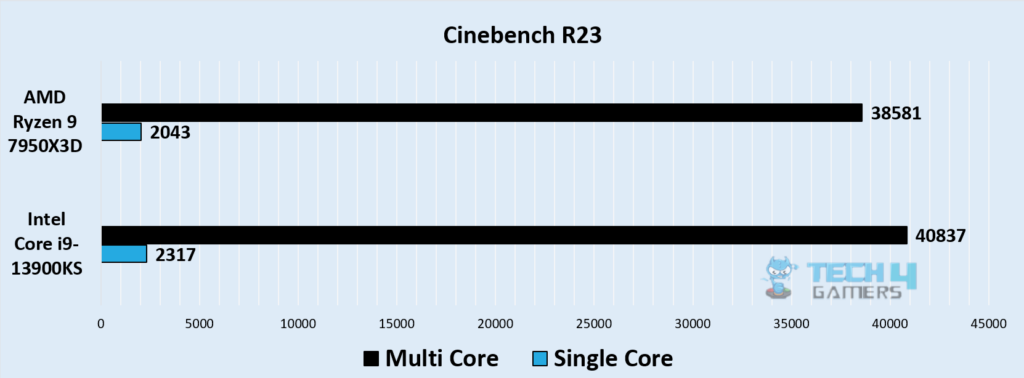
- The Intel Core i9-13900KS scored 2,317 points in the single-core Cinebench R23 test, approximately 13% higher than the 2,043 points achieved by the Ryzen 9 7950X3D.
- In the multi-core test, the i9-13900KS reached 40,837 points, which was about 6% higher than the 38,581 points secured by the Ryzen chip.
Geekbench 6
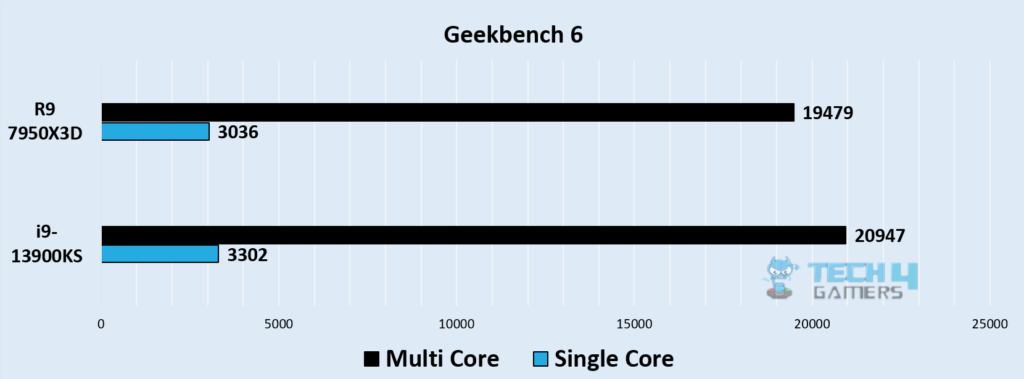
- For the single-core Geekbench 6 benchmark, the Intel Core i9-13900KS scored 3,302 points, showing a 9% lead over the 3,036 points of the Ryzen 9 7950X3D.
- However, in the multi-core test, the i9-13900KS reached 20,947 points, which was 7.5% higher than the 19,479 points achieved by the Ryzen chip.
Passmark CPU
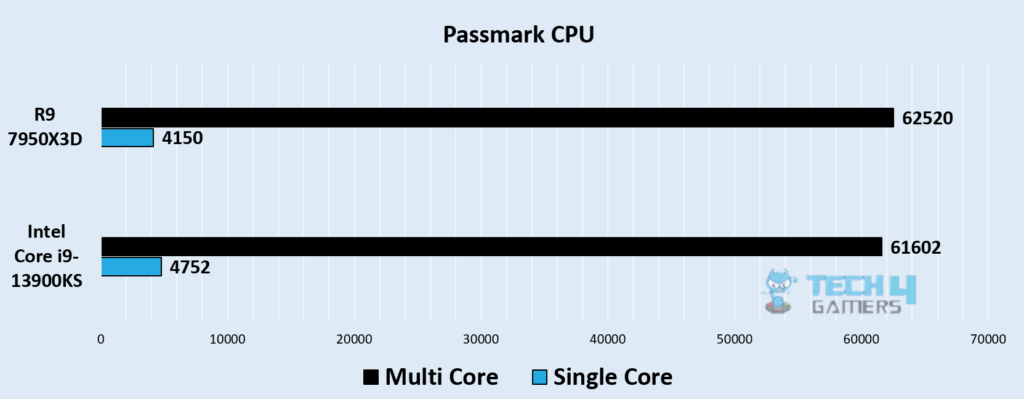
- Now, for the Passmark’s single-core test, the Intel Core i9-13900KS scored 4,752 points, which is about 15% higher than the 4,150 points of the Ryzen 9 7950X3D.
- But in the multi-core performance, the Ryzen 9 7950X3D scored 62,520 points, 1.5% higher than the 61,602 points of the i9-13900KS
Overall Performance
| Processor | Average FPS | 1% Lows | Productivity (Rating) |
|---|---|---|---|
| AMD Ryzen 9 7950X3D | 📈 207.4 | 📉 163.8 | ✏️9/10 |
| Intel Core i9-13900KS | 📈 199.6 | 📉 163.6 | ✏️9.5/10 |
| Winner: AMD Ryzen 9 7950X3D | |||
Gaming
After evaluating the frame rates average for the games mentioned above, the figures indicate that the Ryzen 9 7950X3D delivers 3.91% better gaming performance than the Core i9-13900KS. Regarding the 1% low performance, there was little to no change between these two processors during the games mentioned above at 1080p resolution.
Productivity
The Intel Core i9-13900KS is approximately 5% better overall productivity than the Ryzen 9 7950X3D. However, the Ryzen 9 7950X3D shows competitive results, especially in specific multi-core scenarios like Passmark, thanks to its 3D V-Cache design.
Power Consumption
| Games | AMD Ryzen 9 7950X3D (W) | Intel Core i9-13900KS (W) |
|---|---|---|
| Average Power Consumption | 113⚡️ | 126.7⚡️ |
| Winner: AMD Ryzen 9 7950X3D | ||
If we look at the power consumption of the two processors, the Ryzen 9 7950X3D used 12.1% less power than the Core i9-13900KS when running games at 1080p resolution. When we compare the Ryzen 9 7950X3D and Core i9-13900KS as alternatives for low-income users, the Ryzen 9 7950X3D would be the best choice.
Thermal Efficiency
| Games | AMD Ryzen 9 7950X3D (°C) | Intel Core i9-13900KS (°C) |
|---|---|---|
| Average Thermal Capacity | 76 🌡️ | 79.4 🌡️ |
| Winner: AMD Ryzen 9 7950X3D | ||
Regarding the CPU gaming temperature, the Core i9-13900KS’s temperature was 3.4 degrees higher on average. These figures lead us to conclude that the Ryzen 9 7950X3D exhibits 5.2% more thermal efficiency when compared to the Core i9-13900KS.
Price And Availability
| GPU | MSRP | Current Price |
|---|---|---|
| AMD Ryzen 9 7950X3D | 💲699 | 💲599 |
| Intel Core i9-13900KS | 💲699 | 💲643.47 |
| Difference | 0% | 7.47% |
When buying a processor, it is vital to compare the two processors’ costs and levels of availability. The difference between the current prices is about 7.47%, making Ryzen 9 7950X3D the most economical among the two competitors. Regarding availability, the two processors are available in online marketplaces easily.
Conclusive Remarks – Which One We Recommend?
Ryzen 9 7950X3D: If gaming performance and energy efficiency are top priorities, we recommend the Ryzen 9 7950X3D. It demonstrates a 4% lead in gaming benchmarks over the Core i9-13900KS, operates with 12.1% lower power consumption, and maintains a cooler average temperature.
Core i9-13900KS: For users who need excellent gaming capability combined with productivity strength, the Core i9-13900KS still has strong multi-core performance. However, it consumes more power and runs hotter, making it less efficient than its AMD counterpart.
We recommend the Ryzen 9 7950X3D for superior gaming performance and energy savings, while the Core i9-13900KS is a solid option for those balancing high-performance gaming with productivity tasks.
The i9-13900KS leads in single-threaded tasks due to its 6.0 GHz boost clock. The Ryzen 9 7950X3D runs cooler due to its lower power draw. i9-13900KS has Intel UHD Graphics 770; Ryzen 9 7950X3D has basic Radeon Graphics. The i9-13900KS supports both DDR4 and DDR5, unlike the DDR5-only Ryzen. The i9-13900KS often offers better multi-threaded value for money. FAQs
More From Intel Core i9-13900KS
More From AMD Ryzen 9 7950X3D
Thank you! Please share your positive feedback. 🔋
How could we improve this post? Please Help us. 😔
[Comparisons Expert]
Abdemanaf is a skilled creative writer who has been honing his craft since 2011. While initially working in different fields, he found a passion for technology and has been exploring the tech world since early 2015. Over the years, he has developed an in-depth knowledge of the latest tech trends and product offerings by various companies.
Abdemanaf’s writing reflects his analytical mindset and ability to think critically. He has a knack for breaking down complex technical information into easily digestible pieces, making his articles engaging and accessible to readers from all backgrounds. In February 2022, he joined Tech4Gamers as a blog and product comparison writer, where he has been able to hone his skills further.
As a writer, Abdemanaf is dedicated to staying up-to-date with the latest technological advancements and trends, enabling him to provide readers with the most relevant and accurate information. He is always eager to learn more and is constantly seeking new challenges to improve his skills.
Get In Touch: manaf@tech4gamers.com


