


Intel Core i9 13900KS
Rated: 9/10
AMD Ryzen 9 7900X3D
Rated: 8.5/10
Pros And Cons
| CPU | Pros | Cons |
|---|---|---|
| Intel Core i9-13900KS | ✅ Multitasking ✅ Better resource-intensive results ✅ Outstanding performance | ❌ Generates notable heat during operation |
| AMD Ryzen 9 7900X3D | ✅ Robust gaming capabilities ✅ Satisfying gameplay experience ✅ Latest & Modern Technologies | ❌ No support for DDR4. |
- Our analysis showed that the Intel i9-13900KS excels in productivity, offering a 6% advantage, but the Ryzen 9 7900X3D performs 8.5% better in gaming.
- The Intel i9-13900KS grapples with higher heat levels, underscoring the latter’s cooler operation. Regarding the power draw, the i9-13900KS consumed 37W more at an average.
- In terms of value for money, the Ryzen 9 also comes out on top, with a lower price point than the Intel i9-13900KS. This makes it a more accessible option for gamers and content creators on a budget.
- If gaming is your priority, the Ryzen 9 7900X3D is the better choice. For higher productivity and single-core performance, the Intel i9-13900KS stands out.
Comparison Table
| CPU | Core i9-13900KS | Ryzen 9 7900X3D |
|---|---|---|
| Codename | Raptor Lake-S | Raphael |
| Socket | Intel Socket 1700 | AMD Socket AM5 |
| No. of Cores | 24 | 12 |
| No. of Threads | 32 | 24 |
| L2 Cache | 2MB (per core) | 1MB (per core) |
| L3 Cache | 36MB (shared) | 96MB (shared) |
| Memory Support | DDR4-3200 MHz, DDR5-5600 MHz Dual-channel | DDR5-5200 MHz Dual-channel |
| Integrated Graphics | UHD Graphics 770 | Radeon Graphics |
| Max Operating Temperature | 100°C | 89°C |
| ECC Memory | Yes | Yes |
| MSRP | $699 | $599 |
| Release Date | Jan 12th, 2023 | Jan 4th, 2023 |
| Best CPU Coolers | Best CPU Coolers For i9-13900KS | Best CPU Coolers For Ryzen 9 7900X3D |
| Best Motherboards | Best Motherboards For i9-13900KS | Best Motherboards For Ryzen 9 7900X3D |
Architecture Differences
- Process Node: Starting, the Core i9-13900KS employs the advanced 10nm process, contrasting with the Ryzen 9 7900X3D’s innovative 5nm process node, showcasing distinct manufacturing technologies.
- Frequency: When it comes to frequency, the Core i9-13900KS commands a Base Clock of 3.2 GHz and a Boost Clock of an impressive 6 GHz, while the Ryzen 9 7900X3D maintains a Base Clock of 4.4 GHz and a Boost Clock of up to 5.6 GHz, reflecting diverse frequency capabilities.
- TDP: Furthermore, operating within 150W TDP, the Core i9-13900KS achieves its performance balance, while the Ryzen 9 7900X3D harmonizes with a 120W TDP, highlighting distinct thermal profiles.
- Cores and Threads: The Core i9-13900KS is forged with 8 cores and 16 threads, whilst the Ryzen 9 7900X3D boasts an impressive configuration of 12 cores and 24 threads, displaying varying core and thread counts.
- Cache Memory: With an L2 cache memory size of 20MB, the Core i9-13900KS delivers formidable performance, whereas the Ryzen 9 7900X3D surges ahead with a larger L2 cache memory size of 64MB, demonstrating superior multitasking capabilities.
We have seen the i9-13900KS trample over many processors to mark its superior performance. Today, we contest the Core i9-13900KS vs Ryzen 9 7900X3D. As always, we will evaluate the processors by their architectures, properties, thermal and power intakes, and most importantly, based on their performance against some highly demanding games’ benchmarks.
Core i9-13900KS Vs Ryzen 9 7900X3D: Gaming Benchmarks
The main feature of any processor’s strength is its performance in different products and gaming benchmarks. As the processor is opened to maximum capabilities, it performs at maximum parameters for a particular game and thus displays its strength when subjected to high-tension scenarios.
Note: However, remember that the upcoming benchmarks are not entirely accurate and constant in each case. A consumer may find variable values based on the supporting rig, the surrounding temperature, involved software availability, and other essential factors.
Testing Rig
The following testing rig was used to carry out all the benchmarks.
- OS: Windows 10 pro
- CPU 1: AMD Ryzen 9 7900X3D
- Motherboard 1: GIGABYTE X670E Aorus Master
- CPU 2: Intel Core i9-13900KS
- Motherboard 2: MSI MPG Z790 Carbon WiFi II
- GPU: GIGABYTE RTX 4090 Gaming OC 24G
- RAM: Corsair Dominator Platinum RGB 32GB DDR5 6000MHz RAM
- SSD: XPG GAMMIX S70 BLADE 2TB NVMe
- HDD: WD Blue 4TB Desktop Hard Disk Drive
- PSU: be quiet! Dark Power Pro 13 1300W
- Cooler: Cosair ICUE H150I Elite
Forza Horizon 5
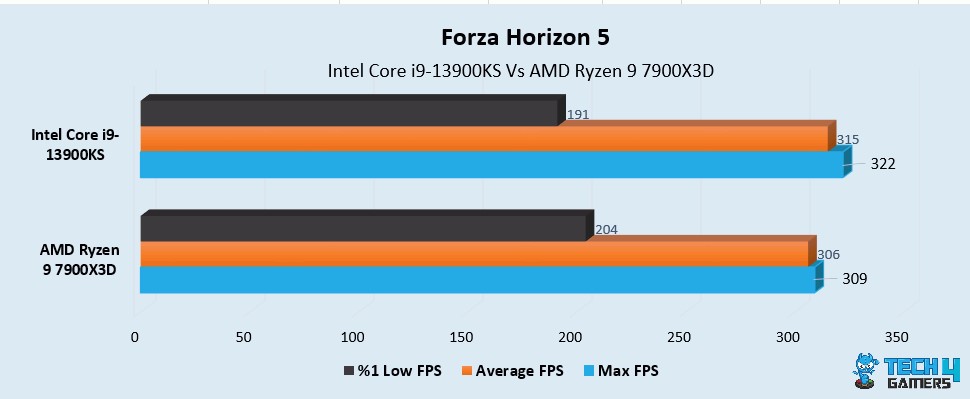
- In our first game, Forza Horizon 5, the i9-13900KS had an aggregate 315 FPS while the Ryzen 9 7900X3D had a 5% less average of 306 FPS.
- The %1 low was handed over to the Ryzen 9 7900X3D as the processor had a 6.5% faster rate of 204 FPS, whereas the i9-13900KS had a %1 low framerate of 191 FPS.
Call Of Duty Warfare 2.0
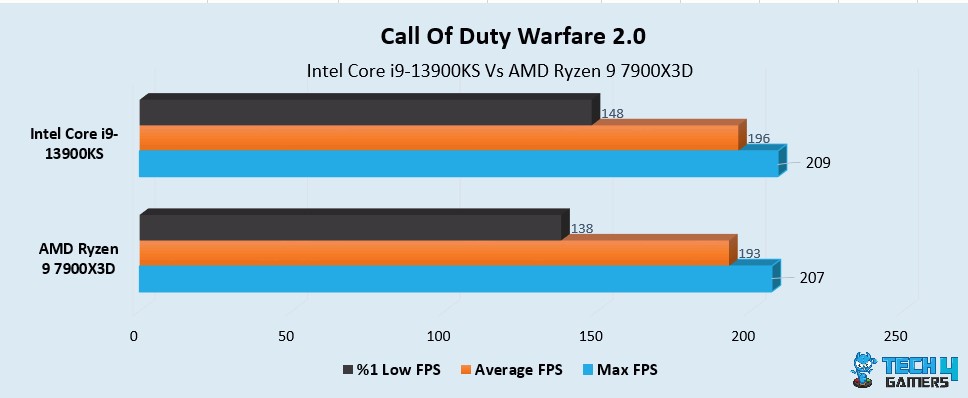
- Moving onto the COD Warfare 2.0, we saw that the average FPS of the i9-13900KS was recorded at 196 FPS, which was 3 FPS more than the Ryzen 9 7900X3D’s 193 FPS.
- The i9-13900KS again overthrew the 7900X3D with a %1 low framerate of 148 FPS, while the 7900X3D could only deliver a 10 FPS lower %1 low framerate of 138 FPS.
God Of War
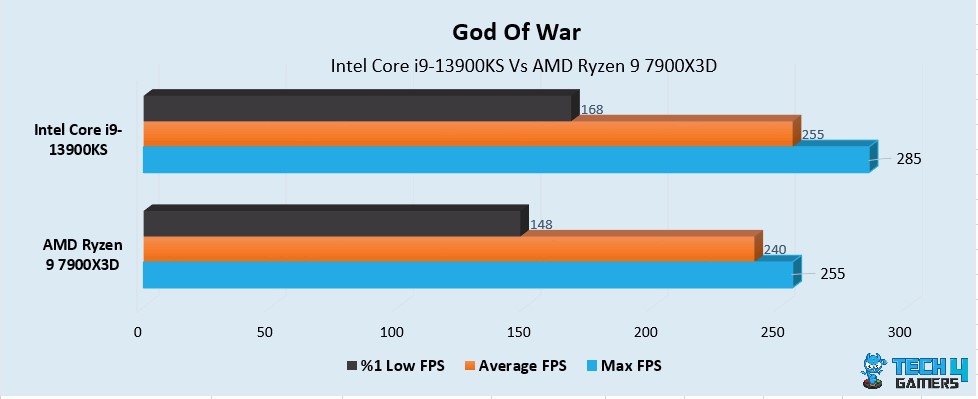
- The God Of War benchmark put the i9-13900KS in the lead as the processor had a 6% more framerate recorded to be 255 FPS, whereas the Ryzen 9 7900X3D secured a framerate of 240 FPS on average.
- The i9-13900KS also had 20 FPS higher %1 low framerate of 168 FPS. In competition, the Ryzen 9 7900X3D managed to bring 148 FPS forth.
Hogwarts Legacy
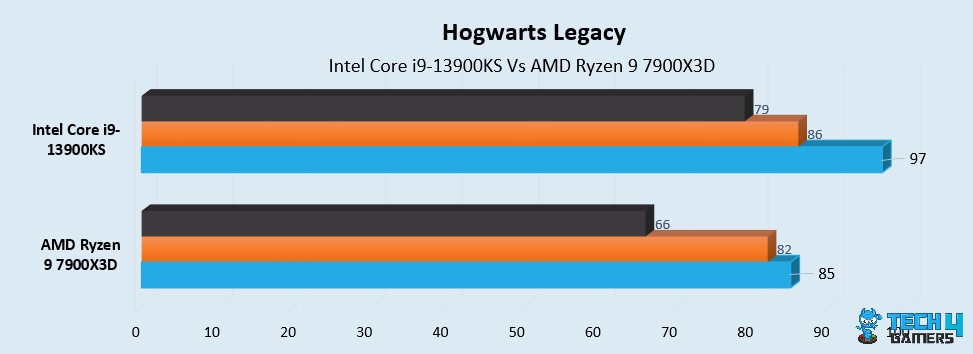
- Setting the average framerate mark at 86 FPS, the i9-13900KS again led our Hogwarts Legacy benchmark by 4 FPS. On the flip side, the 7900X3D followed with 82 FPS.
- Concurrently, the %1 low framerates favored i9-13900KS, too, as the processor delivered 79 FPS, compared with the 7900X3D’s 66 FPS, which was 13 FPS less.
Horizon Zero Dawn
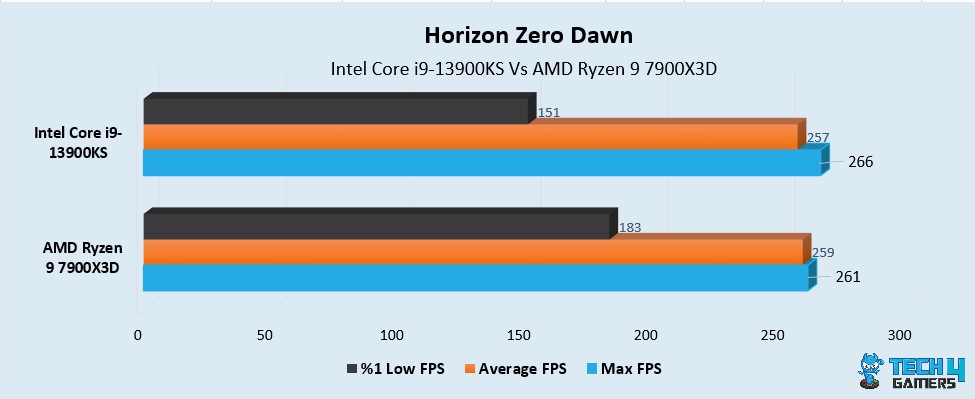
- The Horizon Zero Dawn benchmark crowned the Ryzen 9 7900X with a barely higher framerate of 259 FPS, while the i9-13900KS had an average framerate of 257 FPS.
- Simultaneously, the recorded %1 low for the i9-13900KS was 151 FPS, which was 19% less than the Ryzen 9 7900X3D’s %1 low of 183 FPS.
Spiderman
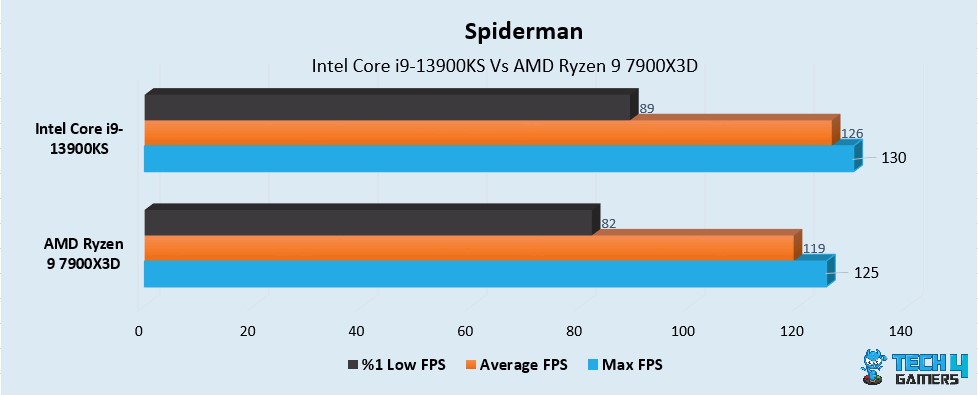
- The average framerate of the i9-13900KS was recorded at 126 FPS, compared to the 7900X3D’s 119 FPS, which was 7 FPS less, in our Spiderman benchmark.
- Additively, the %1 low of the i9-13900KS was also 7 FPS more, i.e., 89 FPS. Concurrent to this, the 7900X3D delivered 82 FPS.
The Witcher 3
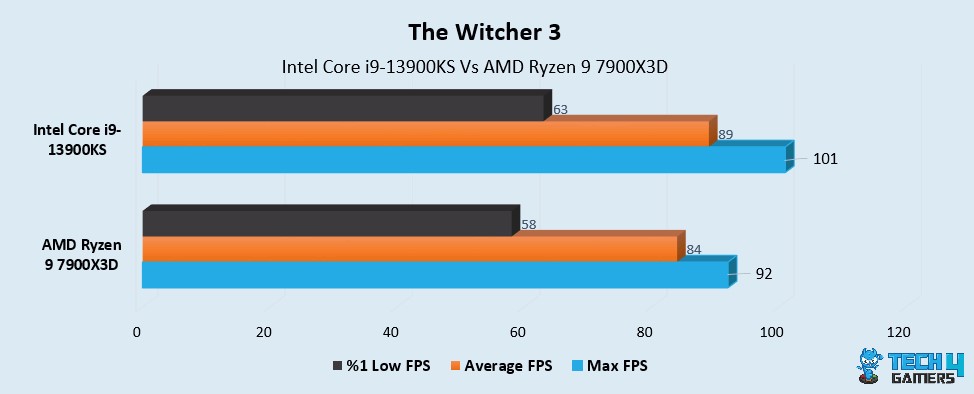
- Comparing the average framerates of The Witcher 3, the i9-13900KS led with an average of 89 FPS, while the 7900X3D followed with a 5 FPS lesser average framerate of 84 FPS.
- Simultaneously, the %1 low framerate delivered by the i9-13900KS was 63 FPS, whereas the 7900X3D gave out 5 FPS lesser %1 low framerate of 58 FPS.
Counter Strike – Global Offensive
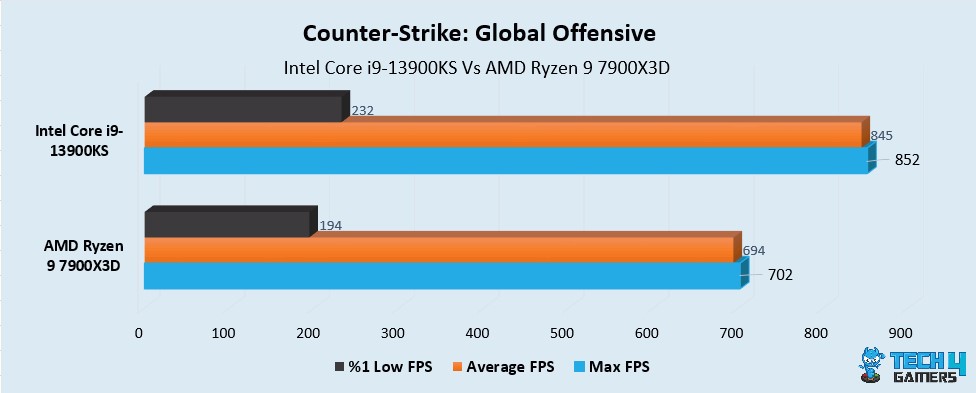
- Setting the average framerate mark at 845 FPS, the i9-13900KS again led the CS:GO benchmark by 19%. On the flip side, the 7900X3D followed with 694 FPS.
- Concurrently, the %1 low framerates favoured i9-13900KS, too, as the processor delivered 232 FPS, compared with the 7900X3D’s 194 FPS, which was 18% lesser.
Cyberpunk 2077
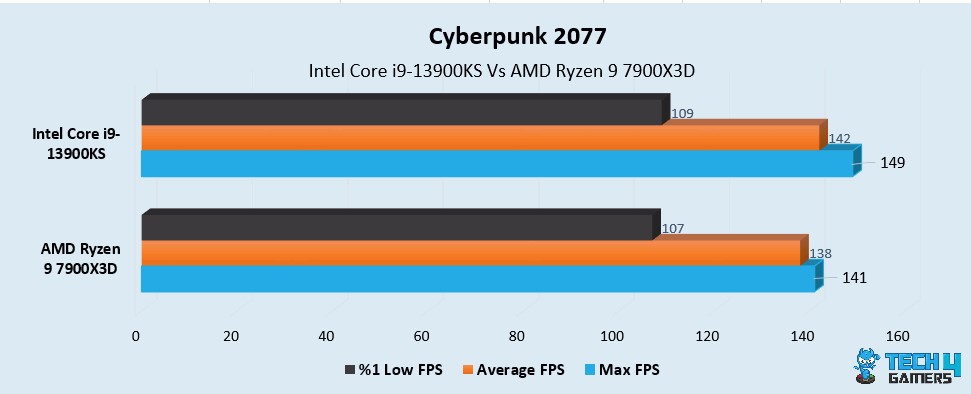
- The Cyberpunk benchmark put the i9-13900KS in the lead as the processor had a 3% more framerate recorded to be 142 FPS, whereas the Ryzen 9 7900X3D secured a framerate of 138 FPS on average.
- i9-13900KS also had 2 FPS higher 1% low framerate of 109 FPS. In competition, the Ryzen 9 7900X3D managed to bring 107 FPS forth.
Microsoft Flight Simulator
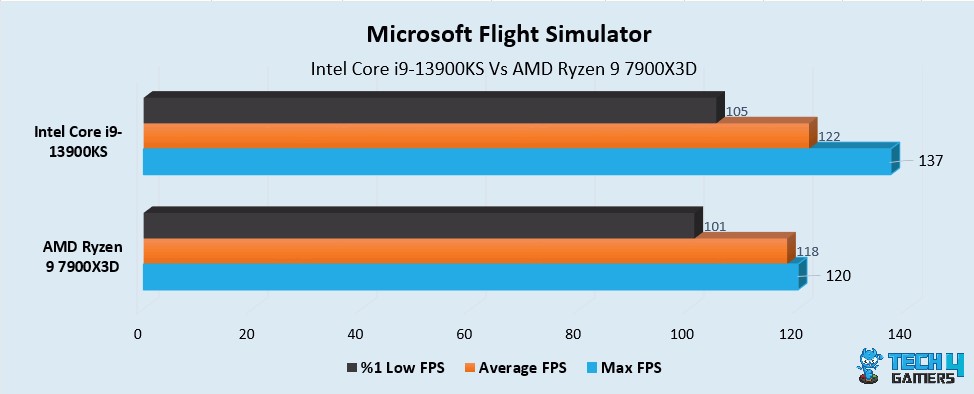
- The i9-13900KS dominated the Microsoft Flight Simulator charts with an aggregate 122 FPS while the Ryzen 9 7900X3D had a 4 FPS lesser average of 118 FPS.
- The %1 low was handed over to the Ryzen 9 7900X3D as the processor had a 4 FPS higher rate of 101 FPS, whereas the i9-13900KS had a %1 low framerate of 105 FPS.
Productivity Benchmarks
New productivity tests have been added to our benchmark suite, using the same setup as the gaming tests for consistency.
Cinebench R23
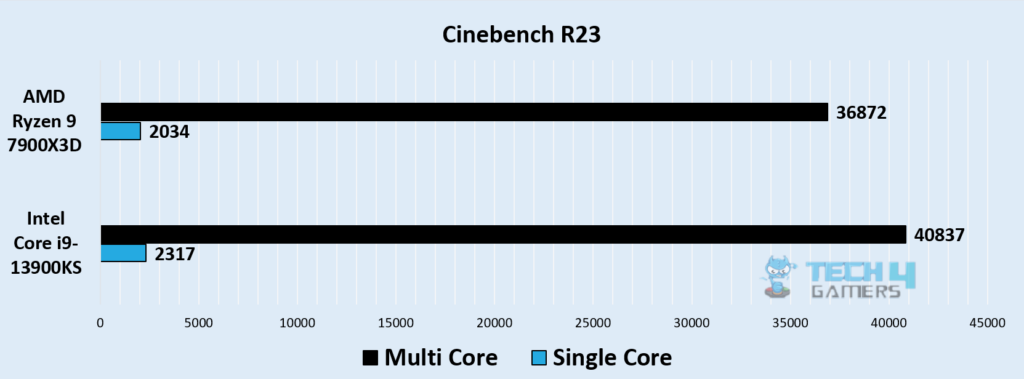
- In the single-core Cinebench R23 test, the Intel Core i9-13900KS achieved 2,317 points, about 13.9% higher than the 2,034 points of the Ryzen 9 7900X3D.
- Moving to the multi-core performance, the i9-13900KS scored 40,837 points, surpassing the 36,872 points of the Ryzen 9 7900X3D by approximately 10.3%.
Geekbench 6
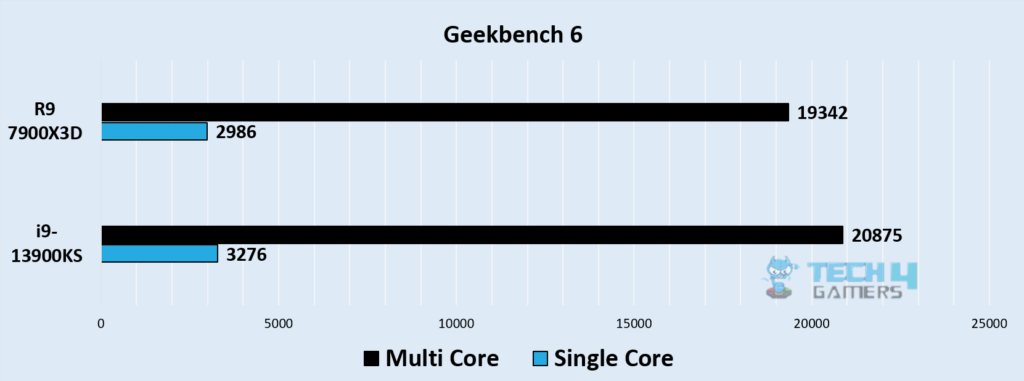
- Scoring 3,276 points in the single-core Geekbench 6 benchmark, the Intel Core i9-13900KS demonstrated a 9.7% advantage over the 2,986 points of the Ryzen 9 7900X3D.
- Meanwhile, in the multi-core test, the i9-13900KS reached 20,875 points, 7.7% higher than the 19,342 points achieved by the Ryzen chip.
Passmark CPU
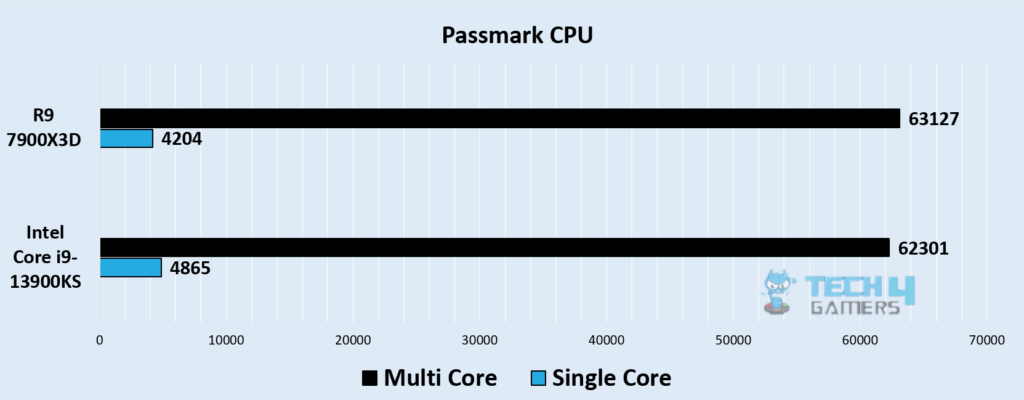
- Achieving 4,865 points in the Passmark single-core test, the Intel Core i9-13900KS outperformed the Ryzen 9 7900X3D’s 4,204 points by about 15.7%.
- However, the Ryzen 9 7900X3D scored 63,127 points in the multi-core test, slightly edging the i9-13900KS’s 62,301 points by 0.5%.
Overall Performance
| Processor | Core i9-13900KS | Ryzen 9 7900X3D |
|---|---|---|
| Average FPS | 📈 248 | 📈 244 |
| 1% Lows | 📉 187 | 📉 183 |
| Productivity (Rating) | ✏️9/10 | ✏️8.5/10 |
| Winner: Core i9-13900KS | ||
Gaming
Our gaming benchmarks show that the overall gaming performance of the Intel i9-13900KS gained an average of 8.5% over the Ryzen 9 7900X3D throughout all 10 games. However, when it comes to the %1 low frame rate, the Core i9 13900KS performed slightly better with a difference of just 4 FPS.
Productivity
Regarding productivity, the Intel i9-13900KS outperformed the Ryzen 9 7900X3D in tests like Cinebench R23, Geekbench 6, and Passmark CPU. On average, we recorded a 6% performance lead for the i9-13900KS over the Ryzen 9 7900X3D.
Overall Power Consumption
| Processor | Core i9 13900KS | Ryzen 7900X3D |
|---|---|---|
| Average Power Consumption | 107 ⚡️ | 70 ⚡️ |
| Winner: GeForce GTX 1060 | ||
Moving on, we found that the Ryzen 9 7900X3D took much less power as it drained 70W throughout the gaming benchmarks. On the other hand, the Intel i9-13900KS took about 107W during the benchmarks. Generally, the leading power intake was done by the Intel i9-13900KS, which took around 33% more power than the Ryzen 9 7900X3D.
Overall Thermal Capacity
| Processor | Core i9 13900KS | Ryzen 7900X3D |
|---|---|---|
| Average Thermal Efficiency | 61.4 🌡️ | 59.1 🌡️ |
| Winner: Ryzen 7900X3D | ||
The temperature difference between the two processors was almost 2°C, with i9-13900KS being the hotter processor than the 7900X3D. However, the difference in thermal capacity was not significant enough to affect the overall performance of the processors. In terms of temperature management, both processors performed well.
Price & Availability
| Processor | Core i9 13900KS | Ryzen 9 7900X3D | Price Difference |
|---|---|---|---|
| Launch MSRP | 💲699 | 💲599 | 16.6% |
| Current Price | 💲590 | 💲470 | 25.5% |
Analyzing the current market prices, we see that both the AMD Ryzen 9 7900X3D and the Intel Core i9-13900KS are available across all platforms for users. When it comes down to the price, the AMD Ryzen 9 7900X3D is about 25% more affordable than the Intel Core i9-13900KS, making it a more appealing option for budget-conscious users.
Core i9-13900KS Vs Ryzen 9 7900X3D: Which Processor To Opt For?
Ryzen 9 7950X3D: If your main focus is outstanding gaming performance and greater energy efficiency, the Ryzen 9 7950X3D is our top pick. It delivers a 4% performance advantage in gaming over the Core i9-13900KS, consumes 12.1% less power, and stays cooler overall.
Core i9-13900KS: For users seeking a blend of excellent gaming capabilities and robust productivity performance, the Core i9-13900KS remains a strong contender. However, it uses more power and tends to run hotter, making it less energy-efficient than the Ryzen option.
We suggest the Ryzen 9 7950X3D for superior gaming and better power savings. At the same time, the Core i9-13900KS is an ideal choice for users needing a balance between high-end gaming and productivity tasks.
FAQs
Yes, you can overclock both these CPUs.
Yes, both these processors have iGPUs.
Yes, both these processors have support for DDR4 and DDR5 memory.
The Intel i9-13900KS excels in multitasking with its higher core and thread count, making it ideal for resource-intensive tasks.
The Ryzen 9 7900X3D is slightly more thermally efficient, running about 2°C cooler than the Intel i9-13900KS.
More From Core i9 13900KS:
- Core i9 13900KS Vs Ryzen 9 7950X
- Ryzen 9 7950X3D Vs Core i9-13900KS
- Core i9 13900KS Vs Ryzen 7 7800X3D
More From Ryzen 7900X3D:
- Core i9-13900KF Vs Ryzen 9 7900X3D
- Core i7-14700K Vs Ryzen 9 7900X3D
- Core i9 14900K Vs Ryzen 9 7900X3D
Thank you! Please share your positive feedback. 🔋
How could we improve this post? Please Help us. 😔
[Hardware Reviewer]
Hi! I’m Ali Tauseef, and I have been writing for Tech4Gamers since 2022. I love all things computer hardware but am particularly fond of CPUs and motherboards, and I like to stay up-to-date about the latest advancements in these worlds, and when possible, write about it. When I’m not doing that, I like to get into a little FPS action in CS2 or get lost in the vast world of RDR2.
Get In Touch: ali@tech4gamers.com


