


Intel Core i9 13900KS
Rated: 8.8/10
AMD Ryzen 9 7950X
Rated: 8.5/10
Pros & Cons
| Pros | Cons | |
|---|---|---|
| Core i9 13900KS | ✅ Higher performance. ✅ Offers the choice between DDR5 and DDR4 RAM | ❌ Very old manufacuring process ❌ Very similar to the 13900K. |
| Ryzen 9 7950X | ✅ Excellent power efficiency. ✅ Relatively cheaper. | ❌ Slightly higher temperatures. ❌ Less cores. |
- Additionally, when it comes to gaming performance, the Core i9 13900KS excels with a significant 5.5% lead in FPS performance compared to the Ryzen 9 7950X.
- When it comes to power efficiency, the Ryzen 9 7950X takes the lead with a remarkable 6.6% reduction in power consumption compared to the Core i9 13900KS.
- Lastly, the Core i9 13900KS edges out the Ryzen 9 7950X in thermal efficiency, boasting a slight 10.7% advantage.
- We recommend the Core i9 13900KS for its higher performance and lower temperatures, and we recommend the Ryzen 9 7950X for its reasonable price and lower power consumption.
Comparison Table
| CPU | Core i9 13900KS | Ryzen 9 7950X |
|---|---|---|
| Socket | Intel Socket 1700 | AMD Socket AM5 |
| Cores & Threads | 24 Cores & 32 Threads | 16 Cores & 32 Threads |
| L2 Cache | 2MB (per core) | 1MB (per core) |
| L3 Cache | 36MB (shared) | 64MB (shared) |
| Memory Support | DDR4 Speed: 3200 MT/s | DDR5 Speed: 5600 MT/s | DDR5 Speed: 5200 MT/s |
| Integrated Graphics | UHD Graphics 770 | Radeon Graphics |
| Max Temperature | 100°C | 100°C |
| PPT | 253 W | 230 W |
| Release Date | Jan 12th, 2023 | Sep 27th, 2022 |
| Best CPU Coolers | Best CPU Coolers For i9-13900KS | Best CPU Coolers For Ryzen 9 7950X |
| Best Memory | Best RAM For Core i9-13900KS | Best RAM For Ryzen 9 7950X |
| Best Motherboards | Best Motherboards For i9-13900KS | Best Motherboards for Ryzen 9 7950X |
Architectural Differences
- Processing Node: Starting, the Ryzen 9 7950X boasts a smaller 5nm TSMC process, while the Core i9 13900KS relies on a 10nm Intel process node. So, the Ryzen 9 7950X has a clear advantage in the shape of a modern processing node.
- Frequency: Moving on to the clock speeds, the Ryzen 9 7950X boasts a frequency of 4.5 GHz and a turbo clock of 5.7 GHz, while the Core i9 13900KS operates at a base clock of 3.2 GHz with a turbo clock of up to 6 GHz.
- TDP: Furthermore, the Core i9 13900KS features a TDP of 150W, whereas the Ryzen 9 7950X has a slightly higher TDP of 170W.
- Cache: The Ryzen 9 7950X has a total of 72MB, with 64MB being L3 cache and an additional 8MB for L2 cache. The 13900KS has a 32MB L3 cache and an extra 8MB for L2 cache.
- Cores/Threads: The Ryzen 9 7950X boasts a whopping 16 cores and 32 threads, whereas the Core i9 13900KS falls slightly behind with just 12 cores and 24 threads.
Turning our attention away from the i9-13900K vs i9-12900K comparison, we venture into a new battle of the processors, pitting the Core i9 13900KS vs Ryzen 9 7950X. We meticulously scrutinize the disparities in performance, shedding light on the distinctions between Intel and AMD’s offerings.
Core i9 13900KS Vs Ryzen 9 7950X: Gaming Benchmarks
Now that we have covered the technical aspects, it’s about time we pit the mighty Core i9 13900KS against the formidable Ryzen 9 7950X. With a wide array of modern, demanding games as our main battleground, we embark on a benchmark test with performance metrics, to test out these processors.
Testing Rig
- OS: Windows 10 pro
- CPU 1: AMD Ryzen 9 7950X3D
- Motherboard 1: GIGABYTE X670E Aorus Master
- CPU 2: Intel Core i9-13900KS
- Motherboard 2: MSI MPG Z790 Carbon WiFi II
- GPU: GIGABYTE RTX 4090 Gaming OC 24G
- RAM: Corsair Dominator Platinum RGB 32GB DDR5 6000MHz RAM
- SSD: XPG GAMMIX S70 BLADE 2TB NVMe
- PSU: be quiet! Dark Power Pro 13 1300W
- Cooler: Cosair ICUE H150I Elite
Forza Horizon 5
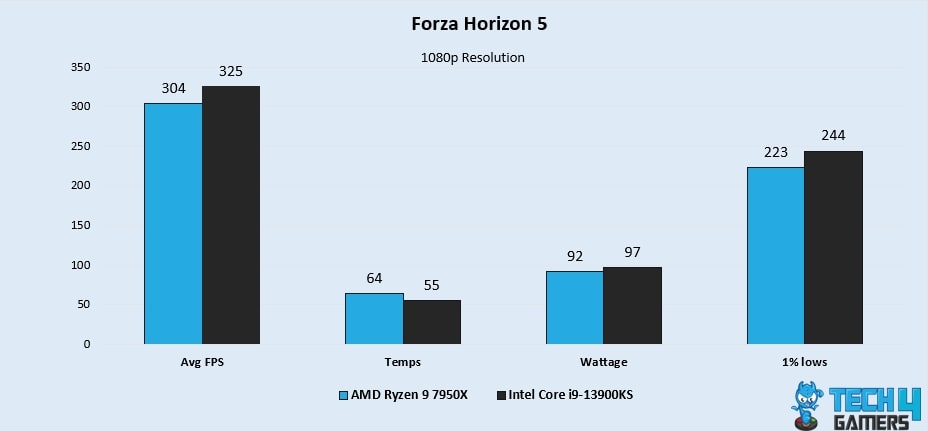
- Starting by boasting a lead of 6.6%, the Core i9-13900KS showcases its superiority in our Forza Horizon 5 benchmarks with an average FPS of 325 FPS, surpassing the Ryzen 9 7950X’s 304 FPS.
- In addition, in terms of 1% lows, the Core i9-13900KS delivers an impressive 244 FPS, surpassing the Ryzen 9 7950X’s 223 FPS by 8.9%.
Cyberpunk 2077
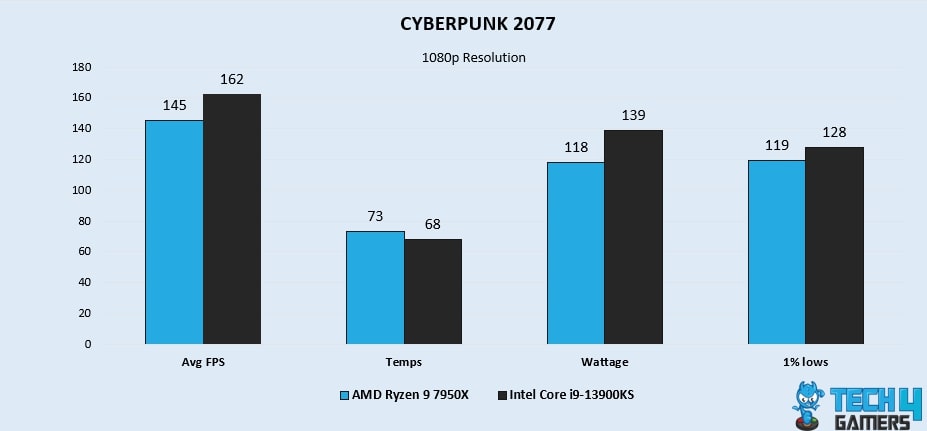
- Firstly, with an impressive 11% advantage in Cyberpunk 2077, the Core i9-13900KS takes the lead with an average FPS of 162, leaving the Ryzen 9 7950X behind at 145 FPS.
- In addition, when it comes to 1% lows, the Core i9-13900KS exhibits 128 FPS, outperforming the Ryzen 9 7950X’s 119 FPS by 7.2%.
Hitman 3
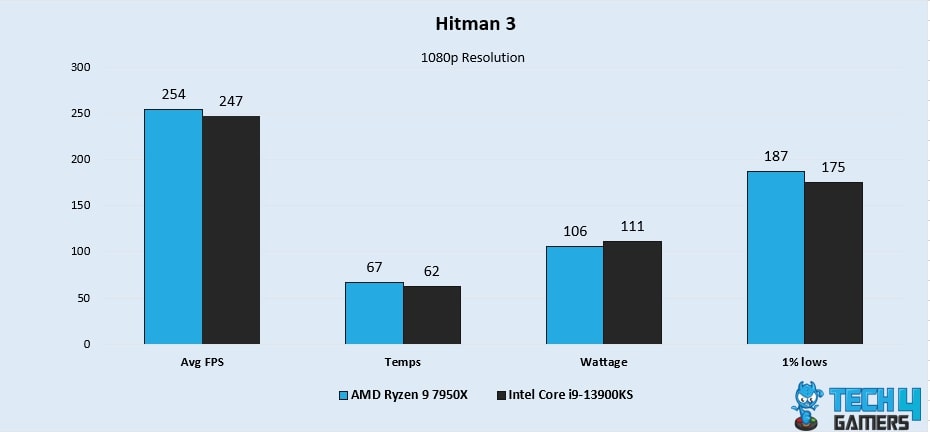
- In Hitman 3, by demonstrating a slight edge, the Ryzen 9 7950X outperforms the Core i9-13900KS by 2.7% with an average FPS of 254 compared to 247 FPS.
- Moreover, showcasing its prowess in 1% lows, we see that the Ryzen 9 7950X showcases a performance of 175 FPS, enjoying a 6.6% advantage over the Core i9-13900KS’s 187 FPS.
Spider-Man Miles Morales
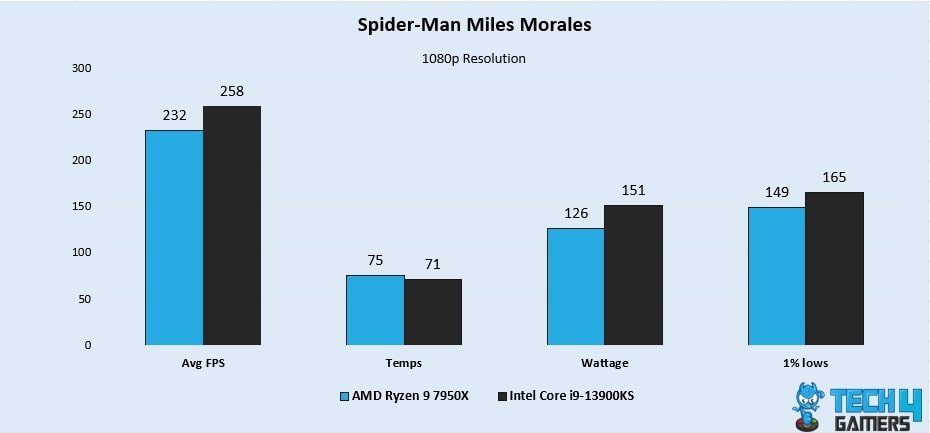
- Surging ahead with a significant lead of 10.6%, the Core i9-13900KS delivers an average FPS of 258 FPS in our Spiderman Miles Morales benchmark, leaving the Ryzen 9 7950X in the dust at 232 FPS.
- While going over the 1% lows, the Core i9-13900KS delivers outstanding performance with 165 FPS, showcasing a 10.1% lead over the Ryzen 9 7950X’s 149 FPS.
Player Unknown Battleground
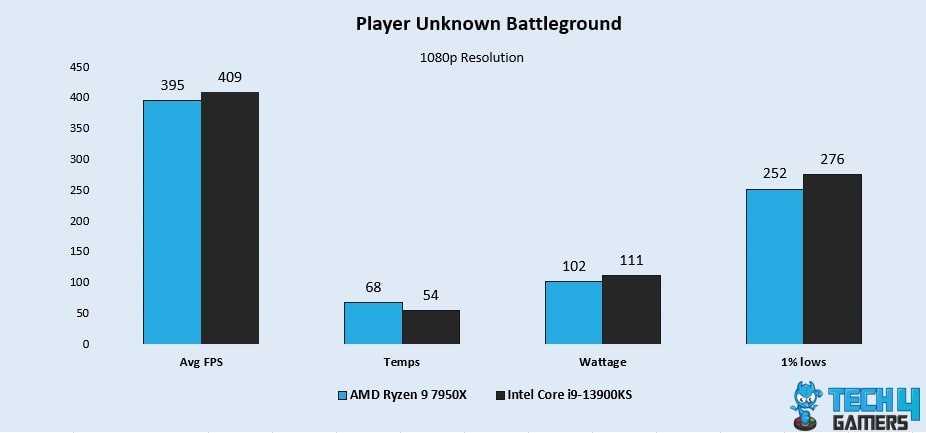
- By showcasing its dominance, the Core i9-13900KS maintains a lead of 3.4% with an average FPS of 409, surpassing the Ryzen 9 7950X’s 395 FPS in the PUBG benchmark.
- In addition, with a notable lead of 9%, the Core i9-13900KS exhibits exceptional performance in 1% lows with 276 FPS, surpassing the Ryzen 9 7950X’s 252 FPS.
A Plague Tale Requiem
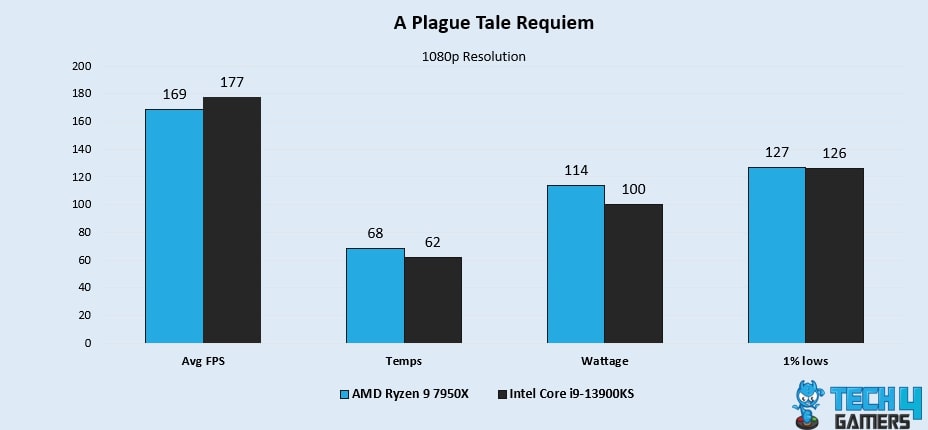
- Next, we notice in A Plague Tale: Requiem benchmark that the Core i9-13900KS outshines the Ryzen 9 7950X by 4.6%, delivering an average FPS of 177 compared to 169 FPS.
- In addition, demonstrating consistent performance, the Core i9-13900KS showcases 1% lows at 126 FPS, with a minimal difference of 0.7% compared to the Ryzen 9 7950X’s 127 FPS.
The Witcher 3
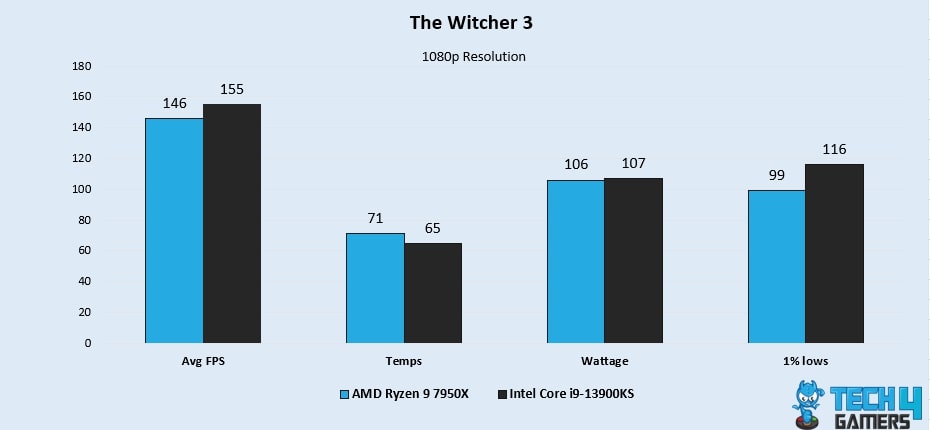
- The final benchmark that we carried out was The Witcher 3, where we witnessed the Core i9-13900KS leading forward with an average FPS of 155 FPS, surpassing the Ryzen 9 7950X’s 146 FPS by 5.9%.
- Furthermore, when it comes to the performance in 1% lows, the Core i9-13900KS delivers 116 FPS, surpassing the Ryzen 9 7950X’s 99 FPS by an impressive 15.8%.
Overall Gaming Performance
| Processor | Average FPS | 1% Lows |
|---|---|---|
| Core i9 13900KS | 📈 247.5 | 📉 175.7 |
| Ryzen 9 7950X | 📈 235 | 📉 165.1 |
| Winner: Core i9 13900KS | ||
When we got to the overall gaming averages, we calculated that when compared to the Ryzen 9 7950X, the Core i9-13900KS showcased 5.1% better average framerates across the eight tested games. In terms of the 1% lows, the Core i9-13900KS had an edge over the Ryzen 9 7950X by 6.2%.
Power Consumption
| Games | Core i9 13900KS (W) | Ryzen 9 7950X (W) |
|---|---|---|
| Average Power Consumption | 111 ⚡️ | 103.8⚡️ |
| Winner: Ryzen 9 7950X | ||
The average power consumption results followed the trail of the average 1% low as they were quite similar. With its high performance, the Core i9-13900KS also consumes slightly more power, averaging 7.2W more to be precise, making the R9 7950X 6.7% more power efficient than the Intel i9-13900KS.
Thermal Statistics
| Games | Core i9 13900KS (°C) | Ryzen 9 7950X (°C) |
|---|---|---|
| Average Thermal Capacity | 61.6 🌡️ | 68.6 🌡️ |
| Winner: Core i9 13900KS | ||
In terms of the temperatures, we observed in the gaming benchmarks that the Core i9 13900KS performs at a slightly lower temperature than the Ryzen 9 7950X, with a difference of about 7°C to be exact on average. The Core i9 13900KS operated precisely 10.7% cooler than the Ryzen 9 7950X
Pricing And Availability
| CPU | MSRP | Current Price |
|---|---|---|
| Core i9 13900KS | 💲699 | 💲643 |
| Ryzen 9 7950X | 💲699 | 💲594 |
| Price Difference | - | 7.9% |
We see a price decrease regarding both CPUs in 2024. While the Core i9 13900KS’s price has been reduced by 8.3% over the years, the price of the Ryzen 9 7950X has been decreased by a staggering 16.2%, almost double. This makes the Ryzen 9 7950X 7.9% cheaper than the Intel i9 13900KS.
Ryzen 9 7950X Vs Core i9 13900KS: Which One To Buy?
Ryzen 9 7950X: Regarding pricing, the Ryzen 9 7950X offers a more budget-friendly option with a much lower price than the Core i9 13900KS. It consumes less power but that comes at the expense of a slightly higher average temperature. Still, we recommend it to the users who are on a budget.
Core i9 13900KS: The Core i9 13900KS poses as an option for hardcore gamers and enthusiasts who want relentless gaming performance over anything. Given its slightly higher price, you get a lot of performance along with thermal efficiency, which makes it a suitable option to go for in our opinion.
We recommend you go for the Ryzen 9 7950X if you have a budget in mind and go for the Core i9 13900KS if you want extreme performance. However, you’re left with choices and whichever choice aligns with your priorities, your budget, and your preference should be the one that you should acquire.
More From Intel i9-13900KS
More From Ryzen 9 7950X:
Thank you! Please share your positive feedback. 🔋
How could we improve this post? Please Help us. 😔
[Comparisons Expert]
Shehryar Khan, a seasoned PC hardware expert, brings over five years of extensive experience and a deep passion for the world of technology. With a love for building PCs and a genuine enthusiasm for exploring the latest advancements in components, his expertise shines through his work and dedication towards this field. Currently, Shehryar is rocking a custom loop setup for his built.
Get In Touch: shehryar@tech4gamers.com


