 Threads

Having explored the performance gap between RTX 4070 Vs RX 7900 XTX in our previous analysis, we now shift our attention to NVIDIA’s own backyard. The focus turns to the GeForce RTX 2070 SUPER vs RTX 3070 Ti, where we delve into the performance disparity between these two graphics cards.
Key Takeaways
- Notably, the GeForce RTX 2070 SUPER is based on Turing architecture, while the GeForce RTX 3070 Ti utilizes the advanced Ampere architecture.
- Additionally, in our benchmark tests, the RTX 3070 Ti consistently outperforms the RTX 2070 SUPER with an average FPS production that is 24.4% higher.
- On the other hand, our testing results reveal that the RTX 3070 Ti consumes approximately 34.9% more power than the GeForce RTX 2070 SUPER.
- In conclusion, our analysis showed that the RTX 3070 Ti exhibited a 10.4% lower thermal efficiency compared to the RTX 2070 SUPER.
Comparison Table
| Technical Specs | GeForce RTX 2070 SUPER | GeForce RTX 3070 Ti |
| GPU Name | TU104 | GA104 |
| Architecture | Turing | Ampere |
| Transistors | 13,600 million | 17,400 million |
| Shading Units | 2560 | 6144 |
| Tensor Cores | 320 | 192 |
| RT Cores | 40 | 48 |
| TMUs | 160 | 192 |
| ROPs | 64 | 96 |
| L1 Cache | 64 KB (per SM) | 128 KB per Array |
| L2 Cache | 4 MB | 4 MB |
| Memory Bus Width | 256 bit | 256 bit |
| Memory Bandwidth | 448.0 GB/s | 608.3 GB/s |
| Suggested PSU | 550W | 600W |
| Release Date | Jul 9th, 2019 | May 31st, 2021 |
| Approximated Price | 499 USD | 360 USD |
| Best Variants | BEST RTX 3070 Ti Cards |
Architectural Difference
- Process Node: The RTX 2070 SUPER utilizes a 12nm process node, while the RTX 3070 Ti takes advantage of a more advanced 8nm process node, potentially leading to better performance and power efficiency.
- Clock Speed: With a base clock of 1605 MHz and a boost clock of 1770 MHz, the RTX 2070 SUPER offers competitive clock speeds. In contrast, the RTX 3070 Ti shares the same boost clock of 1770 MHz but has a slightly lower base clock at 1575 MHz.
- VRAM: Both graphics cards come equipped with 8GB of VRAM, but it’s important to note that the RTX 3070 Ti features faster GDDR6X memory, potentially resulting in improved memory performance.
- TDP: The RTX 2070 SUPER carries a 215W TDP, while the RTX 3070 Ti has a higher TDP of 290W. This could impact power consumption and thermal management.
- Supported Technologies: Both GPUs support DLSS, a technology that enhances gaming performance by using AI-powered upscaling, potentially providing a smoother gaming experience.
RTX 2070 SUPER Vs RTX 3070 Ti: Gaming Benchmarks
To conduct a comprehensive evaluation, we will delve into an in-depth comparison between the RTX 3070 Ti vs RTX 2070 SUPER. Our examination will encompass various aspects, including frame rates, temperatures, power consumption, and 1% lows, all scrutinized under the demanding settings of 1080p ultra.
Testing Rig
Here are the specs of the testing rig:
- OS: Windows 11
- CPU: Intel Core i7 13700k
- Motherboards: MSI MEG Z790 ACE MAX
- RAM: G.Skill Trident Z5 RGB 32GB DDR5-6600 CL34 Kit
- SSD: XPG Gammix S70 BLADE 2TB NVMe
- PSU: Enermax Revolution D.F. X 1050W
- CPU Cooler: Arctic Liquid Freezer II 360
Note: It’s important to note that benchmark tests can be influenced by external factors such as ambient temperature, airflow, and background processes running simultaneously. These variables can introduce a certain degree of variability, so it is crucial to interpret the results as close estimations.
Without further delay, let’s delve into the RTX 2070 SUPER vs RTX 3070 Ti gaming benchmarks and directly compare the performance of the two GPUs.
CYBERPUNK 2077
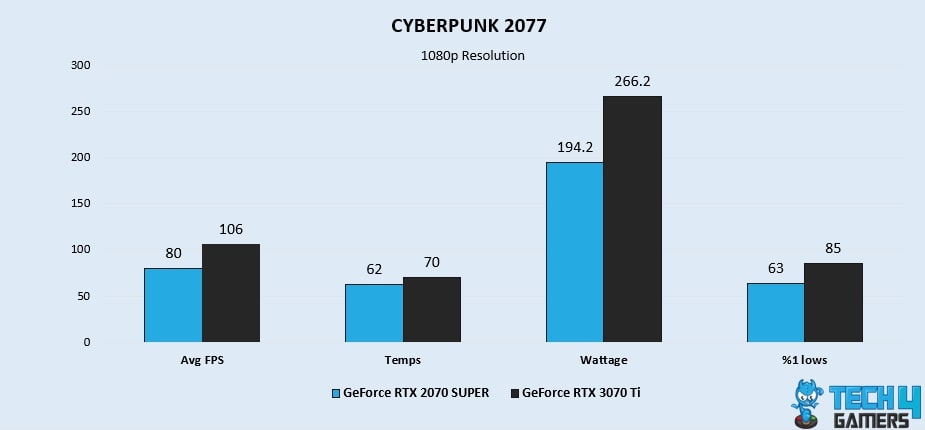
- Firstly, the RTX 3070 Ti establishes its superiority in our tests with a remarkable 27.9% average FPS boost, outperforming the RTX 2070 SUPER by achieving an impressive 106 FPS compared to 80 FPS.
- Additionally, the RTX 3070 Ti exhibits higher temperatures compared to the RTX 2070 SUPER, with an average of 70°C, showing a 12.1% disadvantage compared to the latter’s cooler temperature of 62°C.
- Moreover, the RTX 2070 SUPER showcases impressive power efficiency, consuming only 194.2 W, significantly lower than the RTX 3070 Ti’s higher power draw of 266.2 W, resulting in a substantial 31.2% difference.
- Furthermore, the RTX 3070 Ti outperforms the RTX 2070 SUPER during our benchmarks, with a significant 29.7% increase in 1% lows, reaching 85 FPS compared to 63 FPS.
Resident Evil 4
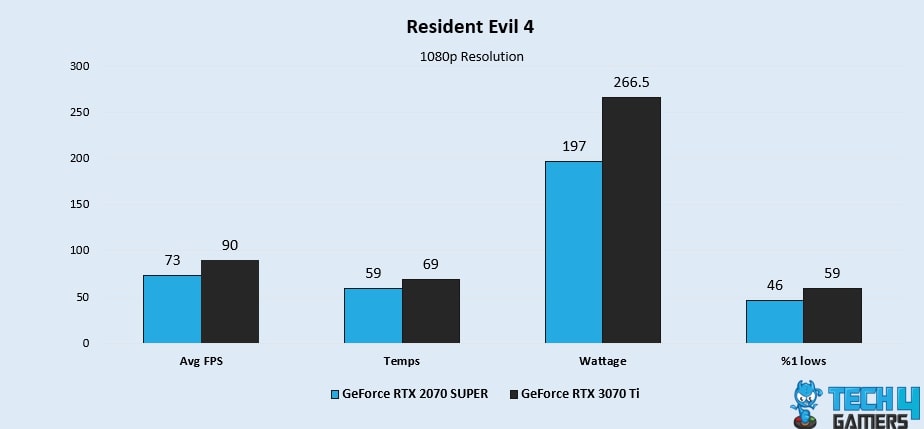
- On the performance front, we saw an exceptional 20.8% increase in average FPS. The RTX 3070 Ti showcases its dominance, surpassing the RTX 2070 SUPER with a remarkable 90 FPS compared to 73 FPS.
- Moreover, the RTX 3070 Ti showcases inferior thermal performance, with an average temperature of 69°C, presenting a noteworthy 15.6% shortfall compared to the cooler 59°C maintained by the RTX 2070 SUPER.
- Additionally, the RTX 2070 SUPER demonstrates superior power efficiency based on our findings, with a consumption of just 197 W, presenting a significant 29.9% advantage over the RTX 3070 Ti’s higher power draw of 266.5 W.
- Furthermore, the RTX 3070 Ti showcases superior performance over the RTX 2070 SUPER, boasting a remarkable 24.7% increase in 1% lows, delivering a smooth 59 FPS compared to 46 FPS.
Forza Horizon 5
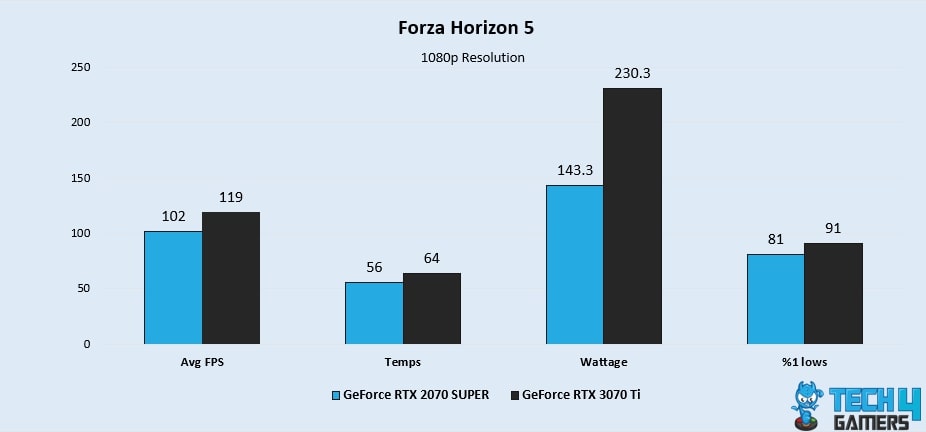
- Starting with a performance comparison in our Forza Horizon 5 gameplay, the RTX 3070 Ti sets itself apart by delivering an impressive 15.3% average FPS improvement, reaching an outstanding 119 FPS compared to the RTX 2070 SUPER’s 102 FPS.
- Furthermore, the RTX 3070 Ti experiences elevated temperatures, averaging 64°C, which is 13.3% higher than the RTX 2070 SUPER’s cooler temperature of 56°C.
- Moreover, the RTX 2070 SUPER exhibits remarkable power efficiency in our examinations, consuming a mere 143.3 W, showcasing a considerable 46.5% disparity compared to the RTX 3070 Ti’s higher power consumption of 230.3 W.
- Additionally, the RTX 3070 Ti demonstrates its superiority with an impressive 11.6% increase in 1% lows, achieving 91 FPS compared to the RTX 2070 SUPER’s 81 FPS.
Red Dead Redemption 2
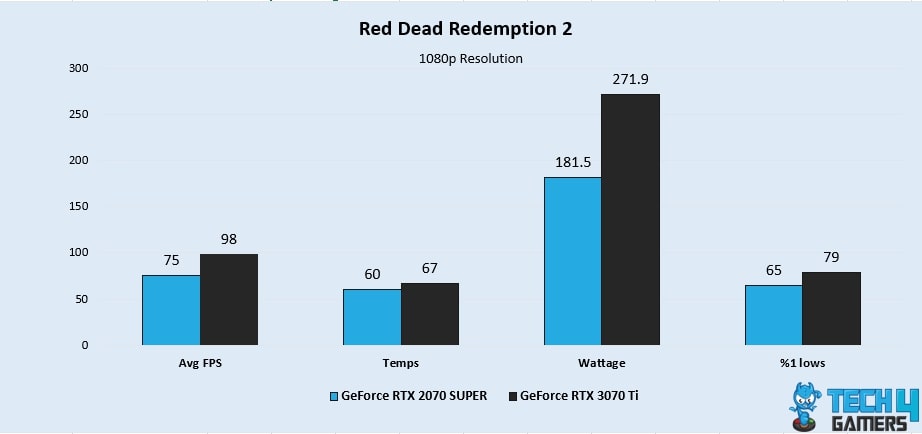
- Making its mark on performance, we saw the RTX 3070 Ti establish its performance dominance with a significant 26.5% boost in average FPS, outshining the RTX 2070 SUPER with an impressive 98 FPS compared to 75 FPS.
- Additionally, the RTX 3070 Ti demonstrates suboptimal thermal efficiency, with an average temperature of 67°C, indicating a significant 11% disadvantage compared to the RTX 2070 SUPER’s lower temperature of 60°C.
- Furthermore, the RTX 3070 Ti exhibits higher power consumption, drawing 271.9 W, in contrast to the RTX 2070 SUPER’s superior power efficiency, consuming only 181.5 W, resulting in a notable 39.8% difference.
- Moreover, the RTX 2070 SUPER lags behind the RTX 3070 Ti in our performance benchmark, with a noticeable 19.4% lower 1% lows, delivering only 65 FPS compared to the 79 FPS achieved by the latter.
Hogwarts Legacy

- Stepping into the realm of performance, we noticed the RTX 3070 Ti exhibits its superiority by delivering an impressive 32.9% increase in average FPS, achieving a remarkable 113 FPS compared to the RTX 2070 SUPER’s 81 FPS.
- Moreover, the RTX 2070 SUPER maintains cooler temperatures, averaging at 63°C, providing a distinct advantage over the RTX 3070 Ti’s higher temperature of 67°C, with a 6.1% difference.
- Additionally, the RTX 3070 Ti demonstrates a higher power draw in our benchmarks, consuming 266.9 W, while the RTX 2070 SUPER exhibits superior power efficiency, consuming only 197.5 W, indicating a significant 29.8% disparity.
- Furthermore, the RTX 2070 SUPER falls short in performance compared to the RTX 3070 Ti, with a significant 28.9% decrease in 1% lows, resulting in a lower gaming experience at 65 FPS compared to 87 FPS.
Spider-Man: Miles Morales
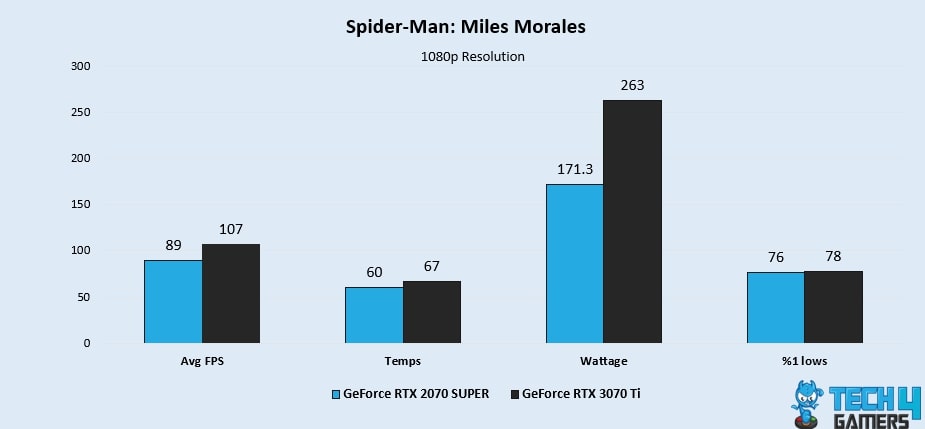
- Delving into performance comparisons, with a noteworthy 18.3% average FPS improvement, the RTX 3070 Ti demonstrates its dominance by surpassing the RTX 2070 SUPER with an impressive 107 FPS compared to 89 FPS.
- Furthermore, the RTX 2070 SUPER showcases superior thermal efficiency in our findings, with an average temperature of 60°C, presenting an 11% advantage over the RTX 3070 Ti, which experiences higher temperatures at 67°C.
- Moreover, the RTX 3070 Ti showcases a higher power consumption of 263 W in our tests, in contrast to the RTX 2070 SUPER’s impressive power efficiency, which only requires 171.3 W, resulting in a substantial 42.2% difference.
- Additionally, the RTX 2070 SUPER exhibits inferior performance compared to the RTX 3070 Ti, with a 2.5% decrease in 1% lows, delivering a less immersive gaming experience at 76 FPS compared to 78 FPS.
The Witcher 3
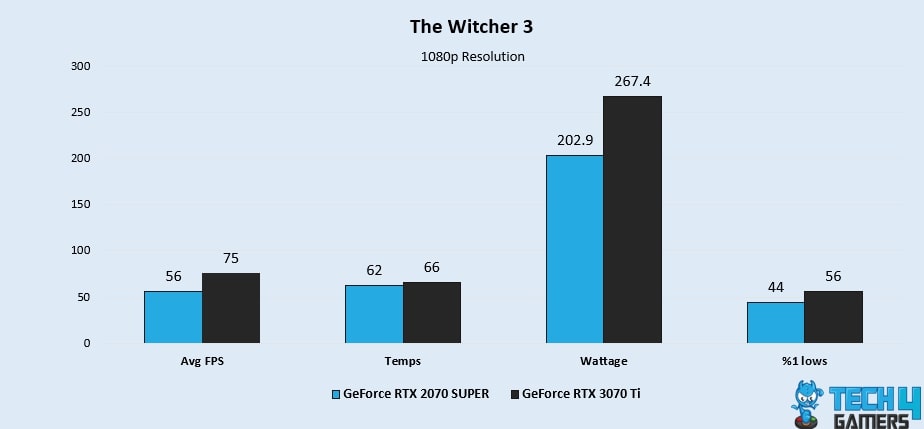
- Turning our attention to performance front of our gameplay, the RTX 3070 Ti showcases its superiority with an exceptional 29% average FPS boost, outperforming the RTX 2070 SUPER by reaching an impressive 75 FPS compared to 56 FPS.
- Additionally, the RTX 2070 SUPER exhibits efficient thermal management, with an average temperature of 62°C, revealing a significant 6.2% advantage compared to the RTX 3070 Ti’s elevated temperature of 66°C.
- Moreover, the RTX 2070 SUPER displays outstanding power efficiency during our examinations, consuming a mere 202.9 W, providing a significant 27.4% advantage over the RTX 3070 Ti’s higher power draw of 267.4 W.
- Furthermore, the RTX 3070 Ti surpasses the RTX 2070 SUPER in performance, showing an impressive 24% increase in 1% lows, delivering a smoother gaming experience at 56 FPS compared to the 44 FPS achieved by the latter.
Microsoft Flight Simulator
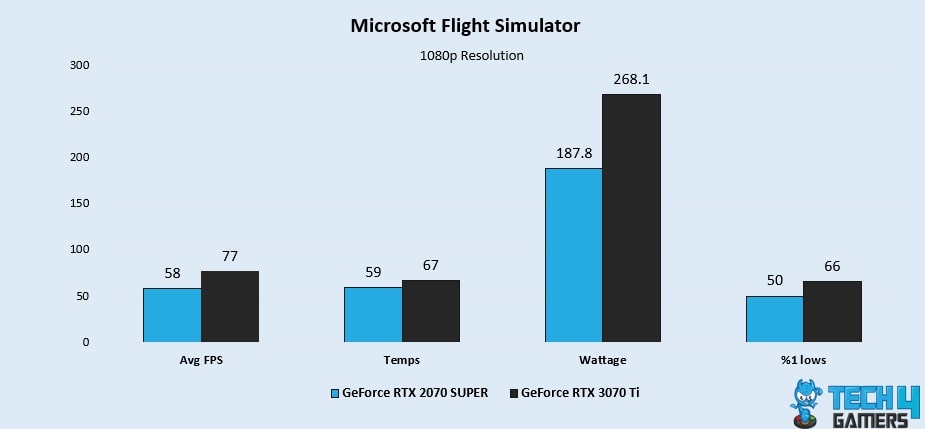
- When it comes to performance, we noticed similarly the RTX 3070 Ti establishes its dominance again by delivering a remarkable 28.1% increase in average FPS, surpassing the RTX 2070 SUPER with an impressive 77 FPS compared to 58 FPS.
- Moreover, the RTX 2070 SUPER maintains cooler thermal levels, averaging at 59°C, demonstrating a substantial 12.6% advantage over the RTX 3070 Ti, which experiences higher temperatures at 67°C.
- Additionally, the RTX 2070 SUPER demonstrates superior power efficiency as per our tests, consuming only 187.8 W, presenting a notable 35.2% disparity compared to the RTX 3070 Ti’s higher power consumption of 268.1 W.
- Furthermore, the RTX 3070 Ti demonstrates its dominance over the RTX 2070 SUPER with an outstanding 27.5% increase in 1% lows, ensuring a more immersive gaming experience at 66 FPS compared to 50 FPS.
Overall Gaming Performance
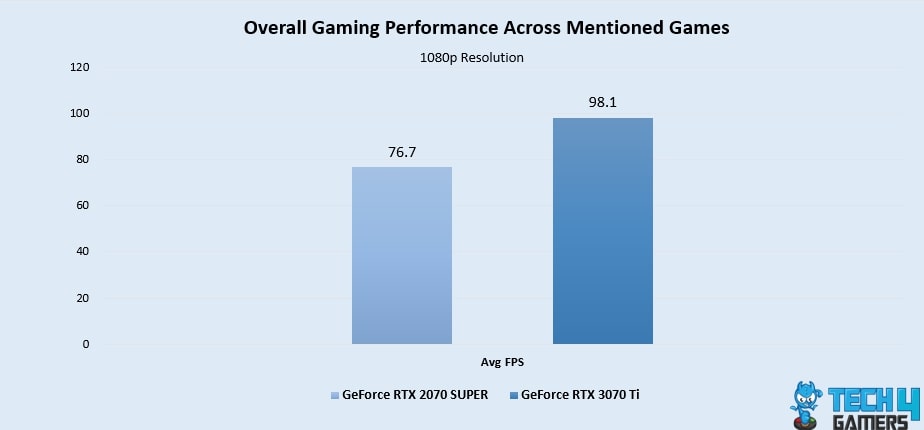
Upon conducting an extensive analysis of our benchmark tests, it becomes evident that one graphics card emerges as the clear winner in the performance battle between the RTX 2070 SUPER and RTX 3070 Ti.
- Firstly, we found the RTX 3070 Ti outperforms the RTX 2070 SUPER in FPS and 1% lows across all games.
- Furthermore, the RTX 3070 Ti outperforms the RTX 2070 SUPER with an average FPS of 98.1, compared to 76.7 FPS in our benchmark tests.
- Moreover, the RTX 3070 Ti exhibits a noteworthy 24.4% performance advantage over the RTX 2070 SUPER in terms of FPS, solidifying its position as the superior option for avid gamers.
Average Power Consumption
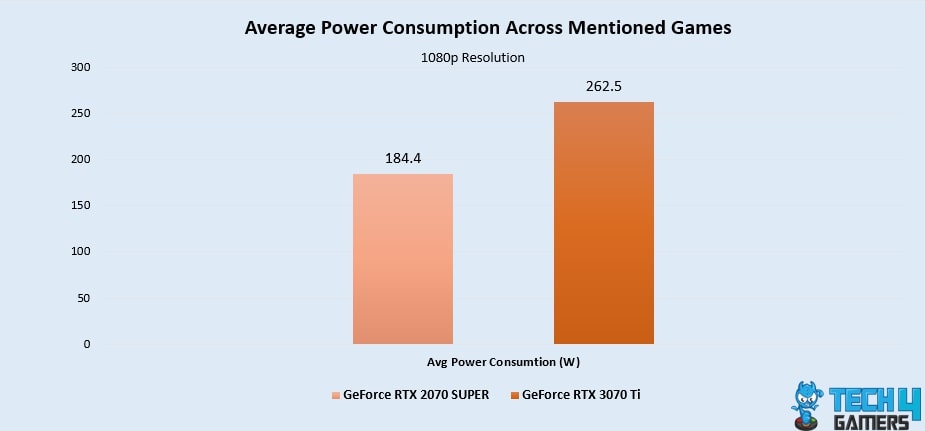
When searching for the perfect graphics card, finding a balance between performance and power efficiency is crucial. Our thorough investigation of the power consumption of the RTX 2070 SUPER and the RTX 3070 Ti has revealed some interesting insights.
- Starting off, our rigorous benchmark testing revealed a consistent trend of higher power consumption by the RTX 3070 Ti compared to the RTX 2070 SUPER.
- Additionally, it is worth noting that the RTX 2070 SUPER exhibits a notable power efficiency advantage of 34.9% over the RTX 3070 Ti, with an average power consumption of 184.4 W compared to 262.5 W.
Average Thermal Statistics
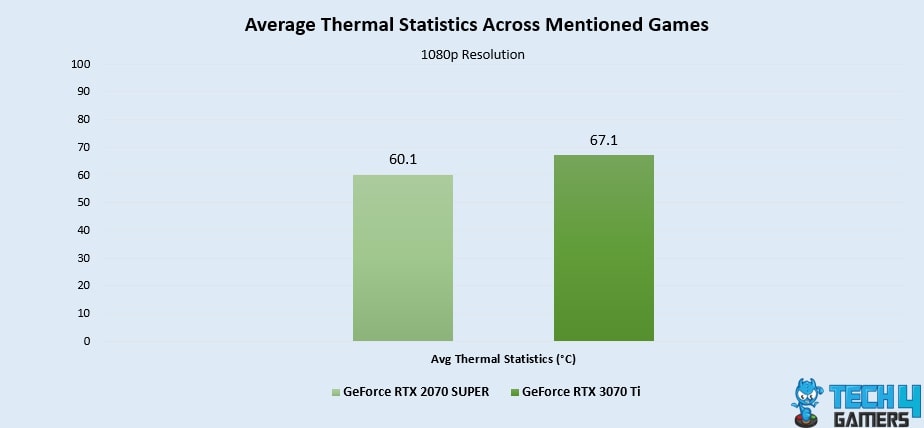
The temperature of a graphics card is a crucial factor that affects its performance and longevity. Through our analysis of thermal statistics, we have gained valuable insights into the performance of the RTX 2070 SUPER vs RTX 3070 Ti.
- In our benchmark tests, the RTX 3070 Ti exhibited lower thermal efficiency compared to the RTX 2070 SUPER due to its higher power consumption.
- Moreover, based on our findings, the RTX 2070 SUPER maintained a consistently lower temperature at an average of 60.1°C, while the RTX 3070 Ti exhibited a higher average temperature of 67.1°C.
- In summary, our benchmark tests revealed that the RTX 2070 SUPER showcased superior thermal efficiency, outperforming the RTX 3070 Ti by 11%.
Pricing And Availability
Throughout our comprehensive evaluation of the GeForce RTX 2070 SUPER and RTX 3070 Ti, we extensively examined the crucial aspects of pricing and availability, considering their status as exceptional GPUs from NVIDIA’s esteemed lineup.
- As we scoured various reputable retailers like Newegg, we discovered the GeForce RTX 2070 SUPER listed at an approximate price point of $675, while the GeForce RTX 3070 Ti demanded a higher cost of around $800.
- Moreover, it is worth noting that the GeForce RTX 3070 Ti carries a price tag that is approximately 16.9% higher than that of the RTX 2070 SUPER.
- However, it is crucial to recognize that these prices are subject to market fluctuations and can vary based on factors such as supply and demand.
What We Recommend
- Despite a 16.7% price difference, the RTX 2070 SUPER falls short in performance compared to the RTX 3070 Ti, which boasts a remarkable 24.4% increase in average FPS production.
- Moreover, the RTX 3070 Ti exhibits an 11% higher average temperature compared to the RTX 2070 SUPER, while the latter consumes 34.9% less power, making it a more energy-efficient option.
- While the RTX 2070 SUPER is a cost-effective graphics card, the RTX 3070 Ti boasts impressive performance capabilities.
So, if you prioritize gaming performance and are willing to invest a bit more, the RTX 3070 Ti is the clear winner of our recommendation. However, if you have a strict budget and value energy efficiency, the RTX 2070 SUPER remains a cost-effective choice, in our opinion, without significant compromises in performance.
Pros And Cons
| GPU | Pros | Cons |
|---|---|---|
| GeForce RTX 2070 SUPER |
|
|
| GeForce RTX 3070 Ti |
|
|
More From RTX 3070 Ti:
More From RTX 2070 SUPER:
Thank you! Please share your positive feedback. 🔋
How could we improve this post? Please Help us. 😔
[Comparisons Expert]
Shehryar Khan, a seasoned PC hardware expert, brings over five years of extensive experience and a deep passion for the world of technology. With a love for building PCs and a genuine enthusiasm for exploring the latest advancements in components, his expertise shines through his work and dedication towards this field. Currently, Shehryar is rocking a custom loop setup for his built.
Get In Touch: shehryar@tech4gamers.com


