

When buying a graphics card from generations past, it is always a dilemma to either get a more recent mid-ranged GPU or an older flagship. Our comparison of the RTX 3070 Ti vs RTX 2080 Ti will answer this question once and for all.
Key Takeaways
- The RTX 3070 Ti was around 10% faster than the RTX 2080 Ti in our testing of these two cards.
- In our testing, the RTX 3070 Ti consumed around 7.5% less power on average than the RTX 2080 Ti.
- You can find some models of the RTX 3070 Ti for as low as $360 on sites like Newegg, whereas the RTX 2080 Ti can be had around $440.
RTX 3070 Ti Vs RTX 2080 Ti
Comparison Table
| Specifications | RTX 3070 Ti | RTX 2080 Ti |
| Release Date | May 31st, 2021 | Sep 20th, 2018 |
| Generation | GeForce 30 | GeForce 20 |
| Outputs | 1x HDMI 2.1, 3x DP 1.4a | 1x HDMI, 3x DP, 1x USB-C |
| Power Connectors | 1x 12-pin | 2x 8-pin |
| Memory Clock Speed | 1188 MHz | 1750 MHz |
| Pixel Fillrate | 169.9 GPixel/s | 136 GPixel/s |
| Texture Fillrate | 339.8 GTexel/s | 420.2 GTexel/s |
| Best Variants | RTX 3070 Ti Graphics Cards | – |
Architectural Differences
- TDP: The RTX 3070 Ti has a power consumption of 290 watts, indicating its power requirements. In contrast, the RTX 2080 Ti consumes slightly less power at 250 watts, making it more power-efficient.
- Clock Speeds: The RTX 3070 Ti operates with a base clock speed of 1575MHz and a boost clock speed of 1770MHz, providing strong gaming performance. The RTX 2080 Ti, while having a lower base clock of 1350MHz, offers a boost clock of 1545MHz, which may result in slightly lower gaming performance, depending on the core configuration.
- VRAM: The RTX 3070 Ti features 8GB of GDDR6X VRAM, which allows for smooth gaming at high resolutions and settings. In comparison, the RTX 2080 Ti boasts a larger VRAM capacity with 11GB of GDDR6 memory, offering more memory for resource-intensive tasks and 4K gaming.
- Memory Bus Width: The RTX 3070 Ti has a 256-bit memory bus, which helps with fast data transfer and contributes to its gaming performance. The RTX 2080 Ti, on the other hand, features a wider 352-bit memory bus, which can be advantageous for tasks involving large data sets.
- Memory Bandwidth: The RTX 3070 Ti has a memory bandwidth of 608.3 GB/s, which allows for quick data access and high-performance gaming. The RTX 2080 Ti offers a slightly higher memory bandwidth of 616 GB/s, contributing to its ability to handle demanding graphics tasks effectively.
Also Read: RTX 3060 vs. RTX 3070
Gaming Benchmarks
It is important to see the real-world performance of cards before you buy one, which is why we have congregated some benchmarks with the test bench mentioned below:
- OS: Windows 11
- CPU: Intel Core i7-13700K
- Motherboards: ASRock Z790 Taichi Lite Motherboard
- RAM: Kingston Fury Renegade RGB DDR5 32GB 7200MHz
- SSD: XPG GAMMIX S70 BLADE 2TB NVMe SSD
- PSU: Enermax Revolution D.F. X 1050W
- CPU Cooler: MSI MAG CORELIQUID E360 CPU Liquid Cooler
Days Gone
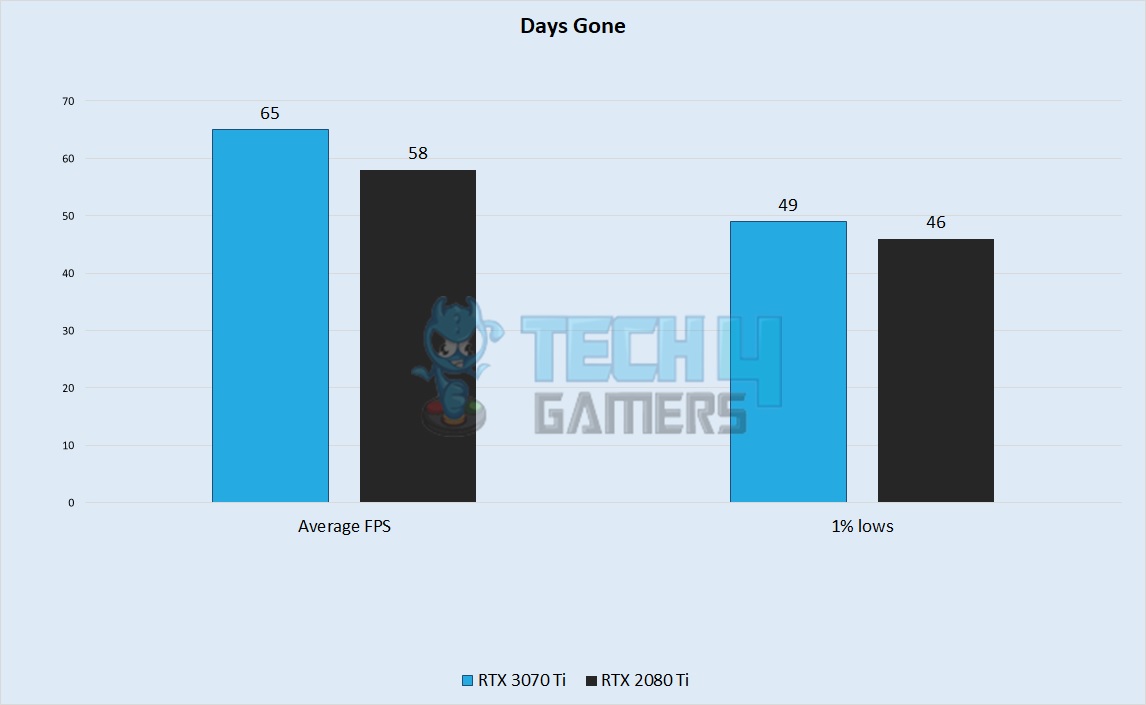
- The RTX 3070 Ti came out in our testing of these cards with an average framerate of 65 FPS, whereas the RTX 2080 Ti had an average framerate of 58 FPS, which is noticeably lower than the newer card.
- The 1% lows had a noticeable difference between the two in our test as well, with the RTX 2080 Ti with a minimum framerate of 46 FPS, whereas the RTX 3070 Ti had a minimum framerate of around 49 FPS.
Microsoft Flight Simulator
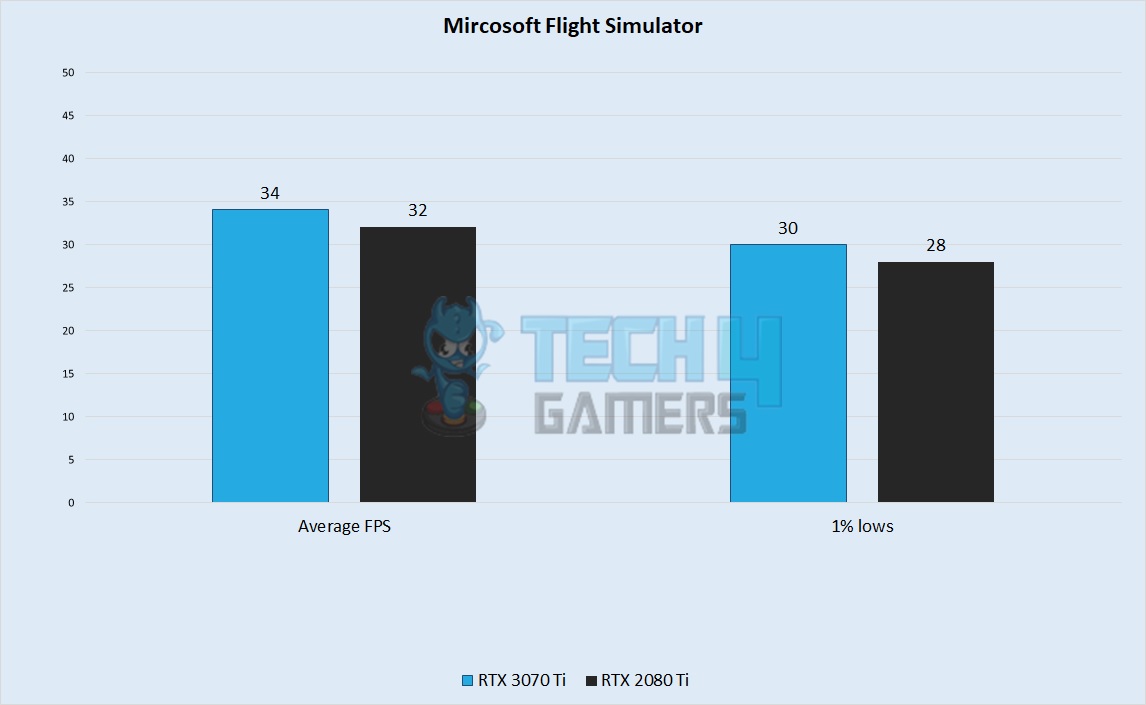
- The averages on both graphics cards were pretty low on both cards in our testing, with a 32 FPS average on the RTX 2080 Ti, whereas the RTX 3070 Ti had an average of 34 FPS.
- The lows had the same delta in our test of MS Flight Sim. The 1% lows were around 28 FPS on the RTX 2080 Ti, whereas the RTX 3070 Ti had a minimum framerate of around 30 FPS.
Death Stranding

- There was a clear difference between the two cards in Death Stranding. The RTX 2080 Ti had an average framerate of 100 FPS, whereas the RTX 3070 Ti had a higher average of 109 FPS.
- The lows were more close in our test. The RTX 2080 Ti had lows of around 92 FPS, whereas the minimums of the RTX 3070 Ti had lows of around 95 FPS.
Cyberpunk 2077
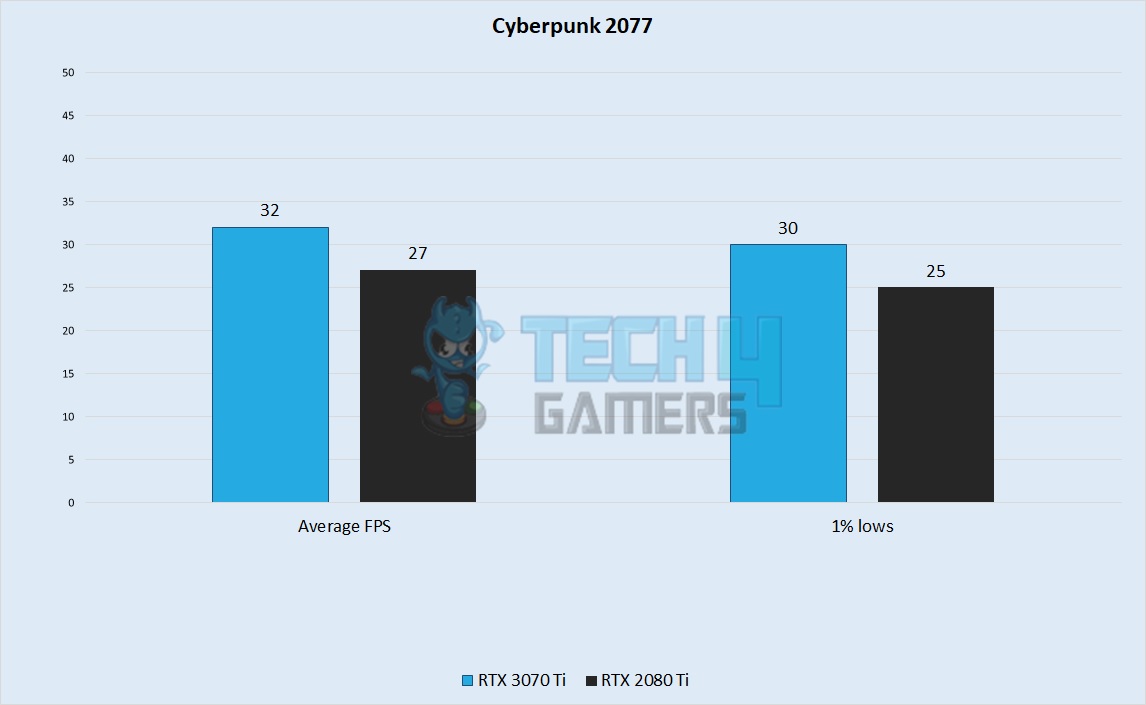
- The framerates in Cyberpunk 2077 were also relatively on both cards, with the RTX 2080 Ti averaging 27 FPS, whereas the RTX 3070 Ti had an average of 32 FPS.
- The lows had the performance of the RTX 2080 Ti noticeably choppier than its competition, The newer card had minimums of around 30 FPS, whereas the RTX 2080 Ti had minimums of 25 FPS.
Horizon Zero Dawn
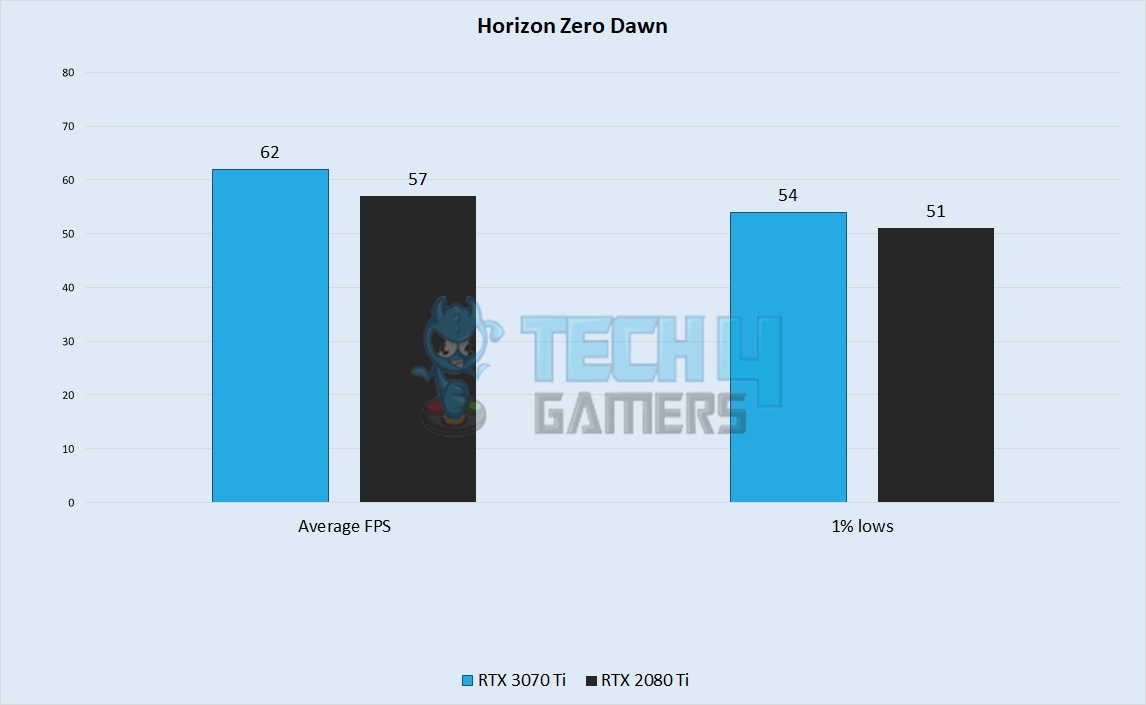
- Averages were once again better on the newer card, around 62 FPS, compared to the 57 FPS average reported by our test of the RTX 2080 Ti.
- There was a small difference between these cards in terms of 1% lows, with the RTX 2080 Ti getting a minimum fo 51 FPS, while the RTX 3070 Ti had minimums of 54 FPS.
Related: NVIDIA GeForce RTX 2060 vs. AMD Radeon RX Vega 56
Assassin’s Creed Valhalla

- Our tests reported a 47 FPS average for the RTX 3070 Ti in AC: Valhalla, whereas the RTX 2080 Ti had an average of around 42 FPS.
- The 1% lows were noticeably different between our two cards, with the RTX 2080 Ti getting a minimum of around 35 FPS, while the RTX 3070 Ti tuckered out at a minimum of 37 FPS.
Control
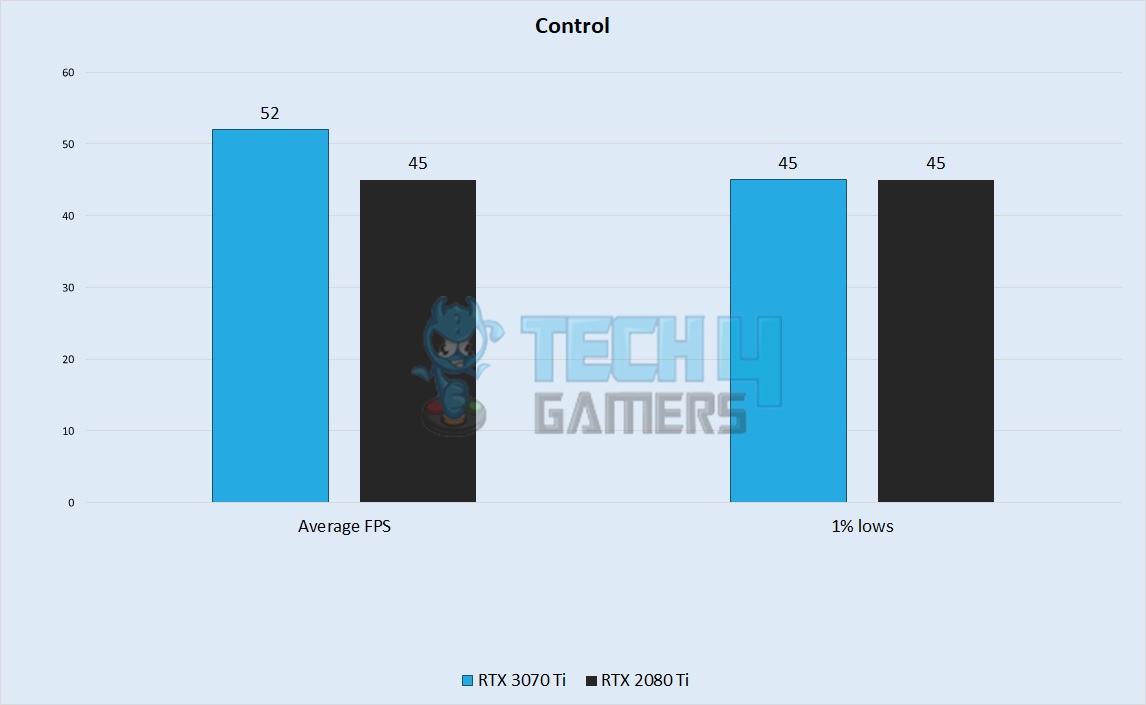
- The average framerates had a noticeable difference in our testing of these cards, with the RTX 2080 Ti averaging 45 FPS, whereas the RTX 3070 Ti averaged 52 FPS.
- The 1% lows were the same between the two cards, with both these cards plateauing out at 45 FPS.
Red Dead Redemption 2
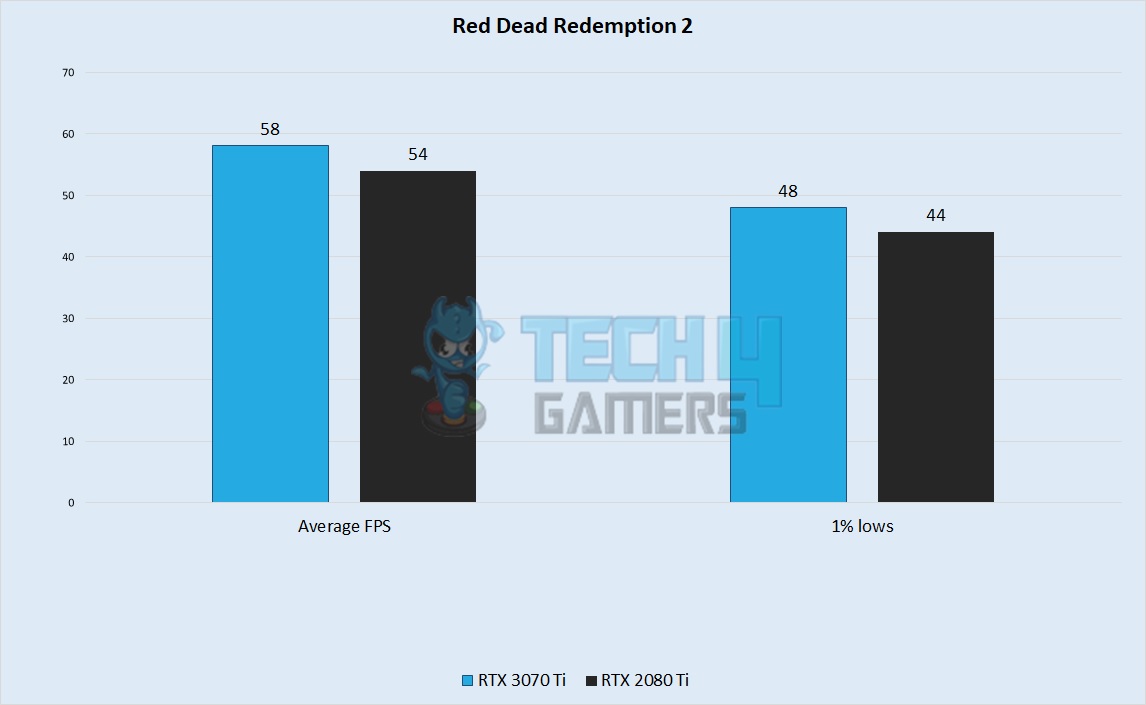
- RDR ran acceptably in our test with both these cards, with an average of around 54 FPS on the RTX 2080 Ti, whereas the RTX 3070 Ti had an average framerate of 58 FPS.
- The 1% lows also had four frames of difference in our test, with the RTX 2080 Ti getting a minimum framerate of around 44 FPS, while the RTX 3070 Ti had a minimum framerate of close to 48 FPS.
Forza Horizon 4
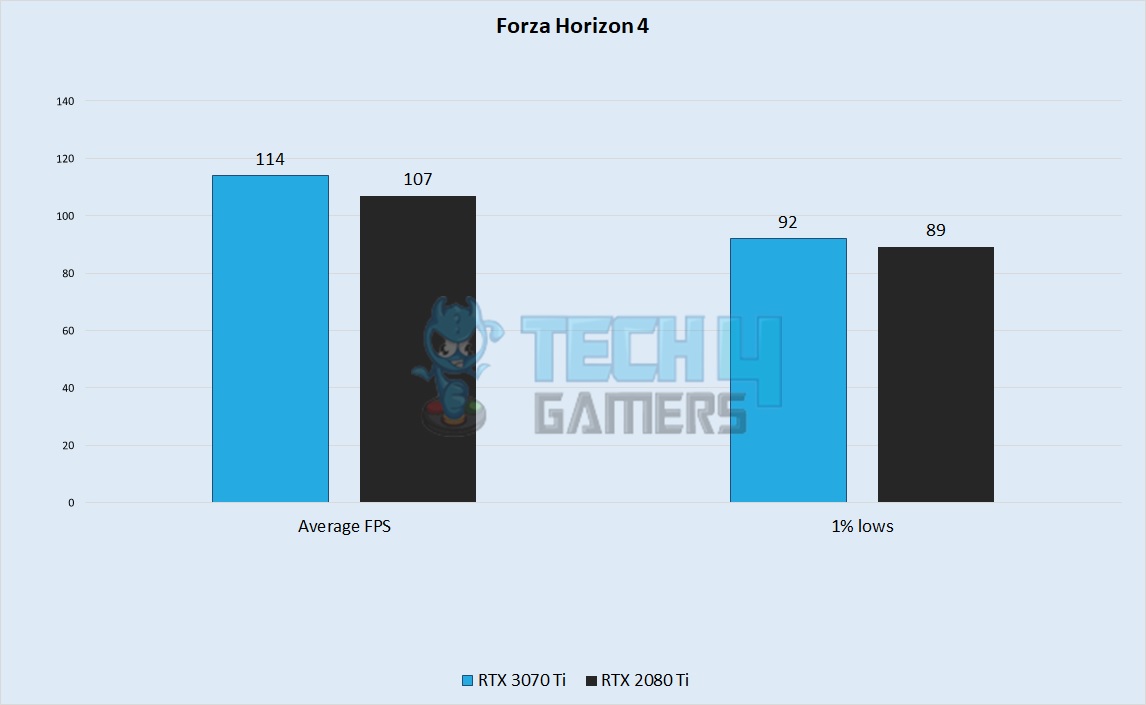
- The RTX 3070 Ti averaged a framerate of around 114 FPS in our test, while the RTX 2080 Ti had an average framerate of 107 FPS.
- The lows were not noticeably different between the two cards, with the RTX 2080 Ti going down to 89 FPS, while the RTX 3070 Ti had a minimum framerate of around 92 FPS.
Hitman 3
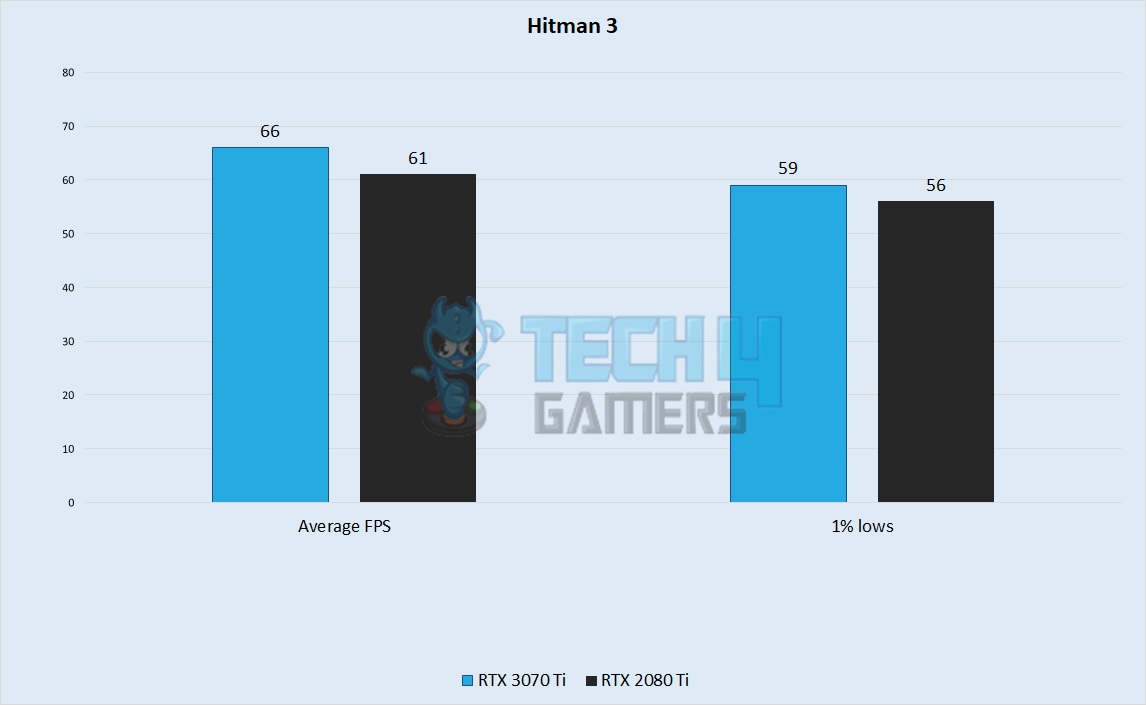
- For the final test of our benchmarks, the RTX 3070 Ti kept is lead through and through with an average framerate of around 66 FPS in Hitman 3, while the RTX 3070 Ti had an average framerate of around 61 FPS.
- 1% lows were also unsurprisingly more fluid on the newer card, with minimums of around 59 FPS, while the RTX 2080 Ti had minimums of around 56 FPS.
Overall Gaming Performance
Framerate
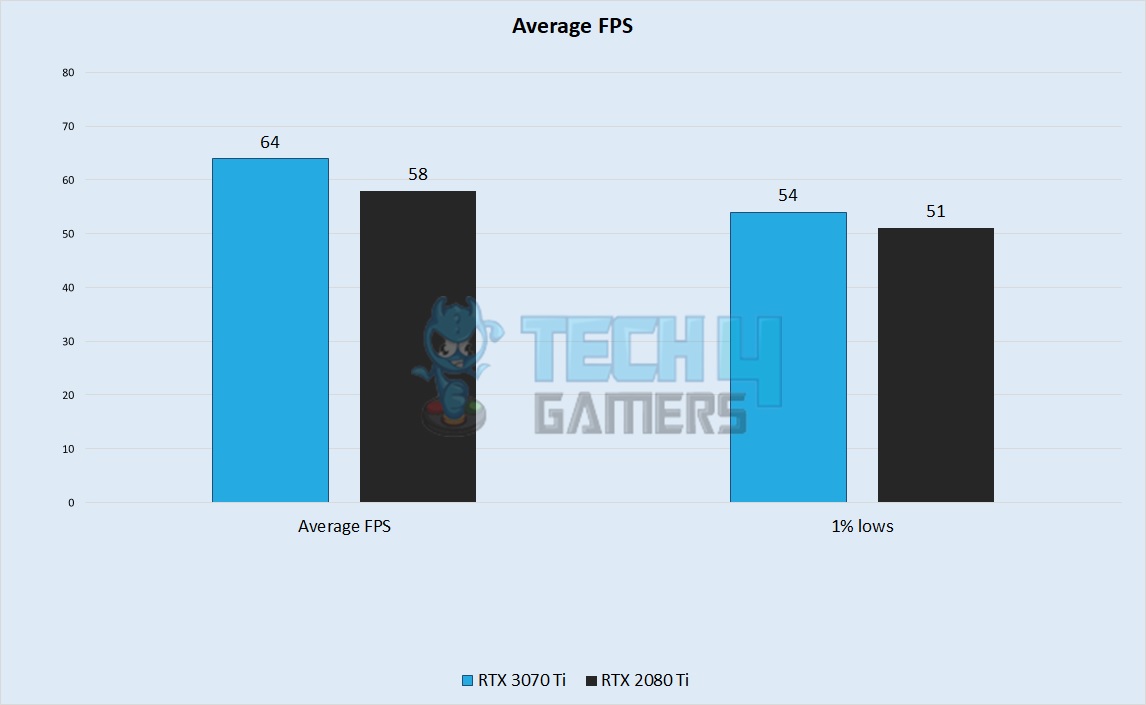
- Our testing showed the RTX 3070 Ti to be around 10% faster than the RTX 2080 Ti, which is a relatively large difference for gamers looking to squeeze the most performance out as possible. The RTX 3070 Ti had an average framerate of 64 FPS in our testing, whereas the RTX 2080 Ti averaged around 58 FPS.
- The 1% lows were also higher in our testing of the newer card, around 54 FPS for the 3070 Ti, while the 2080 Ti had lows of 51 FPS.
Power
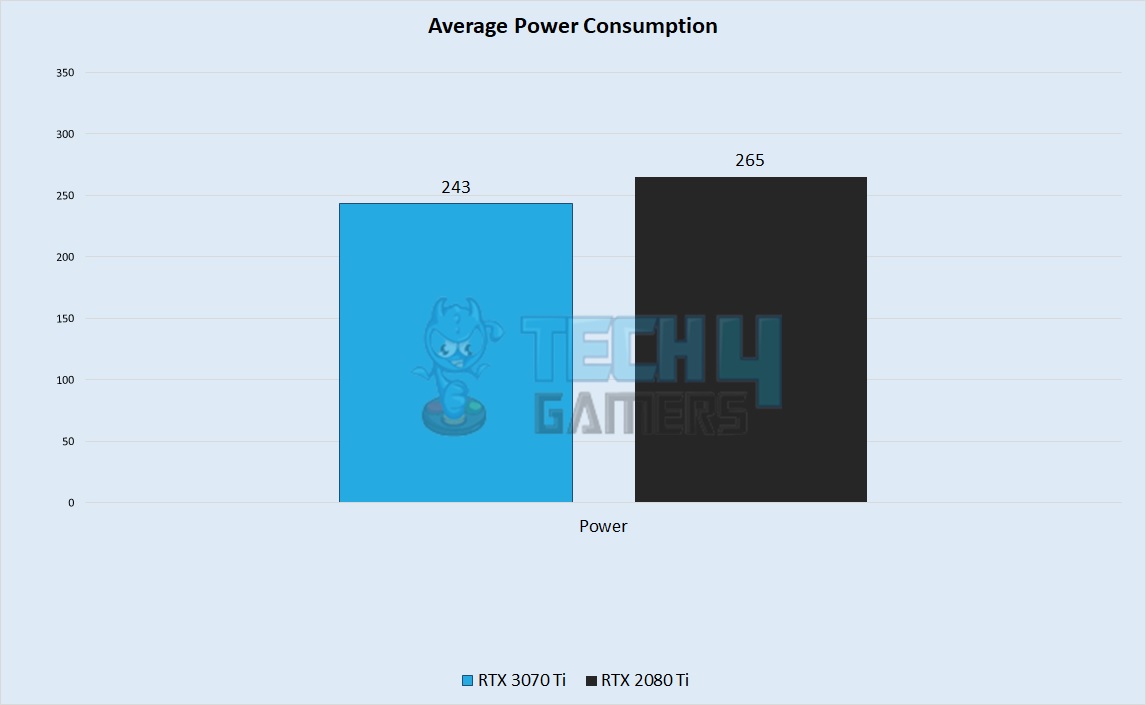
- The average power consumption of our tests also showed the RTX 3070 Ti to be superior, taking aback around 243 watts of power, while the RTX 2080 Ti took around 265 watts on average.
- The power draw of your card depends on whether it is overclocked or not and its cooling solution, so you can expect some slight variation from our numbers in your own setup.
Temperature
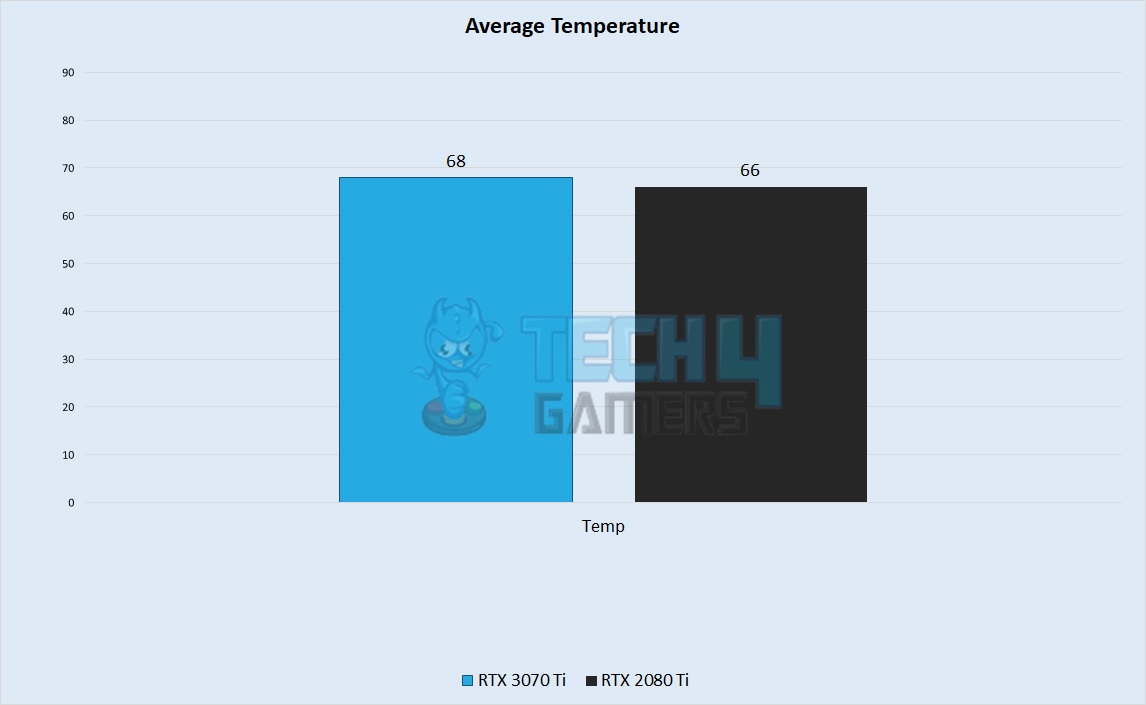
- Temperatures were not a point of concern between the two cards, with the RTX 3070 Ti averaging around 68ºC while the RTX 2080 Ti averaged around 66ºC.
- As with power, these numbers depend on a plethora of factors, so take these numbers with a grain of salt.
Price And Availability
- The RTX 3070 Ti goes for as low as $360 on Newegg, as of writing this video, while the most reasonably priced RTX 2080 Ti we could find was around $440.
- These cards should be available at all computer parts retailers near you.
What We Recommend
Now that we have an understanding of the capabilities of both cards, we will review the RTX 2080 Ti vs RTX 3070 Ti in a broader context in this section of the comparison.
- Out of the tested games, only four achieved a playable frame rate of 60 FPS or higher at 4K resolution. This indicates that neither GPU is ideally suited for gaming at 4K resolution on high settings in all games, potentially necessitating a higher budget for 4K gaming or adjustments in graphic settings.
- In benchmarked games, the RTX 3070 Ti showed a performance advantage over the RTX 2080 Ti, with a difference ranging from 6% to 15% in favor of the RTX 3070 Ti.
- The NVIDIA GeForce RTX 2080 Ti’s significant VRAM and higher RT and tensor core count allow it to perform on par with the RTX 3070 Ti in games that make use of these features. The higher VRAM requirements might cause problems for the RTX 3070 Ti.
- Overall, the RTX 2080 Ti is a better bet for future-proofing, whereas the RTX 3070 Ti’s low VRAM buffer might be problematic.
Also Read: NVIDIA GeForce RTX 2070 Super vs. NVIDIA GeForce RTX 3060
Pros And Cons
| GPU | Pros | Cons |
| GeForce RTX 3070 Ti |
|
|
| GeForce RTX 2080 Ti |
|
|
Thank you! Please share your positive feedback. 🔋
How could we improve this post? Please Help us. 😔
[Comparisons Expert]
Abdemanaf is a skilled creative writer who has been honing his craft since 2011. While initially working in different fields, he found a passion for technology and has been exploring the tech world since early 2015. Over the years, he has developed an in-depth knowledge of the latest tech trends and product offerings by various companies.
Abdemanaf’s writing reflects his analytical mindset and ability to think critically. He has a knack for breaking down complex technical information into easily digestible pieces, making his articles engaging and accessible to readers from all backgrounds. In February 2022, he joined Tech4Gamers as a blog and product comparison writer, where he has been able to hone his skills further.
As a writer, Abdemanaf is dedicated to staying up-to-date with the latest technological advancements and trends, enabling him to provide readers with the most relevant and accurate information. He is always eager to learn more and is constantly seeking new challenges to improve his skills.
Get In Touch: manaf@tech4gamers.com


Feedback By: