")


Nvidia GeForce GTX 1070 Ti
Rated: 8.2/10
Nvidia GeForce RTX 2070 Super
Rated: 8.5/10
Pros And Cons
| GPU | Pros | Cons |
|---|---|---|
| Nvidia RTX 2070 Super | ✅ Good performance in 1440p games ✅ Faster 8GB GDDR6 memory | ❌ Consumes more power ❌ Not capable enough for 4K |
| Nvidia GTX 1070 Ti | ✅ Highly overclockable ✅ Solid VR Performance | ❌ Experiences higher temperatures ❌ Not good enough for 1440p |
- When we played games at 1080p, the GeForce RTX 2070 Super beat the GTX 1070 Ti by approximately 46.7% better frame rates.
- Our testing reveals that the GTX 1070 Ti consumes 7.8% less energy than RTX 2070 Super, while the RTX 2070 Super has 13.1% higher thermal efficiency than the GTX 1070 Ti.
- Regarding GPU cost, the refurbished GTX 1070 Ti is available for about $180, and the refurbished RTX 2070 Super is available for around $300.
- I propose the RTX 2070 Super for optimal gaming excellence, while the GTX 1070 Ti is an economical choice for gaming enthusiasts.
Comparison Table
| Feature | GeForce GTX 1070 Ti | GeForce RTX 2070 Super |
|---|---|---|
| CUDA Cores | 2432 | 2560 |
| ROPs | 64 | 64 |
| Base Clock | 1.607 GHz | 1.61 GHz |
| Boost Clock | 1.683 GHz | 1.77 GHz |
| Memory Bandwidth | 256.3 GB/s | 448 GB/s |
| GPU Power | 180 watt | 215 watt |
| Maximum Temperature | 84°C | 88°C |
Architectural Difference
- Architecture: The Nvidia RTX 2070 Super is infused with the Turing architecture, the successor to the Pascal architecture of the GTX 1070 Ti.
- GPU Chip: Regarding GPU chips, the GTX 1070 Ti is equipped with the GP104 (16nm), while the RTX 2070 Super features the superior TU104 chip (12nm).
- Clock Speed: The base clocks of these GPUs are almost identical, yet the RTX 2070 Super boasts a boost clock that’s 8.7% greater than that of the GTX 1070 Ti.
- VRAM: Both graphics cards have 256-bit 8GB of memory. The GTX 1070 Ti uses GDDR5, while the RTX 2070 Super uses the faster GDDR6. The RTX 2070 Super has 75% faster memory speed than the GTX 1070 Ti.
- Advanced Technologies: The RTX 2070 Super features 1st Gen Ray Tracing and 2nd Gen Tensor cores, along with DLSS, but these features are absent in the GTX 1070 Ti.
The GTX 1070 Ti and the RTX 2070 Super were top-performing GPUs in their era. However, the GTX 1070 Ti lacked DLSS technology, whereas the RTX 2070 Super, part of the RTX 2000 series, was the first generation of Nvidia GPUs to feature DLSS technology. In GTX 1070 Ti Vs RTX 2070 Super, we will examine the performance gain and new features Nvidia incorporated from the GTX 1070 Ti to the RTX 2070 Super.
Gaming Benchmarks
To compare the performance of GTX 1070 Ti and RTX 2070 Super, we will discuss these GPUs’ performance and efficiencies in 8 taxing games played at 1080p resolution. The specialized specs of the PC used to run these games are listed below.
Gaming Rig
- OS: Windows 11
- CPU: Intel Core i7-13700K
- Motherboard: MSI MEG Z790 ACE MAX Motherboard
- RAM: Kingston Fury Renegade RGB DDR5 32GB 7200MHz
- SSD: Sabrent Rocket 4 Plus G 2TB NVMe SSD
- CPU Cooler: CORSAIR A115 CPU Air Cooler
- Power Supply: ENERMAX REVOLUTION D.F. X 1050W
Cyberpunk 2077
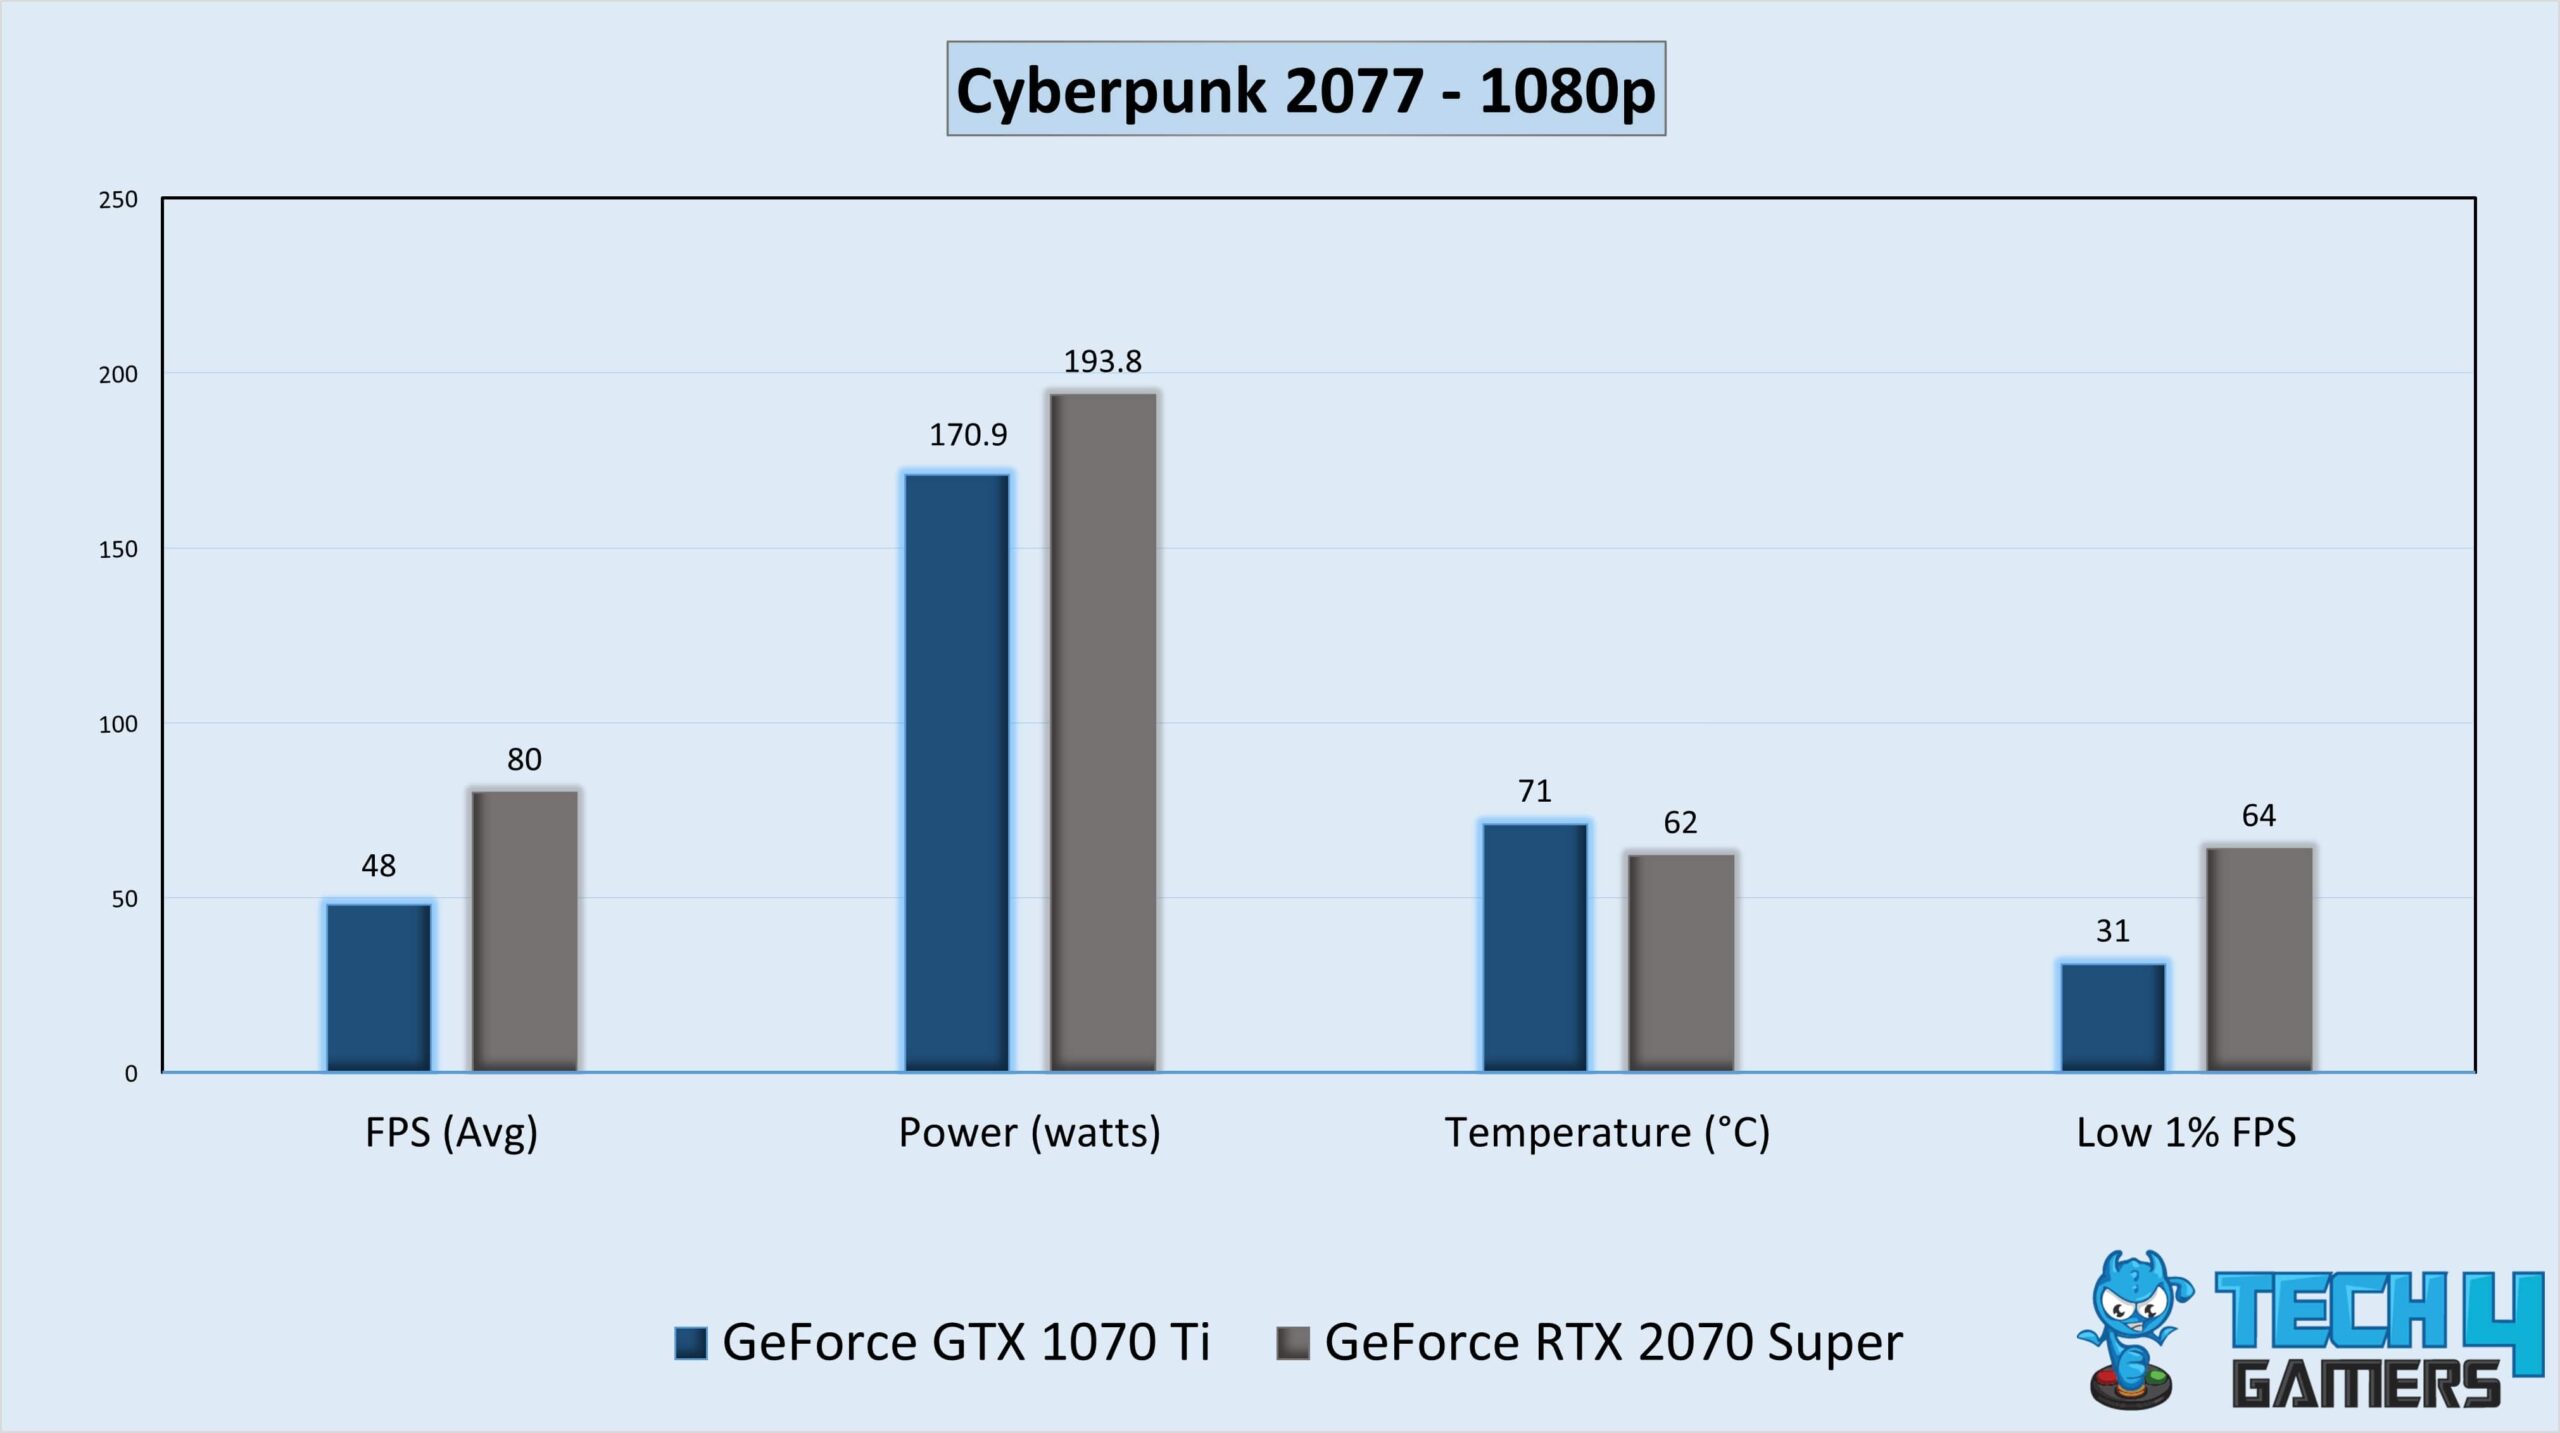
- In our first Cyberpunk 2077 gameplay, the RTX 2070 Super rendered 80 FPS, a 67% or 32 FPS better performance than the GTX 1070 Ti’s 48 FPS.
- At the worst 1% performance, the RTX 2070 Super supplied an impressive 64 FPS frame rate, but the GTX 1070 Ti could only manage 31 FPS.
Forza Horizon 5
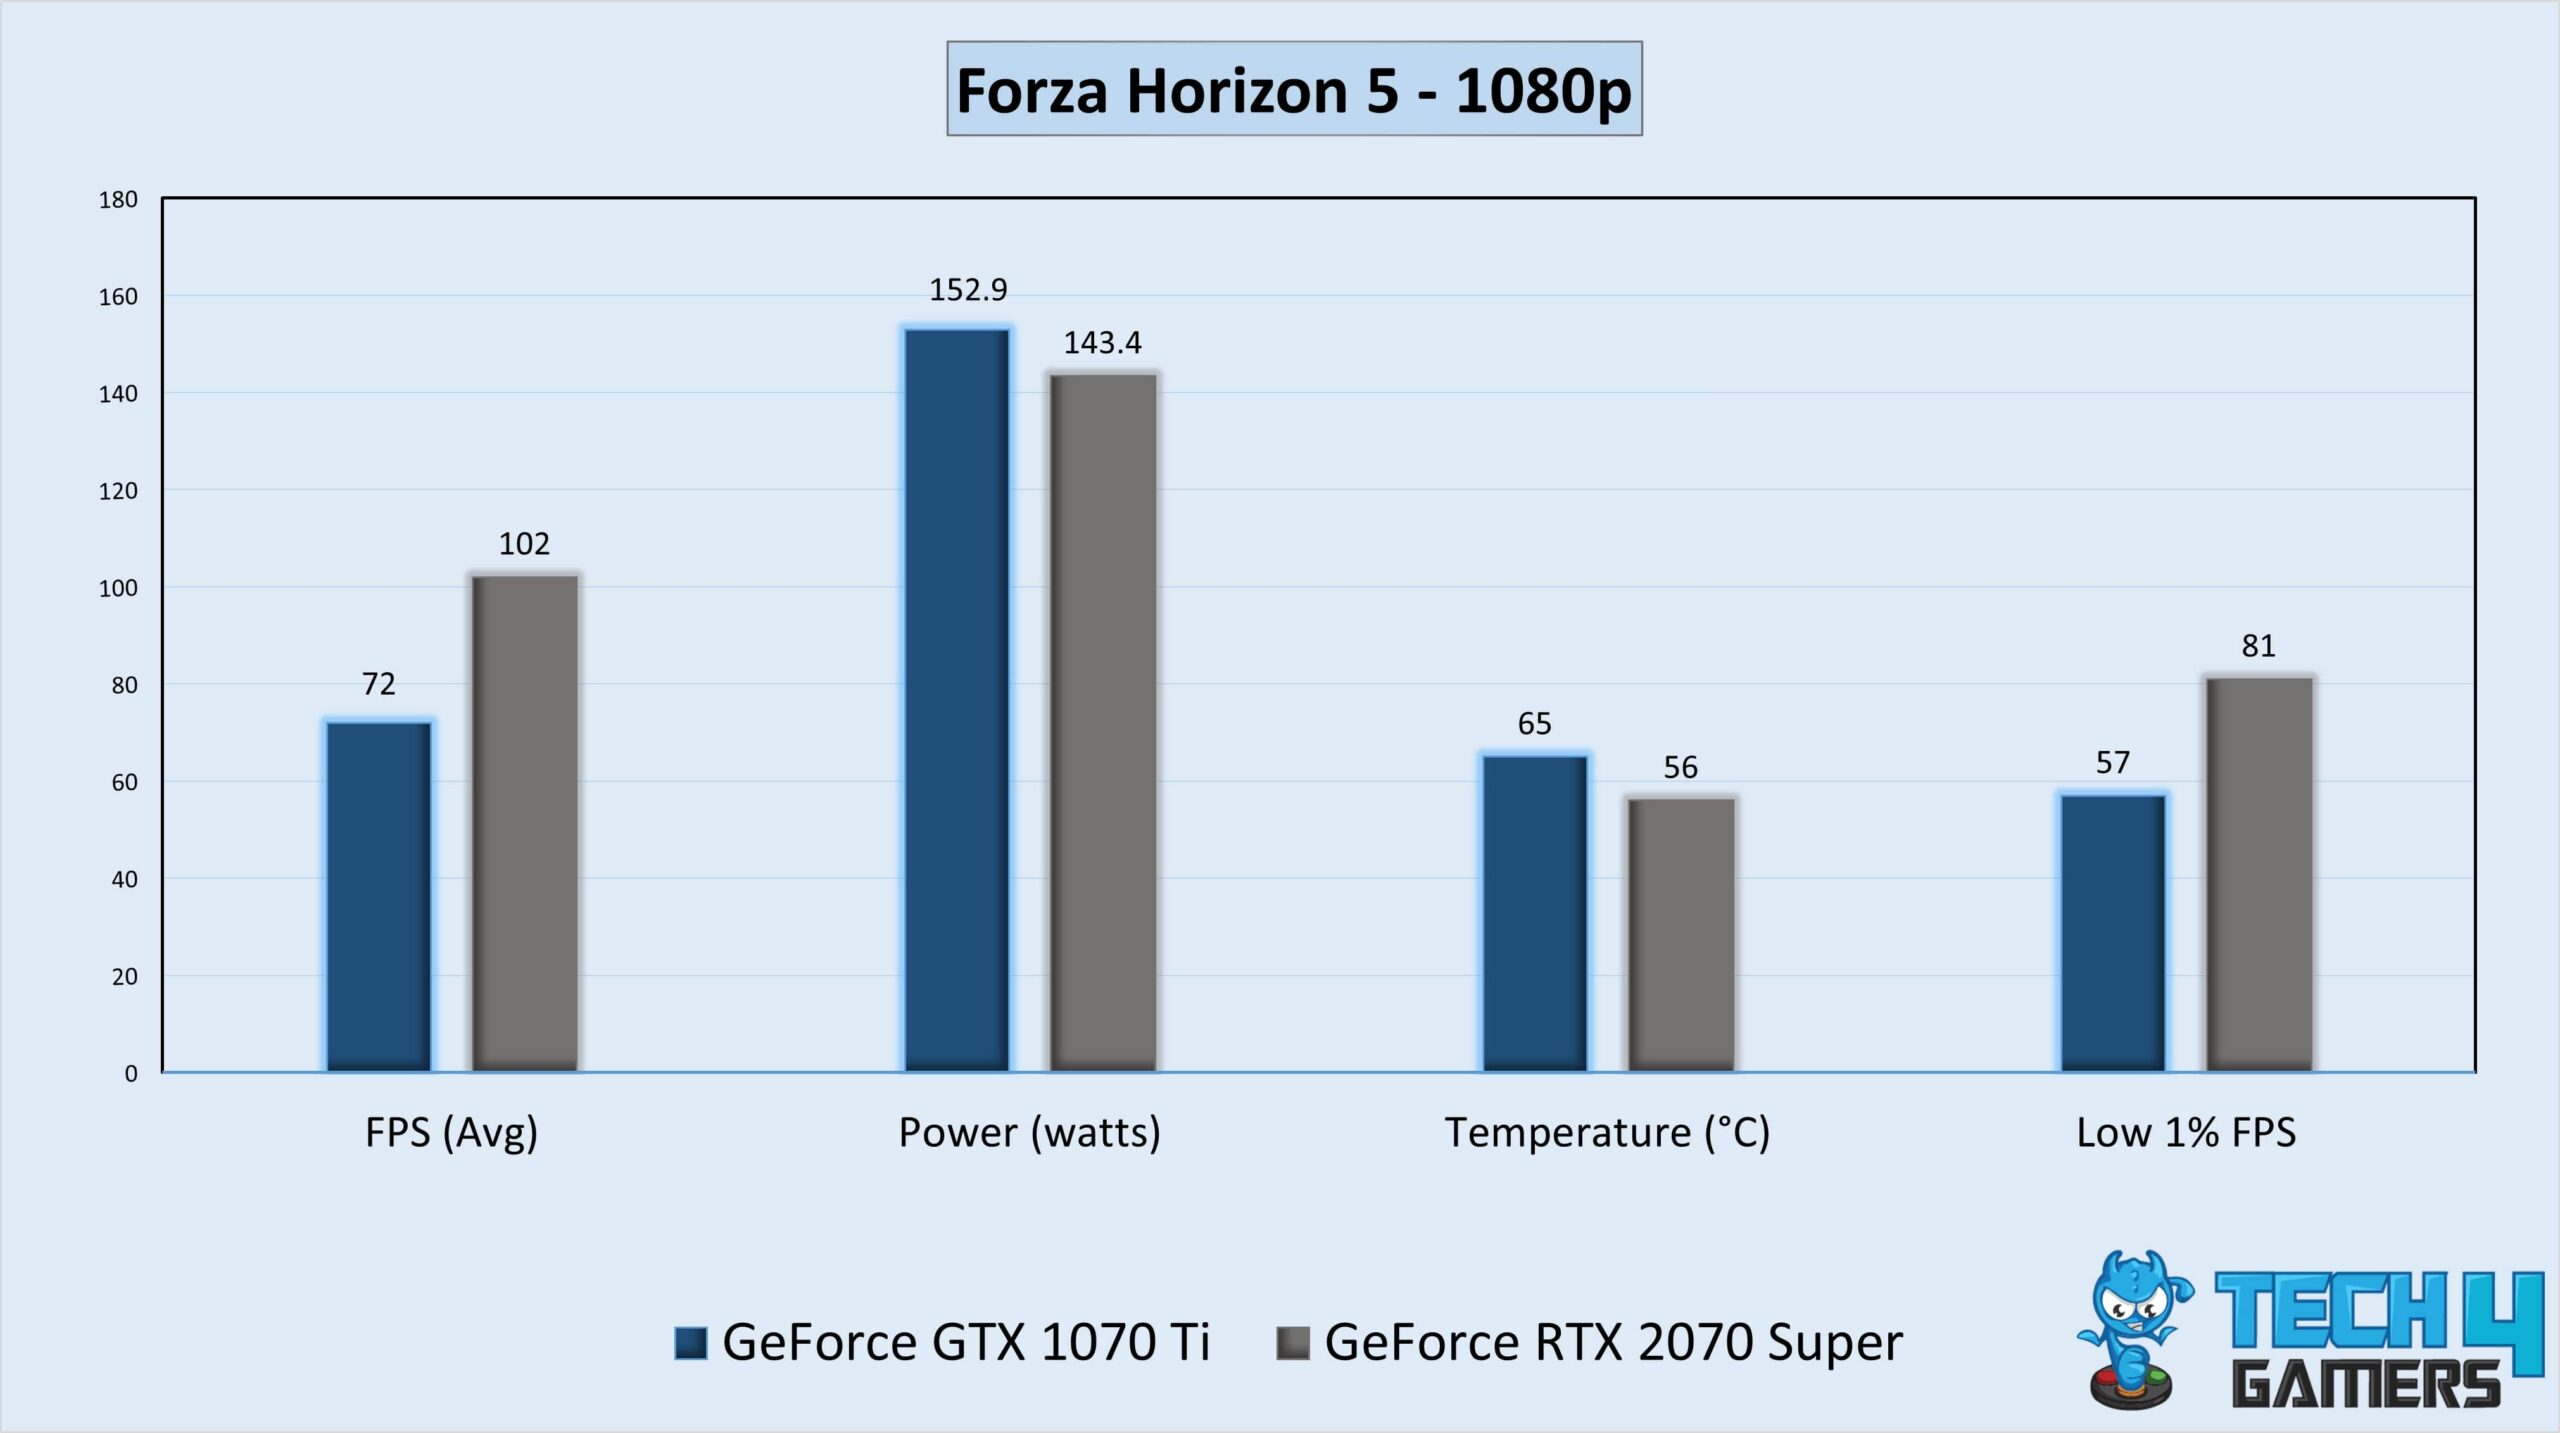
- During Forza Horizon 5, the RTX 2070 Super’s 102 FPS outperformed the GTX 1070 Ti’s average of 72 FPS by 42%.
- The RTX 2070 Super delivered a remarkable 81 FPS frame rate at the low 1% performance, while the GTX 1070 Ti could only muster 57 FPS.
Hogwarts Legacy
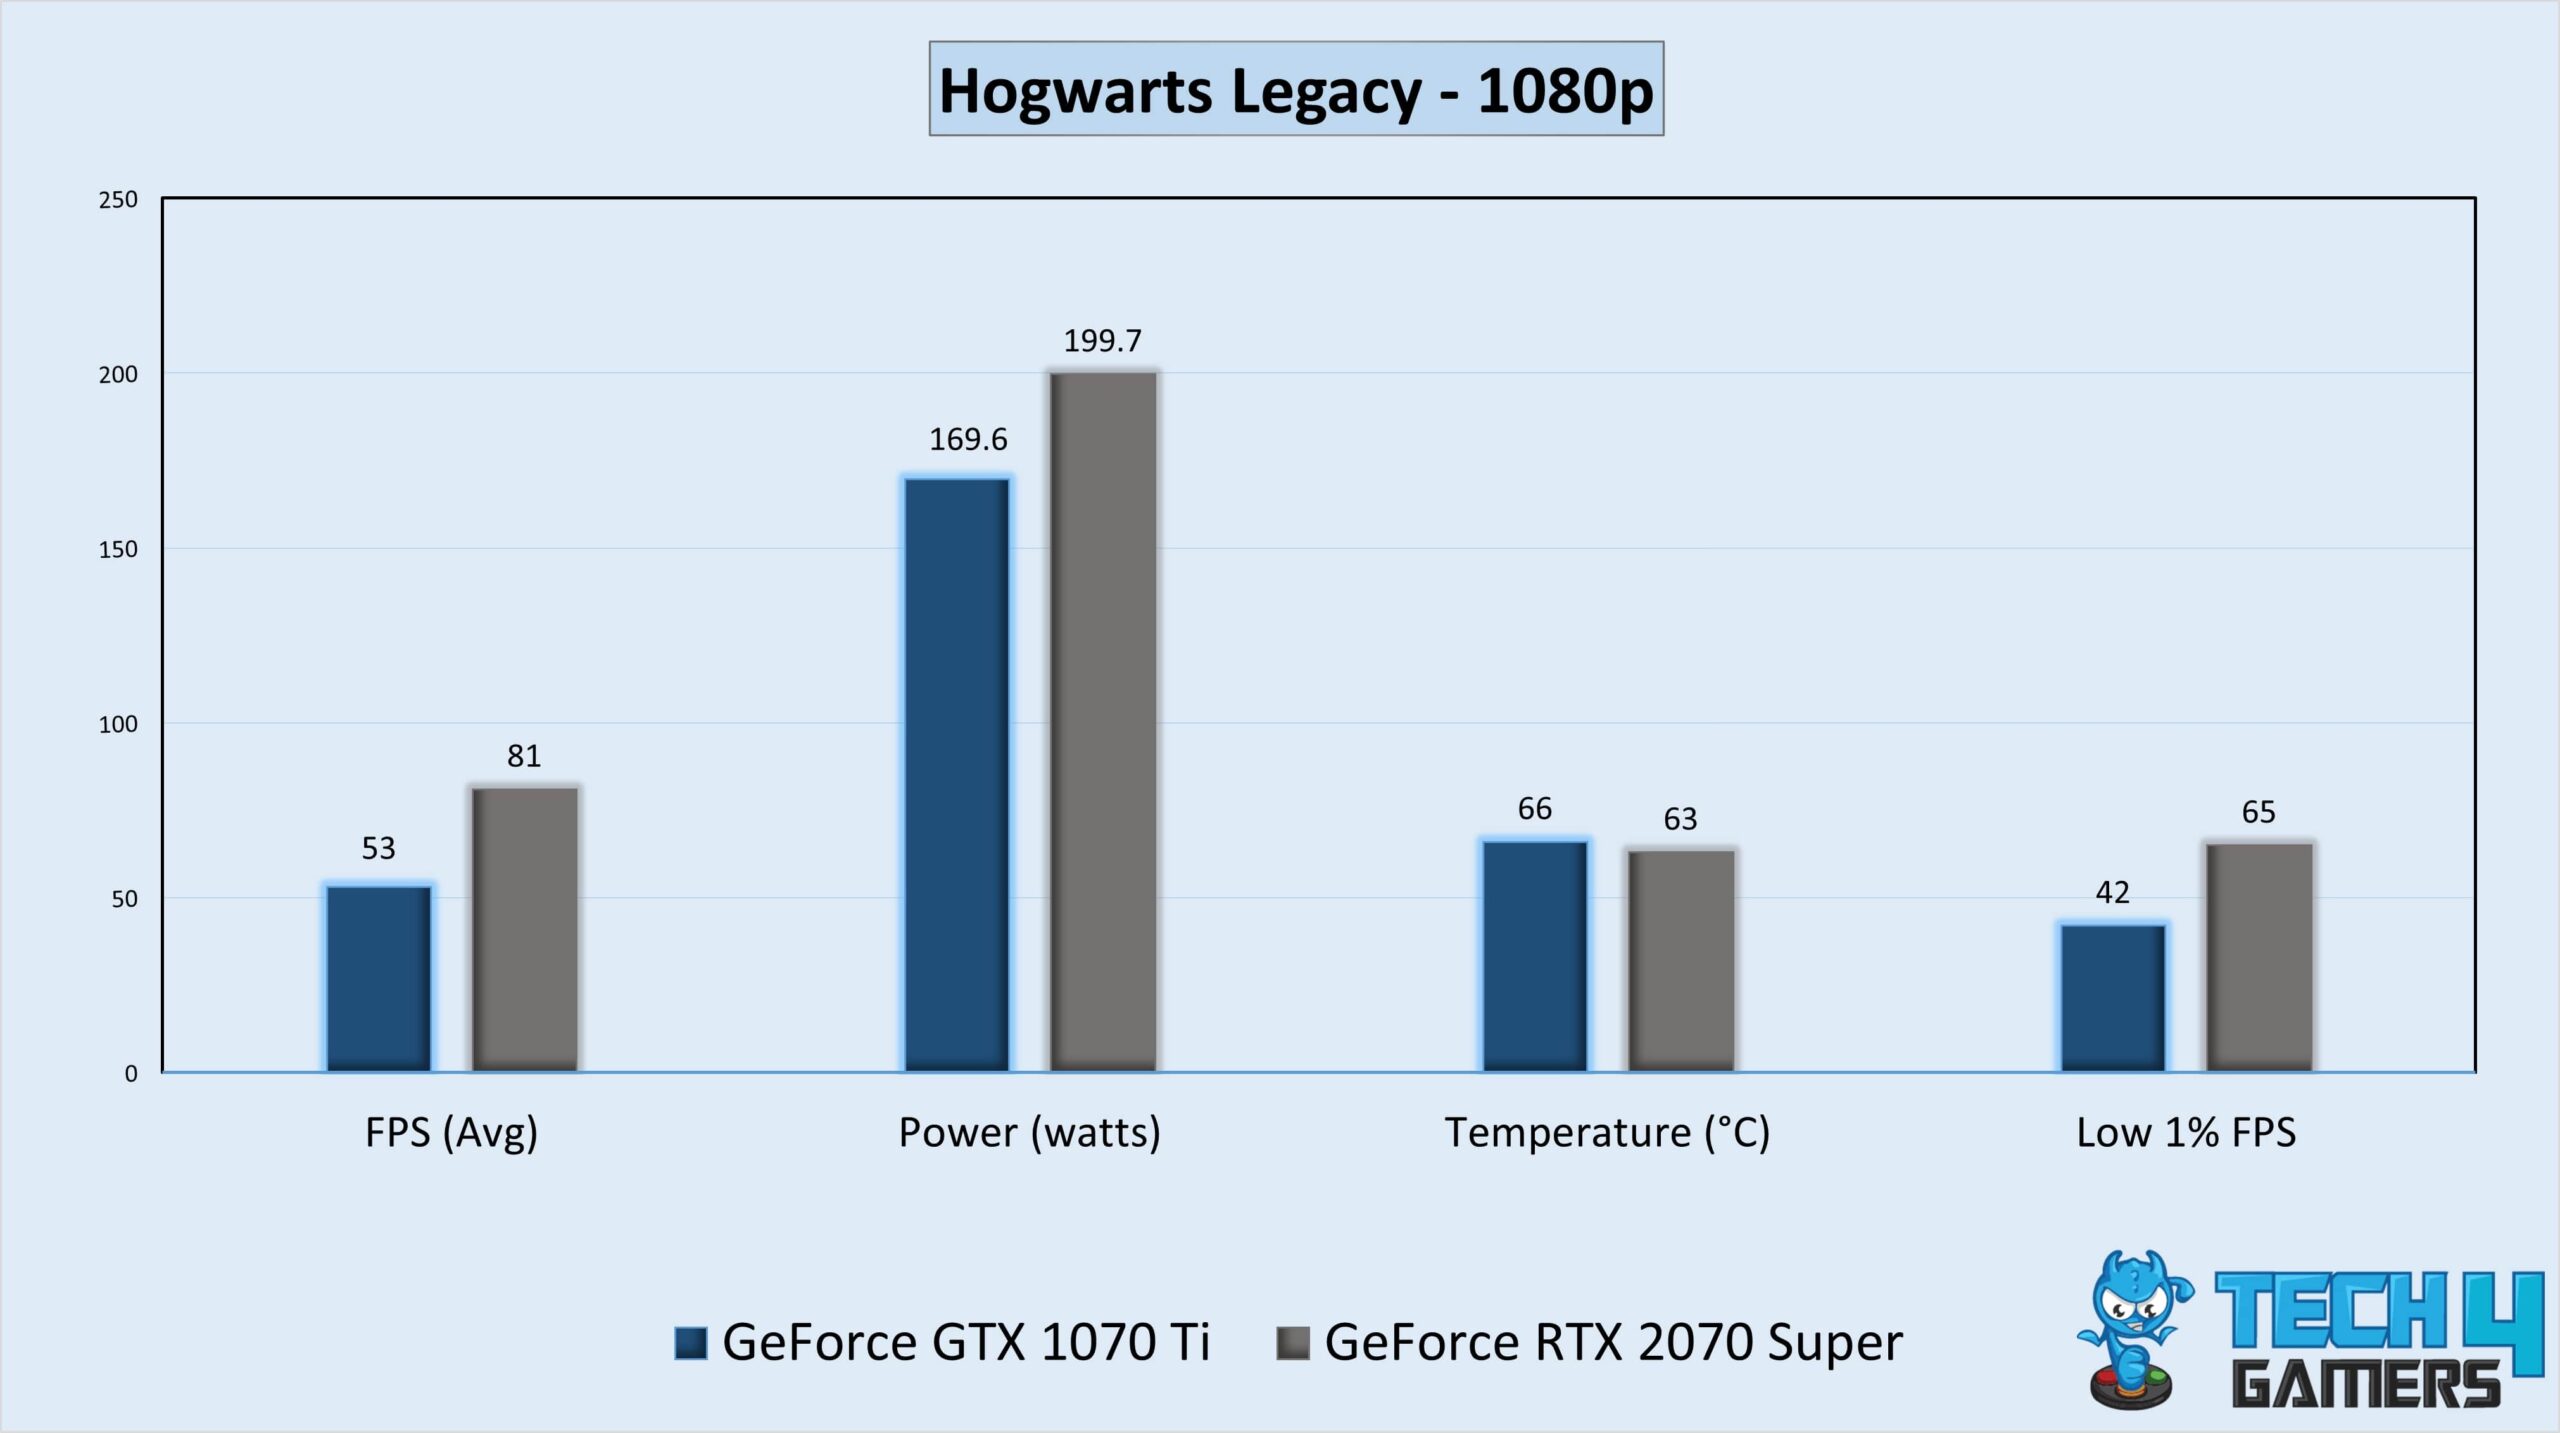
- In Hogwarts Legacy, the RTX 2070 Super’s 81 FPS average defeated the GTX 1070 Ti by a performance lead of 53%.
- For the low 1% frame rate, the GTX 1070 Ti only achieved 42 FPS, whereas the RTX 2070 Super scored an astounding 65 FPS.
Microsoft Flight Simulator
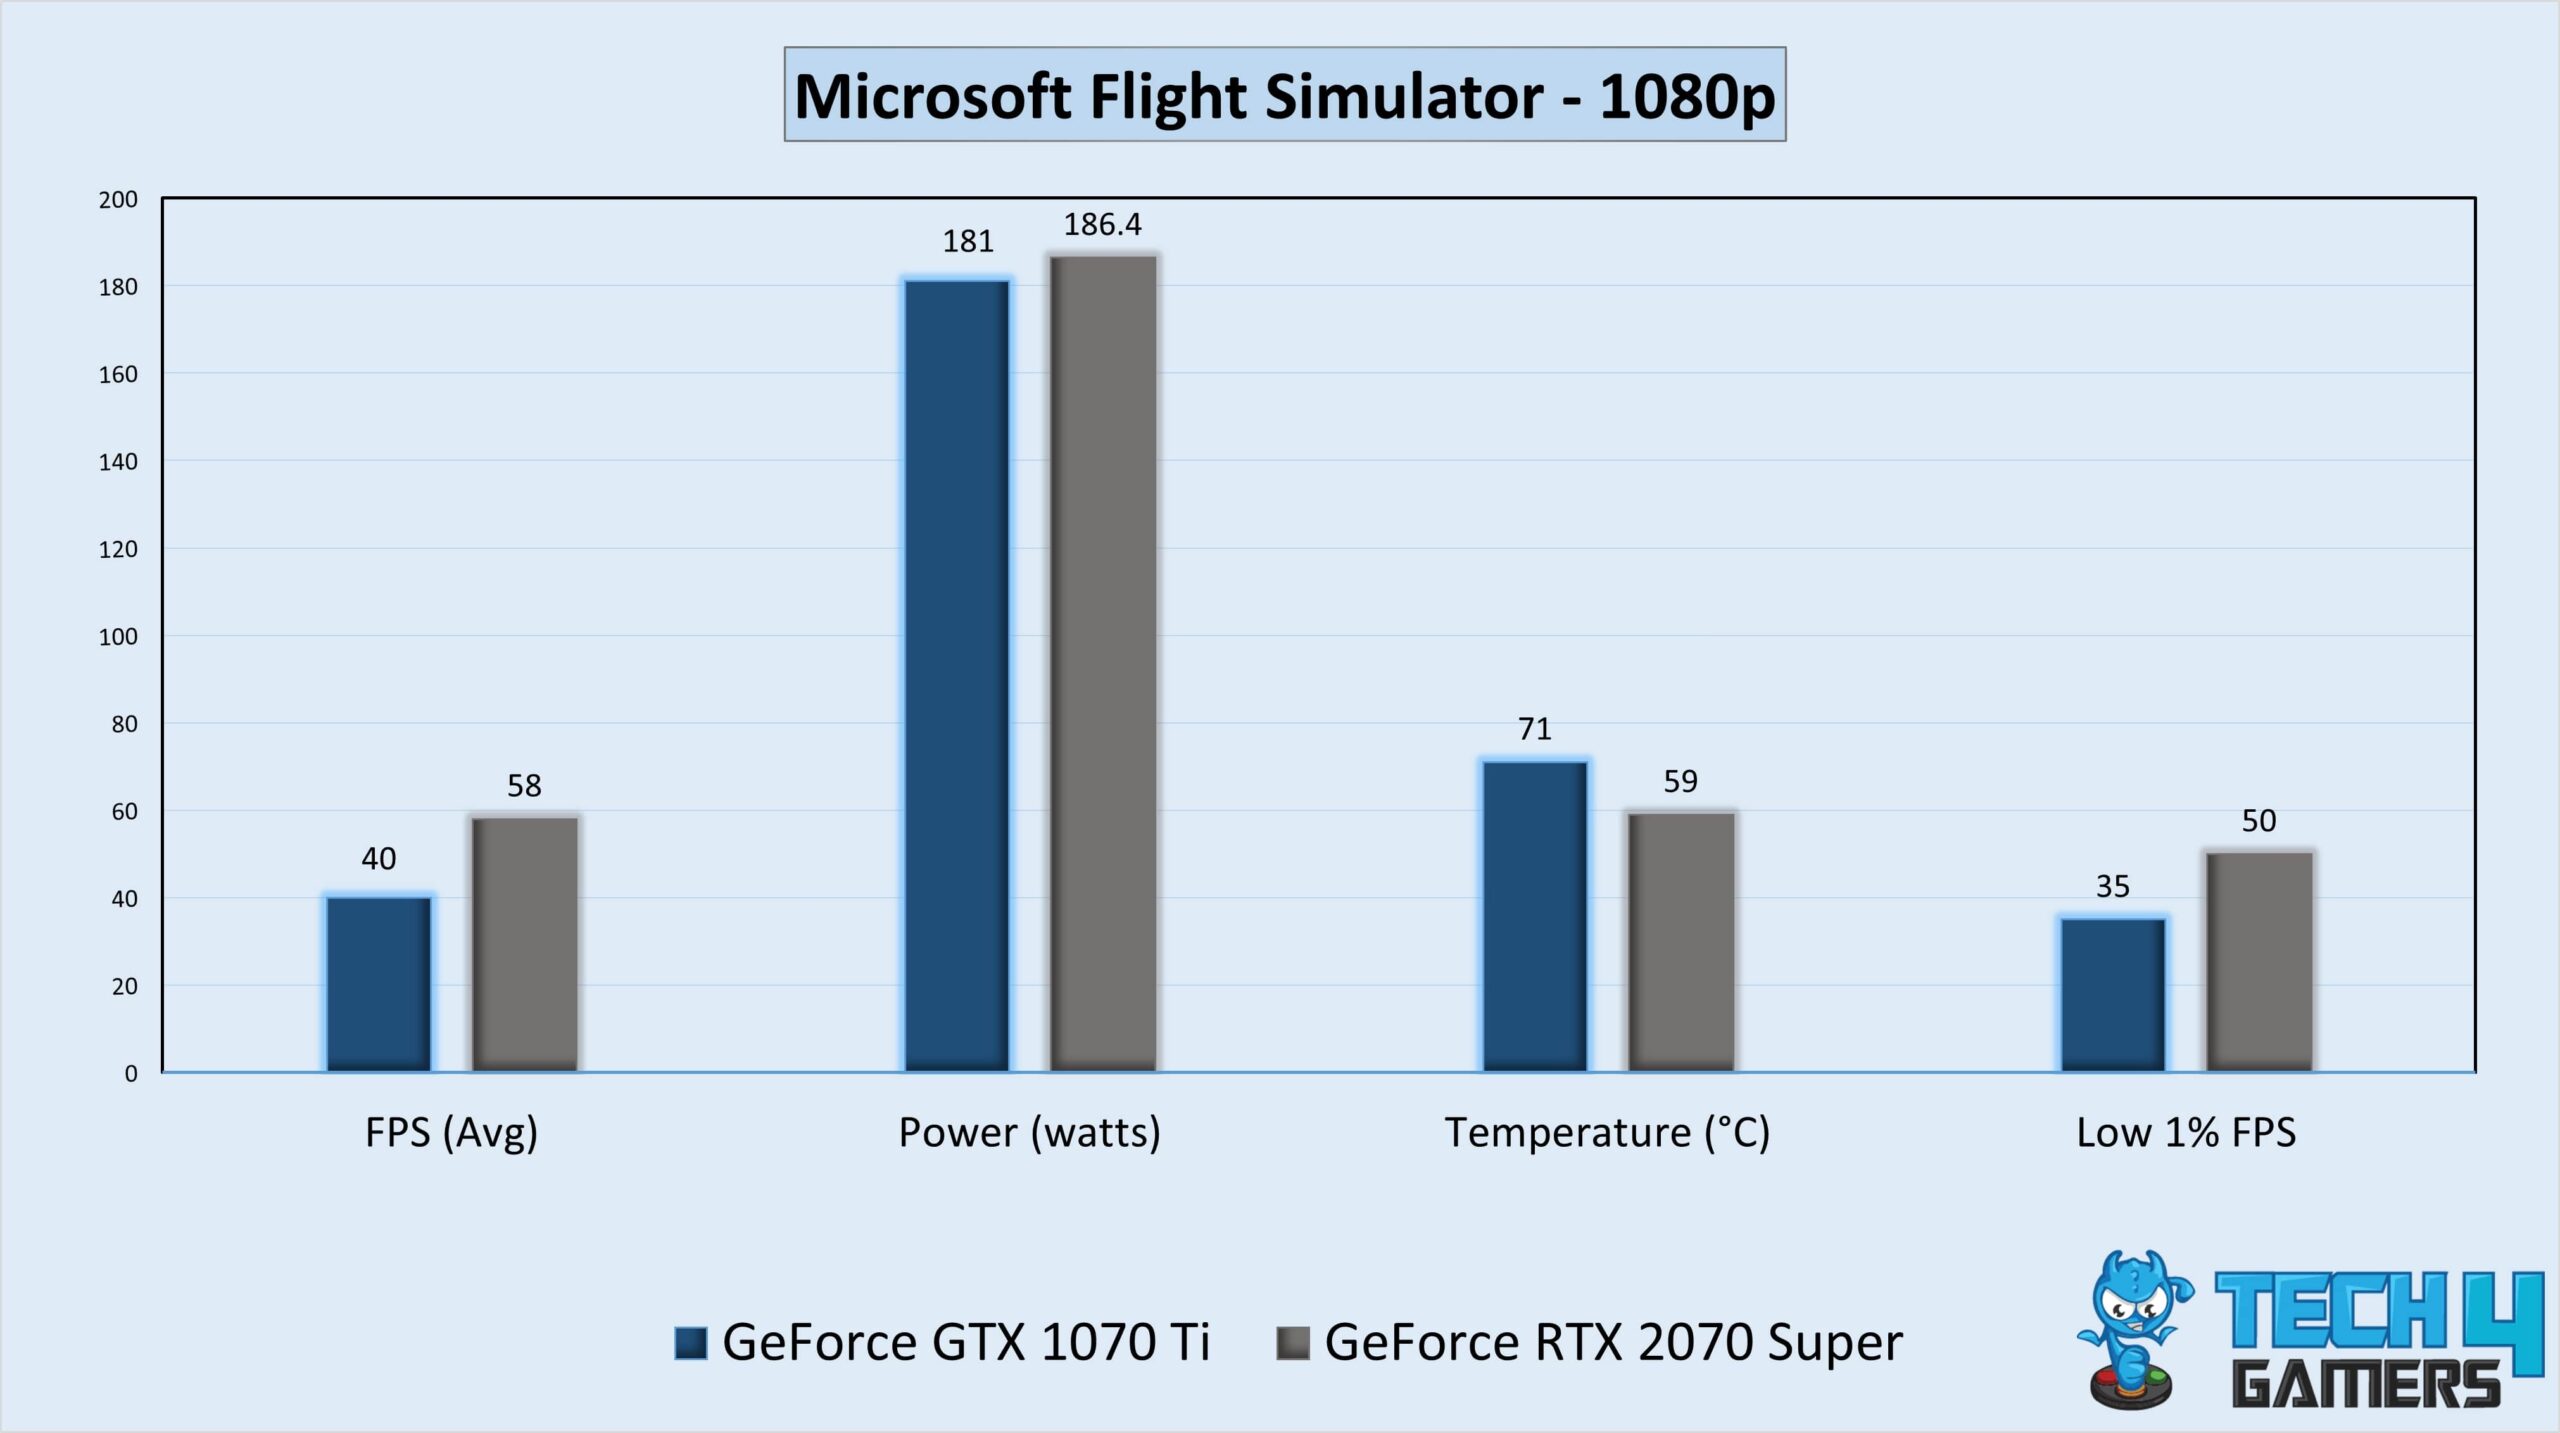
- The RTX 2070 Super averaged 58 FPS and outperformed the GTX 1070 Ti in Microsoft Flight Simulator by 45%.
- The GTX 1070 Ti only managed 35 FPS at the low 1% performance, whereas the RTX 2070 Super managed an astonishing 50 FPS.
Red Dead Redemption 2
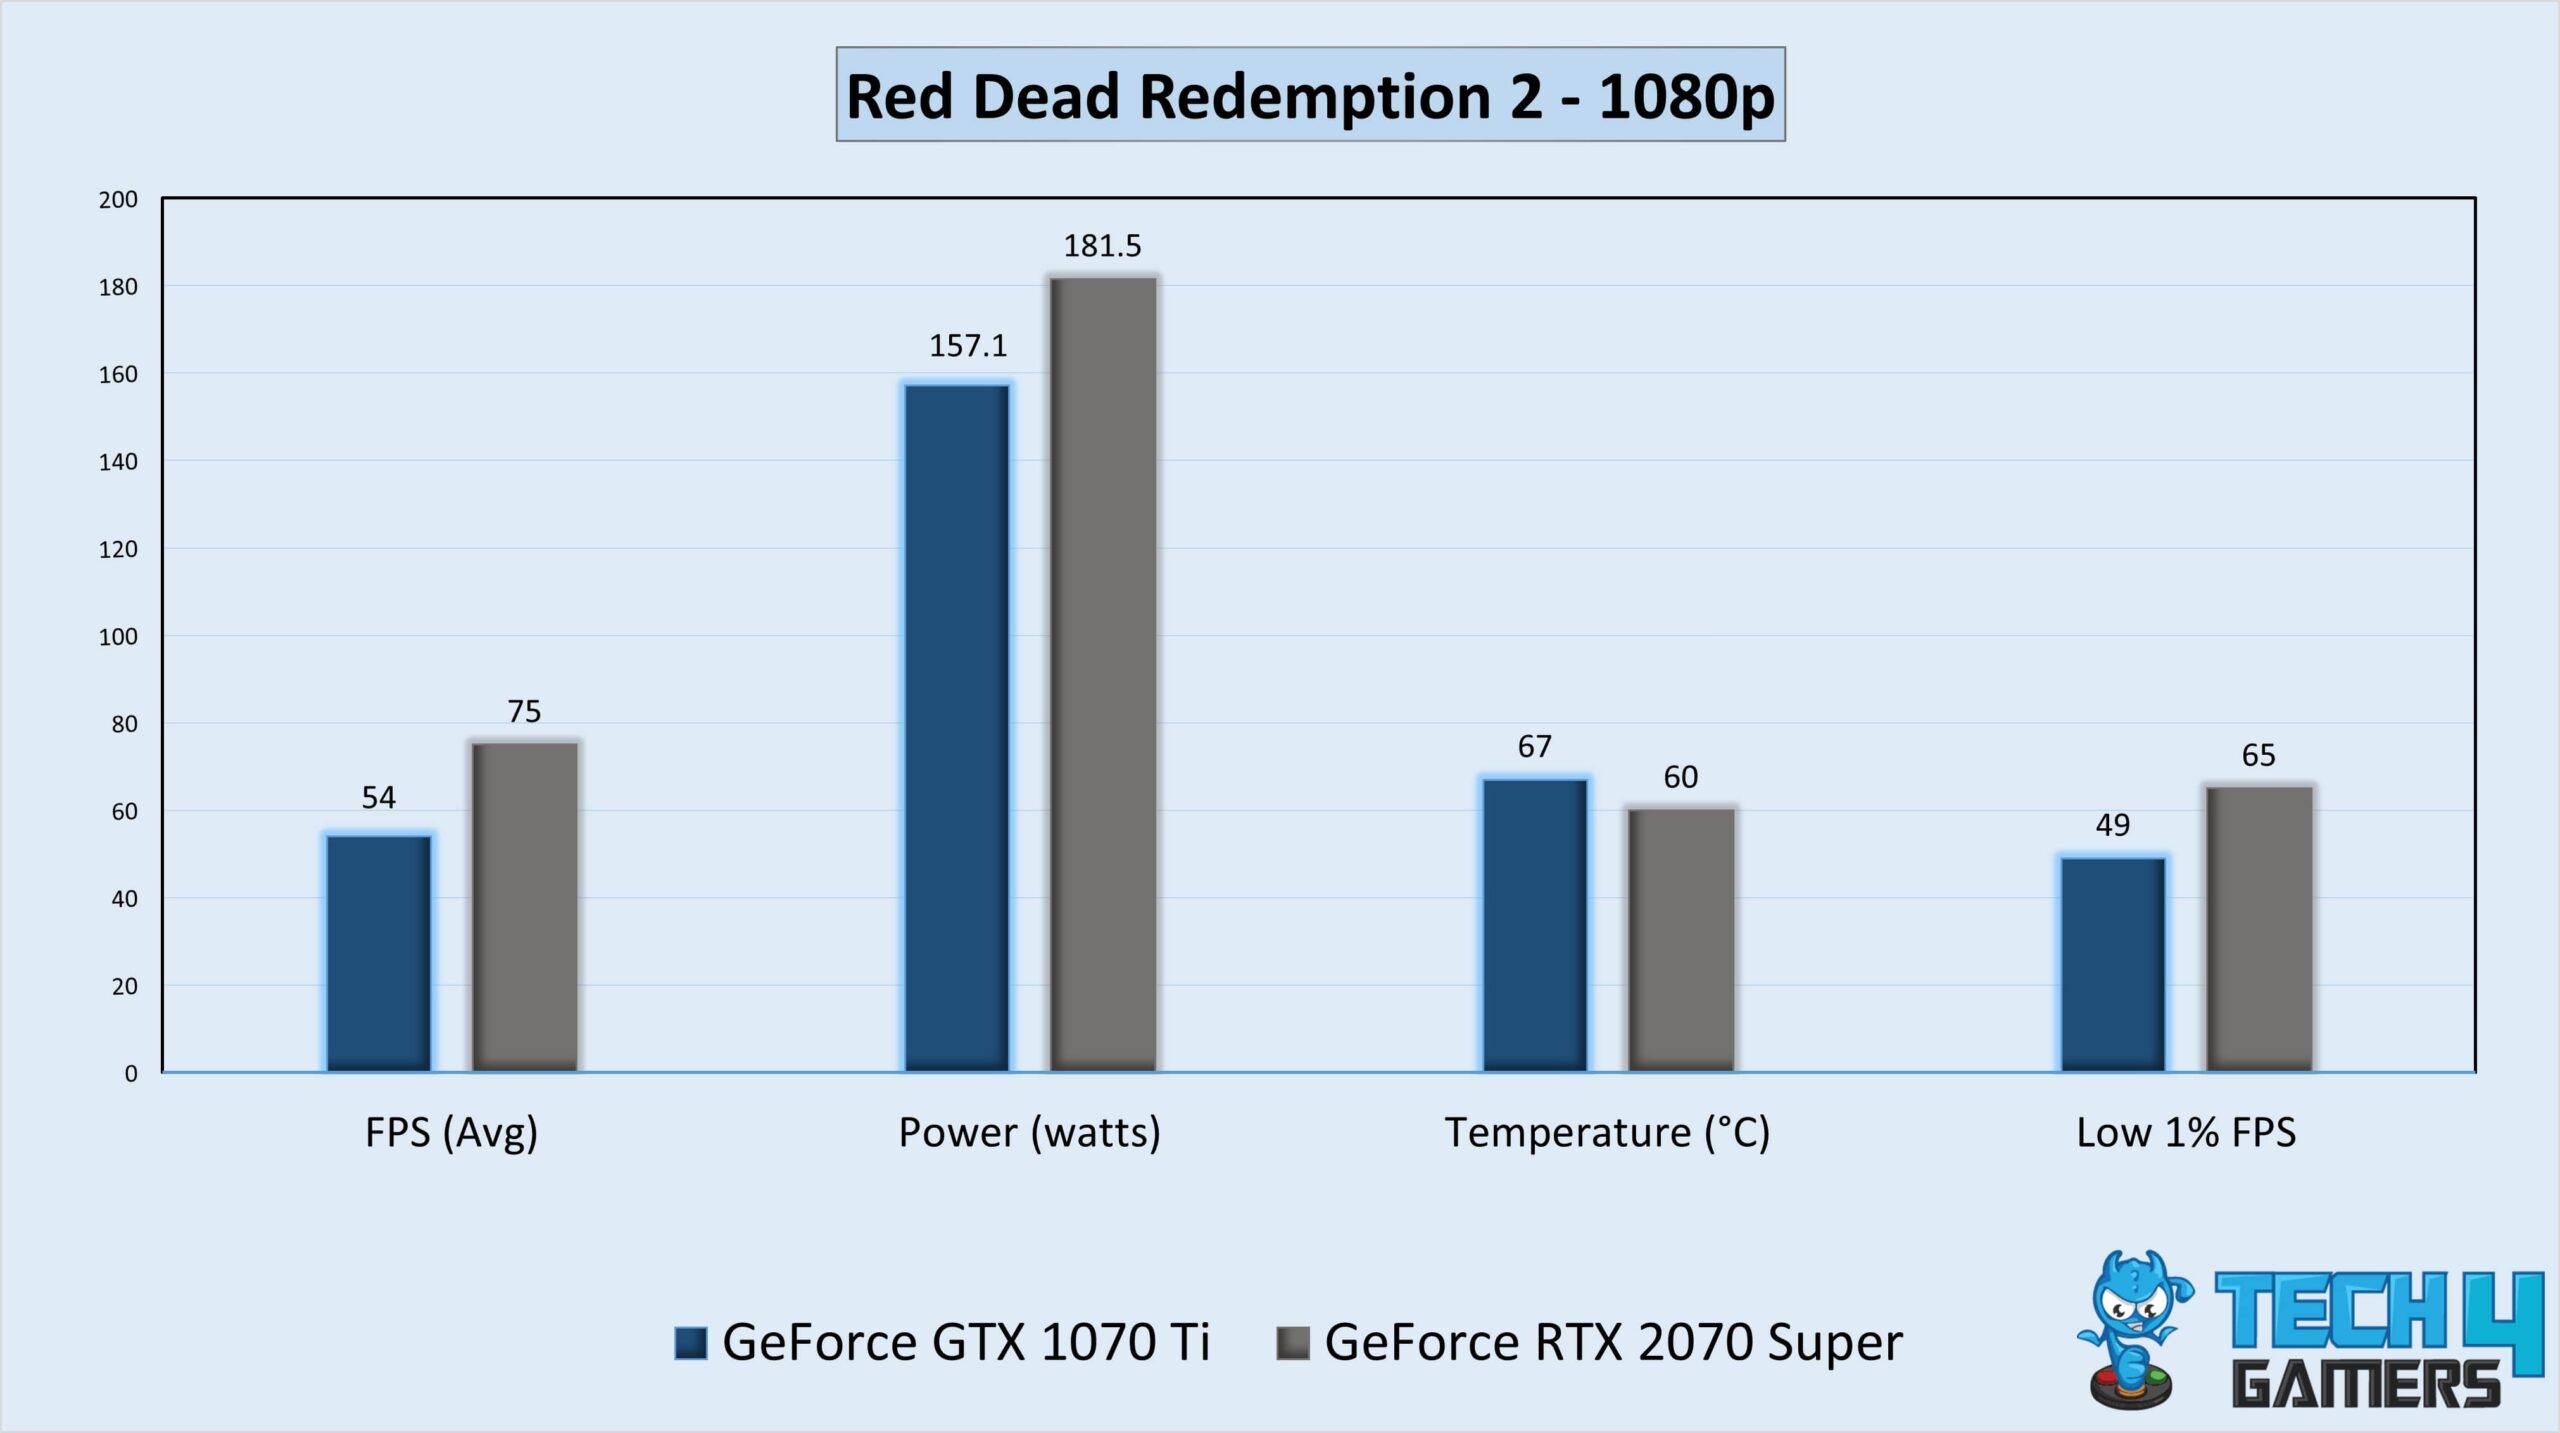
- In Red Dead Redemption 2, the RTX 2070 Super delivered 75 FPS on average and surpassed the GTX 1070 Ti’s 54 FPS by a performance lead of 39%.
- At the low 1% performance level, the RTX 2070 Super achieved an astounding 65 FPS, whereas the GTX 1070 Ti only managed 49 FPS.
Resident Evil 4
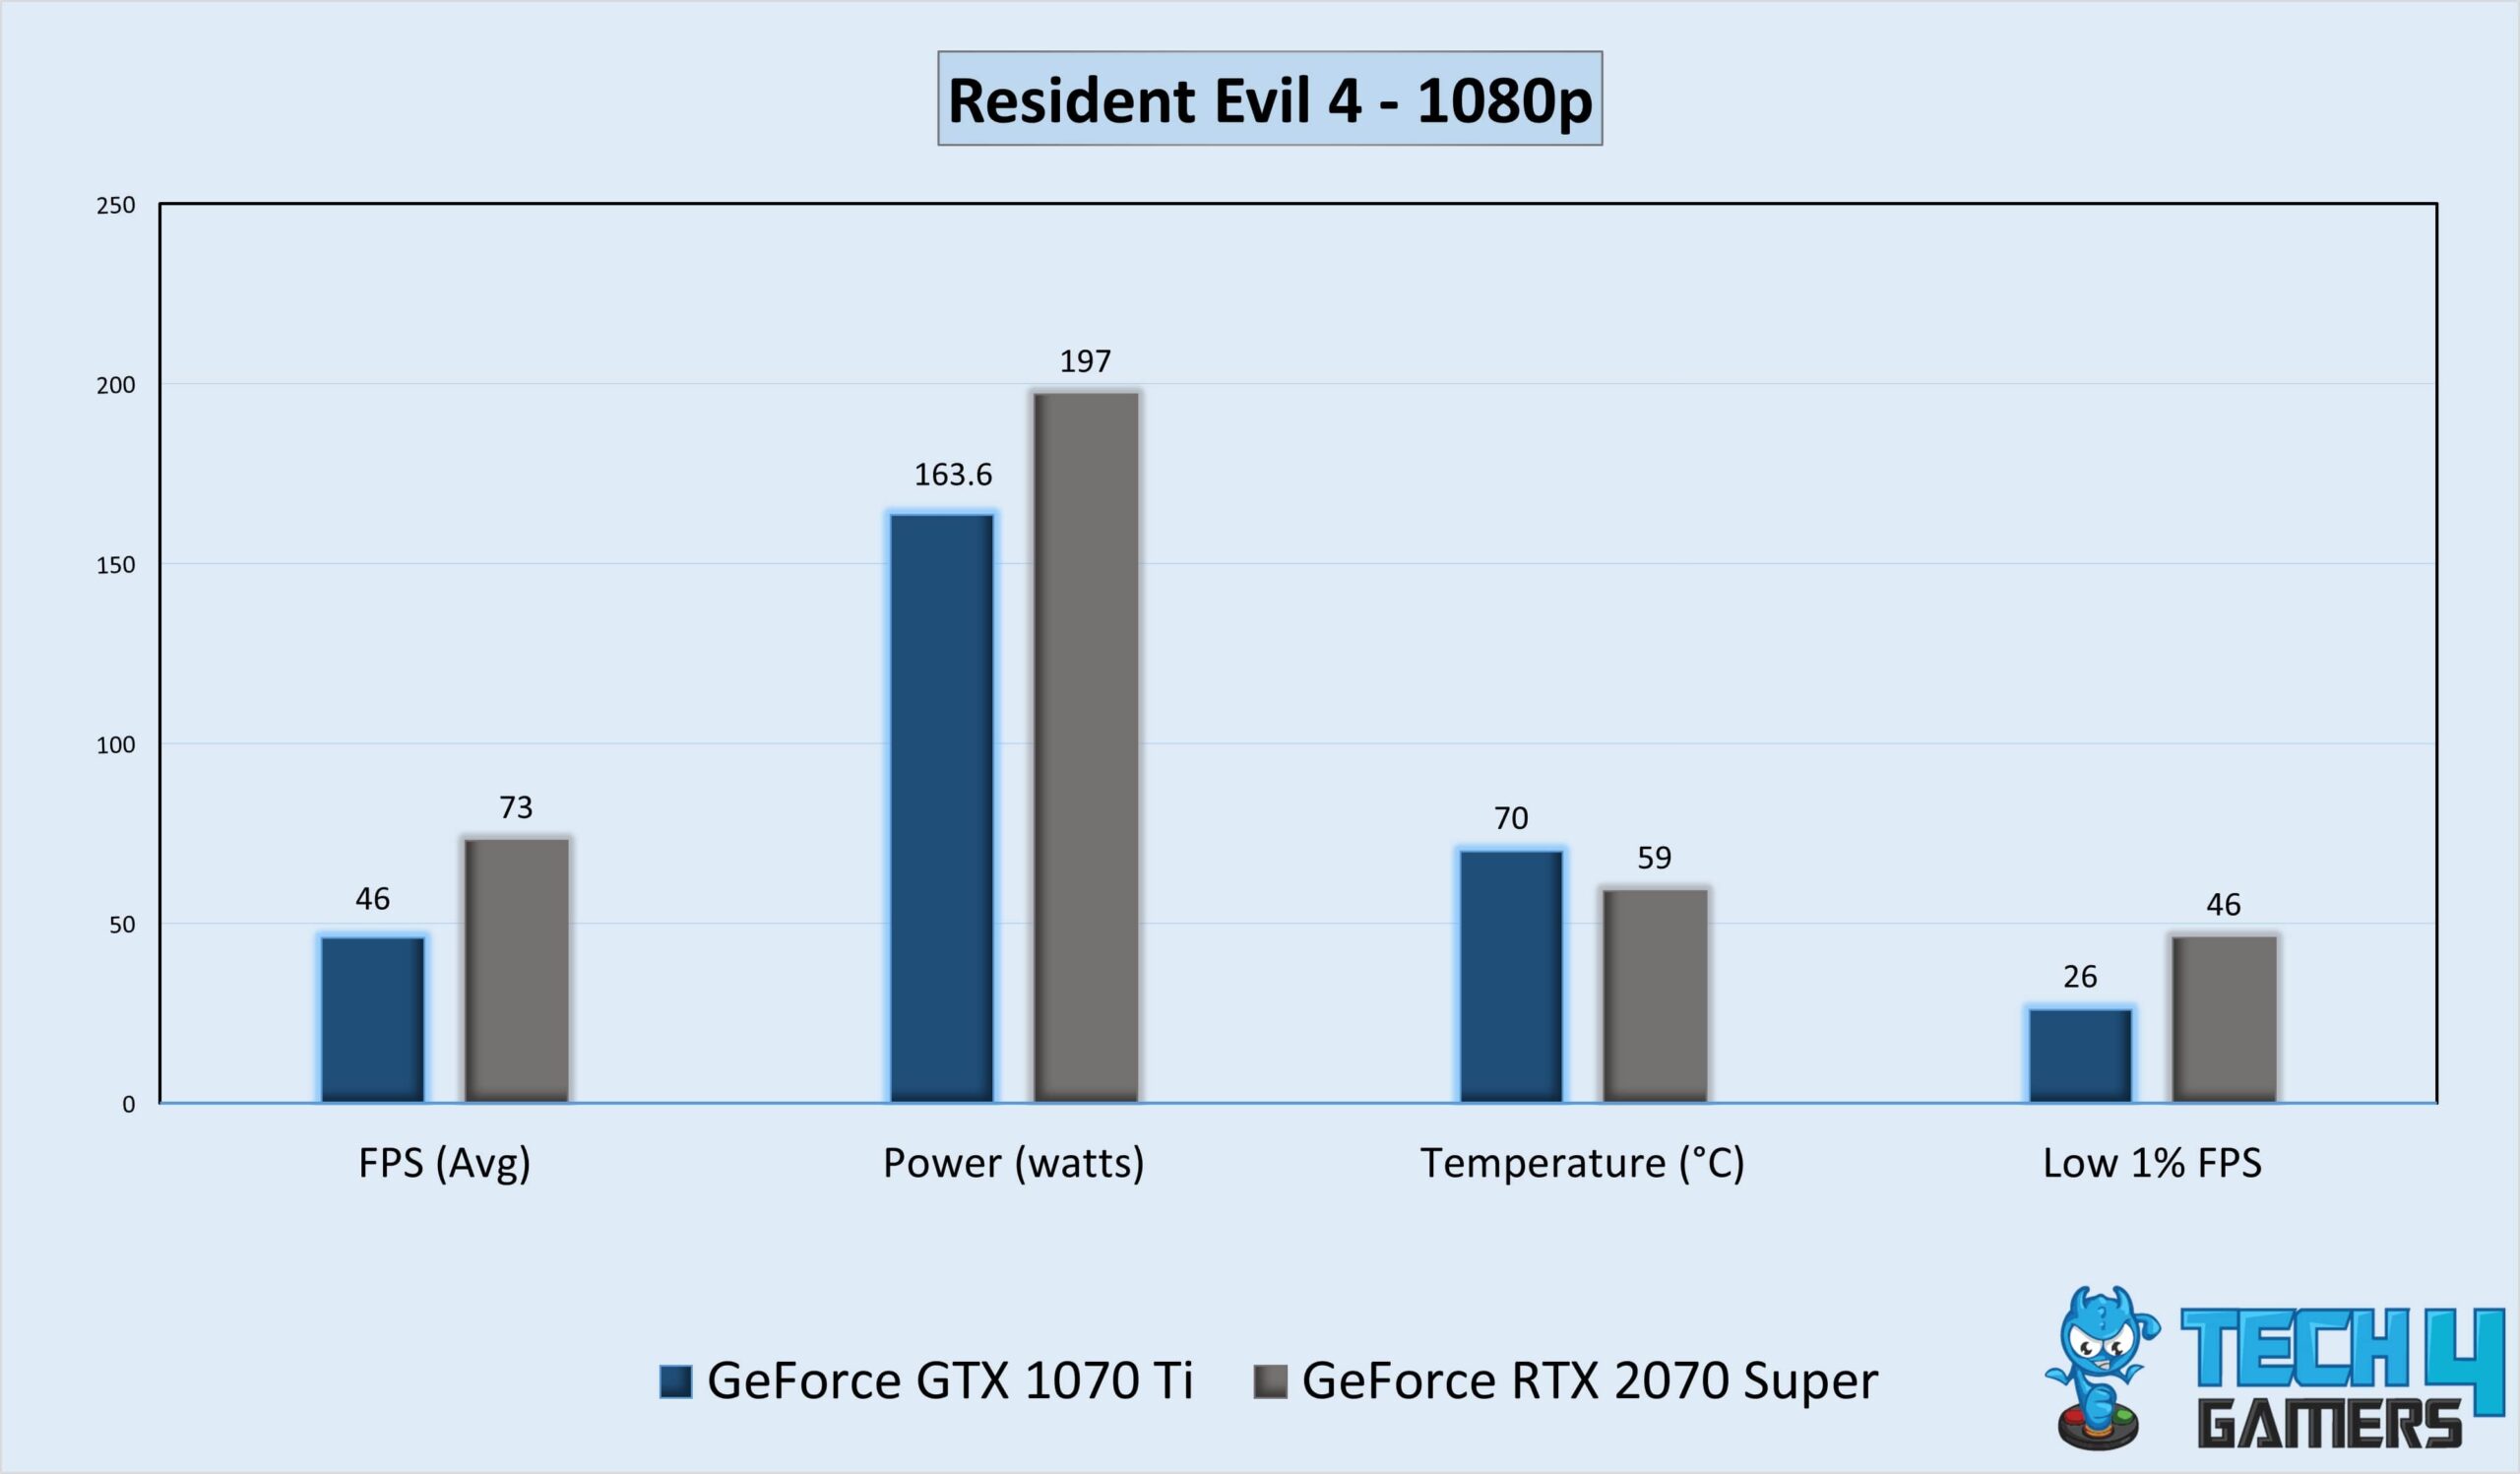
- The RTX 2070 Super delivered 73 FPS and overcame the GTX 1070 Ti in Resident Evil 4 by a margin of 59% or 27 FPS.
- The RTX 2070 Super outperformed the GTX 1070 Ti, which only scored 26 FPS at the low 1% performance level, with an incredible 46 frames per second.
Spider-Man
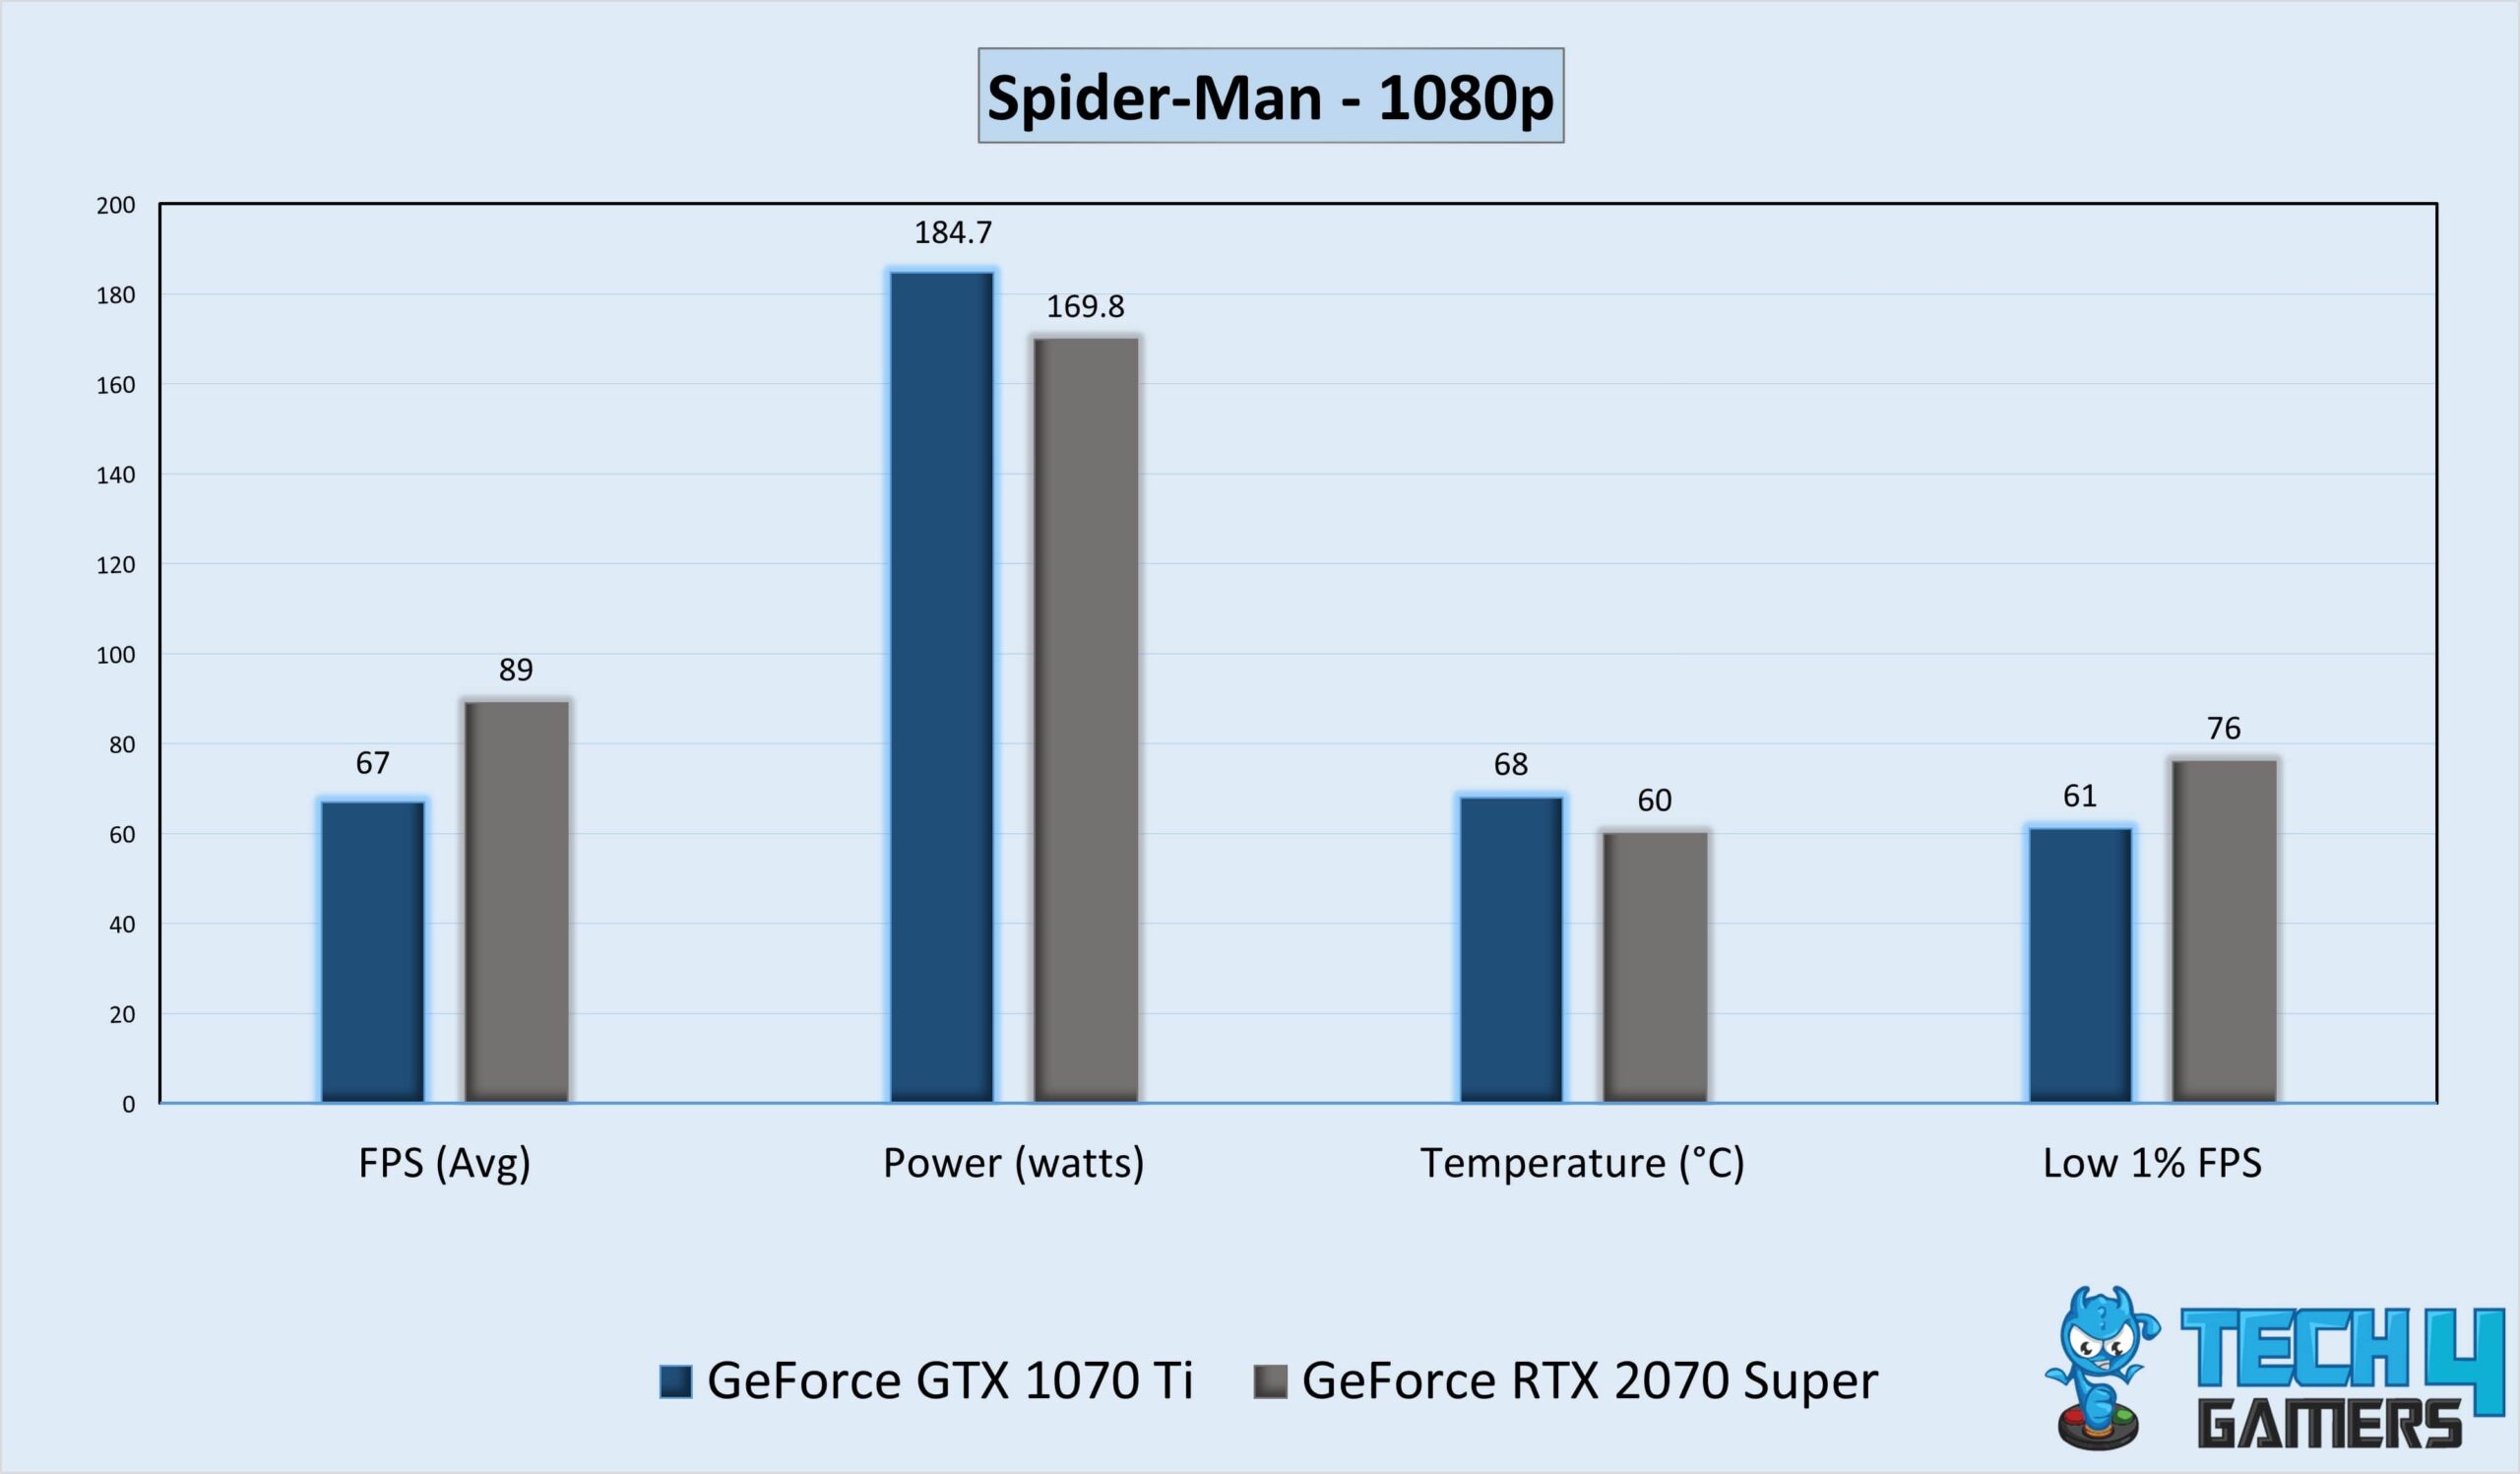
- In Spider-Man, the RTX 2070 Super supplied an average of 89 FPS exceeding the GTX 1070 Ti’s 67 FPS by a lead of 33%.
- With an astounding 76 FPS for a low 1% frame rate, the RTX 2070 Super trounced the GTX 1070 Ti’s 61 FPS.
The Witcher 3: Wild Hunt
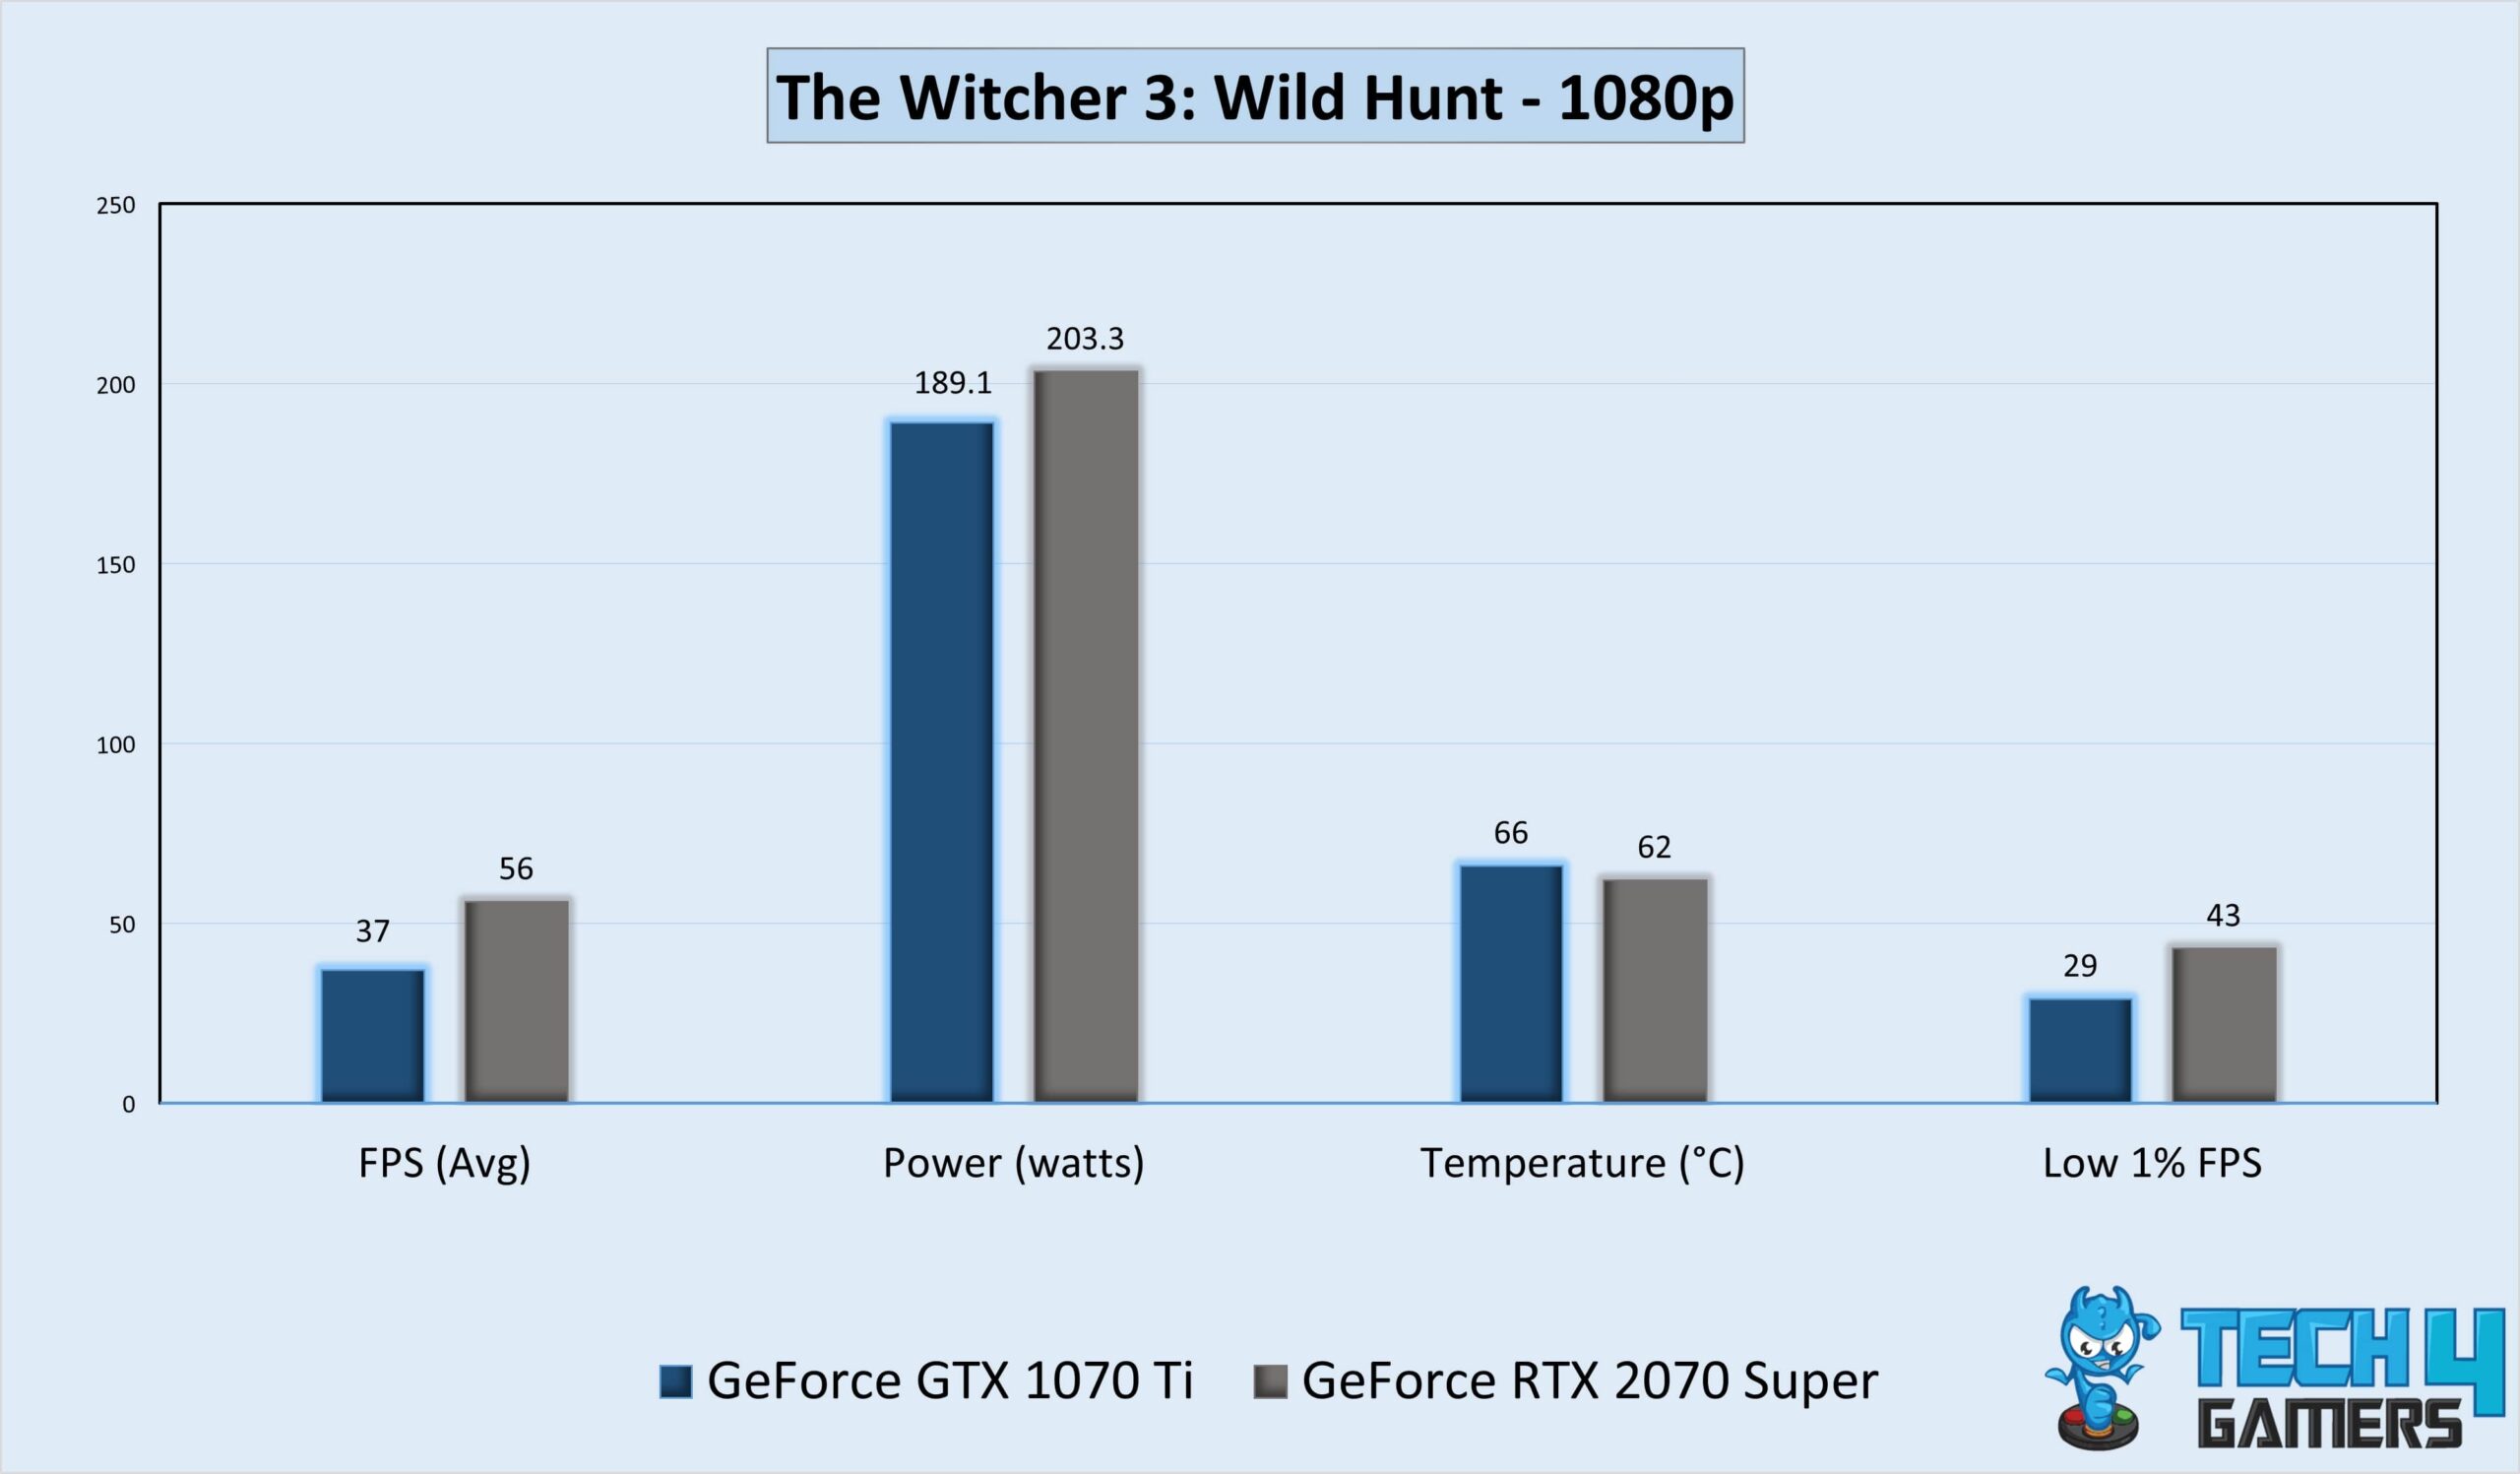
- While playing The Witcher 3: Wild Hunt, we saw a performance gap of 51% or 19 FPS between the RTX 2070 Super’s 56 FPS and the GTX 1070 Ti’s 37 FPS.
- At the worst 1% performance, the RTX 2070 Super crushed the GTX 1070 Ti’s 29 FPS with its stunning 43 frames per second.
Overall Gaming Performance
| Stats | GeForce RTX 2070 Super | GeForce GTX 1070 Ti |
|---|---|---|
| Average FPS | 76.75 📈 | 52.12 📉 |
| Low 1% FPS | 61.25 📈 | 41.25 📉 |
| Winner: GeForce RTX 2070 Super | ||
During our gaming session at 1080p resolution, the RTX 2070 Super boasts a stunning average performance edge over the GTX 1070 Ti, with a great margin of around 46.7%. In the low 1% FPS area, the RTX 2070 Super once more defeated the GTX 1070 Ti, with an astounding average advantage of roughly 48.5%.
Gaming Power Consumption
| Stats | Nvidia RTX 2070 Super | Nvidia GTX 1070 Ti |
|---|---|---|
| Average Power Draw (watts) | 184.4 ⚡ | 171.1 ⚡ |
| Winner: Nvidia GeForce GTX 1070 Ti | ||
While playing games, we observed that the RTX 2070 Super consumed a bit more power, while delivering much better performance. Based on our results of gaming power usage, the GTX 1070 Ti excels over the RTX 2070 Super by approximately 7.8% better power efficiency.
Gamig Temperatures
| Stats | Nvidia RTX 2070 Super | Nvidia GTX 1070 Ti |
|---|---|---|
| Average Gaming Temperature (°C) | 60.1 🌡️ | 68.0 🌡️ |
| Winner: Nvidia GeForce GTX 1070 Ti | ||
The RTX 2070 Super showed better temperature management skills and stayed about 8°C cooler than the GTX 1070 Ti. In light of these average gaming temperatures, we conclude that the RTX 2070 Super offers a 13.1% higher thermal efficiency than the GTX 1070 Ti.
Price And Availability
| GPU | Launch MSRP | Current Price |
|---|---|---|
| Nvidia RTX 2070 Super | 💲499 | 💲300 (Refurbished) |
| Nvidia GTX 1070 Ti | 💲449 | 💲180 (Refurbished) |
| Price Difference | 11.1% | 66.7% |
In the current market, these GPUs are no longer being actively manufactured by companies due to their age. And considering their current prices, the refurbished RTX 2070 Super costs about 66.7% more than the refurbished GTX 1070 Ti.
Final Verdict: What Do We Recommend?
GeForce GTX 1070 Ti: The GTX 1070 Ti is a very good GPU which renders optimal performance at 1080p. Despite its age, this GPU doesn’t consume much power. Additionally, its 8GB VRAM makes it a compelling choice at this affordable price point.
GeForce RTX 2070 Super: The RTX 2070 Super is a superior choice for gaming at 1080p and 1440p resolution. You could see improvements from its upgraded DLSS and ray tracing features. Furthermore, it delivers efficient performance relative to its power consumption.
If you’re a passionate gamer seeking a leading-edge, high-performance GPU, we recommend getting the RTX 2070 Super. However, if you’re looking for a more affordable choice, the GTX 1070 Ti is what we advise.
More From RTX 2070 Super:
More From GTX 1070 Ti:
Thank you! Please share your positive feedback. 🔋
How could we improve this post? Please Help us. 😔
[Comparisons Expert]
Shehryar Khan, a seasoned PC hardware expert, brings over five years of extensive experience and a deep passion for the world of technology. With a love for building PCs and a genuine enthusiasm for exploring the latest advancements in components, his expertise shines through his work and dedication towards this field. Currently, Shehryar is rocking a custom loop setup for his built.
Get In Touch: shehryar@tech4gamers.com
 Vs RTX 3080 (12GB): 5 Games Tested")


