GeForce RTX 2060
Rated: 8.5/10
GeForce GTX 1080
Rated: 7/10
Pros And Cons
| GPU | Pros | Cons |
|---|---|---|
| GeForce RTX 2060 | ✅ Improved performance ✅ Attractive Founders Edition design | ❌ Higher price tag than previous models |
| GeForce GTX 1080 | ✅ Improved Performance than GTX 980 ✅ VR & 4K Capable | ❌ Fans are always on, even in idle |
- During our gaming benchmarks, the RTX 2060 dominated the GeForce GTX 1080 with an average FPS production that is 7.4% higher.
- The RTX 2060 has a power consumption that is approximately 5.8% lower than that of the GeForce GTX 1080. In contrast, the GTX 1080 had a 13.2% advantage in thermal efficiency over the RTX 2060.
- The current prices of the RTX 2060 and the GTX 1080 have a difference of 74%, which brings out the RTX 2060 as the economical option out of the two graphic cards.
- We recommend that users buy the RTX 2060 as it gives a better performance at a lower price, along with low power ratings.
Comparison Table
| Technical Specs | GeForce RTX 2060 | GeForce GTX 1080 |
|---|---|---|
| GPU Name | TU106 | GP104 |
| Architecture | Turing | Pascal |
| Transistors | 10,800 million | 7,200 million |
| TMUs | 120 | 160 |
| ROPs | 48 | 64 |
| L1 Cache | 64 KB (per SM) | 48 KB (per SM) |
| L2 Cache | 3 MB | 2 MB |
| Suggested PSU | 450 W | 500 W |
| Release Date | Oct 17th, 2018 | May 27th, 2016 |
| MSRP | 349 USD | 599 USD |
Architectural Differences
- CPU Core Count: The RTX 2060 consists of 1920 CUDA cores, coupled with 240 Tensor cores, along with 30 Ray Tracing cores. On the other hand, the GTX 1080 is bundled with a total of 2560 CUDA cores, while there are no Tensor cores and Ray Tracing cores available, giving an enormous edge to the RTX 2060.
- TDP: Speaking of the TDP, the RTX 2060 offers a maximum TDP of 160W to its users. Meanwhile, the GTX 1080 provides users with a TDP of 180W. This gap proves the power efficiency of the RTX 2060.
- Processing Node: The GeForce RTX 2060 is built on a relatively old processing size of 12nm. Compared to this, the GTX 1080 gains an advantage with an 8nm processing node, taking the lead in processing node technology.
- Clock Speeds: The GeForce RTX 2060 has a base clock of 1365MHz which can be extended up to 1680MHz on boosting. Conversely, the GeForce GTX 1080 leads in clock speeds as it gets a base clock of 1607MHz, which can be boosted up to 1733MHz.
- Memory: The RTX 2060 has a GDDR6 memory type of 6GB, with its memory bus having a 192-bit width and a memory bandwidth of 336 GB/s. This is competed against the GeForce RTX 3070 which has an 8GB memory of GDDR5X type and a 256-bit memory bus of a bandwidth of 320.3 GB/s.
Previously, our comparison revealed that AMD’s RX 7900 XTX had better performance than NVIDIA’s 4070 Ti. However, this time, we will examine the performance gap between NVIDIA’s previous generations by comparing the RTX 2060 vs GTX 1080 to see which holds up better in gaming.
RTX 2060 Vs GTX 1080: Gaming Benchmarks
Previously, we have discussed the specifications of the GeForce RTX 2060 and the GeForce GTX 1080 individually. After examining the hardware specifications of the GPUs, the next step is to evaluate their real-world performance in modern gaming applications. The goal is to perform a comprehensive and precise analysis to determine the strengths and weaknesses of each graphics card in various modern games.
Testing Rig
Here are the specs of the testing rig:
- CPU: Intel Core i9-12900K
- Motherboard: MSI MPG Z790 Carbon WiFi II
- Memory: V-Color Manta xSky RGB 32GB DDR5 5600Mhz
- CPU Cooler: be quiet! Dark Rock Pro 4
- Power Supply: be quiet! Dark Power Pro 13 1300W
- Storage Drive: XPG GAMMIX S70 BLADE 2TB NVMe
- Operating System: Windows 10 Pro
Now without wasting any time, let’s jump right into the gaming benchmarks of the GeForce RTX 2060 vs GTX 1080.
Cyberpunk 2077
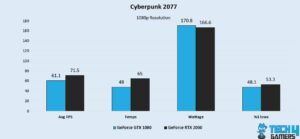
- Surpassing the GTX 1080’s 61.1 FPS, the RTX 2060 performs remarkably well, boasting a significant 15.6% increase in average FPS, achieving an impressive 71.5 FPS in Cyberpunk 2077’s benchmark tests.
- Additionally, the RTX 2060 exhibits a stronger 1% low performance compared to the GTX 1080, showcasing an improvement of 10.2% with 53.3 FPS compared to 48.1 FPS.
Strange Brigade
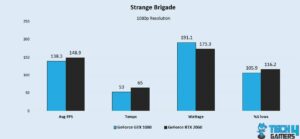
- The Strange Brigade benchmarks featured the RTX 2060 outperforming the GTX 1080, achieving an impressive 148.9 FPS compared to 138.3 FPS and boasting a 7.3% increase in average FPS.
- Furthermore, the RTX 2060 showcases better 1% low performance in comparison to the GTX 1080 with a 9.2% improvement, exhibiting 116.2 FPS as opposed to 105.9 FPS.
F1 2022
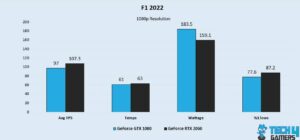
- With an impressive 10% increase in average FPS, the RTX 2060 delivers 107.3 FPS in benchmark tests and surpasses the GTX 1080’s 97 FPS in F1 2022 benchmarks.
- In addition, the RTX 2060 outperforms the GTX 1080 with regards to 1% low performance, showing an 11.6% improvement with 87.2 FPS in contrast to 77.6 FPS.
Assassin’s Creed Odyssey
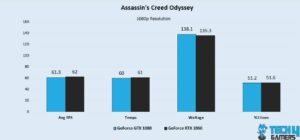
- The RTX 2060 draws a close competition, with a 1.1% increase in average FPS and achieving an impressive 62 FPS in Assassin’s Creed Odyssey benchmark tests, surpassing the GTX 1080’s 61.3 FPS.
- Moreover, the RTX 2060 barely wins against the GTX 1080 in terms of 1% low performance with a 0.7% improvement, presenting 51.6 FPS versus 51.2 FPS.
Shadow of the Tomb Raider
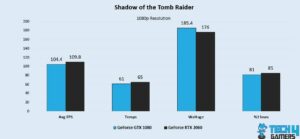
- In SOTR benchmark tests, the RTX 2060 performs well, achieving an impressive 109.8 FPS and boasting a 5% increase in average FPS, surpassing the GTX 1080’s 104.4 FPS.
- Additionally, the RTX 2060 demonstrates superior 1% low performance when compared to the GTX 1080, with a 4.8% improvement and 85 FPS in contrast to 81 FPS.
Metro Exodus
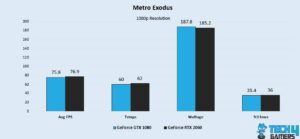
- We were surprised in Metro Exodus, as with a 1.4% decrease in average FPS, the RTX 2060 achieves 75.8 FPS in benchmark tests, compared to the GTX 1080’s 76.9 FPS.
- Furthermore, the RTX 2060 delivers enhanced 1% low performance compared to the GTX 1080, exhibiting a 1.6% improvement with 36 FPS versus 35.4 FPS.
Red Dead Redemption 2
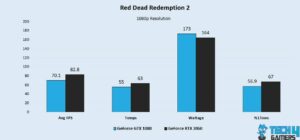
- With a significant 16.6% increase in average FPS, the RTX 2060 achieves an 82.8 FPS in RDR 2 benchmark tests, surpassing the GTX 1080’s 70.1 FPS.
- In addition, the RTX 2060 provides a superior 1% low performance than the GTX 1080 with a 16.3% increase, showing 67 FPS as opposed to 56.9 FPS.
Horizon Zero Dawn
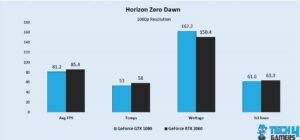
- The RTX 2060 shines in Horizon Zero Dawn benchmark, delivering performance with a 5% increase in average FPS, achieving 85.4 FPS and surpassing the GTX 1080’s 81.2 FPS.
- Moreover, the RTX 2060 offers an improved 1% low performance in comparison to the GTX 1080, showcasing a 2.7% improvement with 63.3 FPS as opposed to 61.6 FPS.
Unigine Superposition
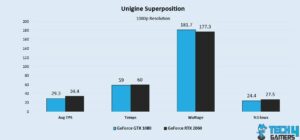
- The RTX 2060 shines in Unigine Superposition benchmark tests, delivering remarkable performance with an impressive 16% increase in average FPS, achieving 34.4 FPS and surpassing the GTX 1080’s 29.3 FPS.
- Additionally, the RTX 2060 surpasses the GTX 1080 in terms of 1% low performance, exhibiting an 11.9% improvement with 27.5 FPS as opposed to 24.4 FPS.
Time Spy
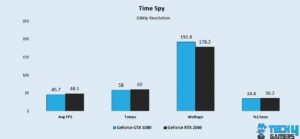
- The RTX 2060 impresses with its remarkable performance, achieving 48.1 FPS in Time Spy benchmark tests and boasting a 5.1% increase in average FPS, surpassing the GTX 1080’s 45.7 FPS.
- Furthermore, the RTX 2060 excels over the GTX 1080 when it comes to 1% low performance, showcasing a 3.9% improvement with 36.2 FPS in contrast to 34.8 FPS.
RTX 2060 vs GTX 1080 – Overall Gaming Performance
| Processor | Average FPS | 1% Lows |
|---|---|---|
| GeForce RTX 2060 | 📈 82.5 | 📉 35.1 |
| GeForce GTX 1080 | 📈 76.6 | 📉 32.6 |
| Winner: GeForce RTX 2060 | ||
In our benchmark tests, the RTX 2060 outperforms the GTX 1080 across the games we tested. In terms of FPS performance, the RTX 2060 surpasses the GTX 1080 by a margin of 7.4%, making it the better option for gaming purposes. Moreover, the TX 1080 also lagged 2.5 FPS in terms of 1% low performance.
Power Consumption
| Games | GeForce RTX 2060 (W) | GeForce GTX 1080 (W) |
|---|---|---|
| Average Power Consumption | 166.5⚡️ | 175.5⚡️ |
| Winner: GeForce RTX 2060 | ||
As per our results, we realized that the RTX 2060 proved more power efficient with a 10W lower power rating than the GTX 1080. Conclusively, the average power consumption of the RTX 2060 during benchmark testing is 5.8% more efficient than the GTX 1080, declaring the RTX 2060 as the better one.
Thermal Efficiency
| Games | GeForce RTX 2060 (°C) | GeForce GTX 1080 (°C) |
|---|---|---|
| Average Thermal Capacity | 65🌡️ | 56.9🌡️ |
| Winner: GeForce GTX 1080 | ||
After testing both graphic cards, we discovered that the GeForce GTX 1080 ran 13.2% cooler than the GeForce RTX 2060 on average despite the RTX 2060’s lower power consumption. This puts the GTX in the lead as the better thermal GPU for users requiring a cooler card for gaming.
Pricing And Availability
| GPU | MSRP | Current Price |
|---|---|---|
| GeForce GTX 1080 | 💲599 | 💲598 |
| GeForce RTX 2060 | 💲349 | 💲343 |
| Price Difference | 71.6% | 74.2% |
We also examined the pricing and availability of the GeForce RTX 2060 and GTX 1080. Despite both being old GPUs from NVIDIA, they did come with a hefty price tag. The GeForce RTX 2060 is approximately 52.7% less expensive than the GTX 1080. However, the price may fluctuate depending on the model.
GTX 1080 Vs RTX 2060: Which One Should You Get?
GeForce RTX 2060: The RTX 2060 offers a more cost-effective solution, with a 52.7% price difference and a 7.4% increase in average FPS production compared to the GTX 1080, coupled with a good gap of 5.8% in the power ratings.
GeForce GTX 1080: While the GTX 1080 may have a 13.2% better thermal efficiency, it is still behind the RTX 2060, which stands out with its impressive performance and exceptional power efficiency.
We recommend the RTX 2060 as the users get a combo of better graphics, better power ratings, and a lower price tag. The only downside is the slightly higher thermals which will not be an issue considering the tradeoffs.
More From GeForce RTX 2060:
More From GeForce GTX 1080:
Thank you! Please share your positive feedback. 🔋
How could we improve this post? Please Help us. 😔
[Comparisons Expert]
Shehryar Khan, a seasoned PC hardware expert, brings over three years of extensive experience and a deep passion for the world of technology. With a love for building PCs and a genuine enthusiasm for exploring the latest advancements in components, his expertise shines through his work and dedication towards this field. Currently, Shehryar is rocking a custom loop setup for his built.
Get In Touch: shehryar@tech4gamers.com





Feedback By: