


After the release of AMD’s Zen 4 Ryzen 7000 series, the last-generation Zen 3 Ryzen 5000 series prices have decreased significantly. Today, we will test two of this series’ high-end CPUs, Ryzen 7 5800X vs Ryzen 7 5700G, to help you understand better which of these last-gen, 8-core processors is better for your rig.
Key Takeaways
- Through extensive hands-on testing, I discovered that the Ryzen 7 5800X outperforms the 5700G, boasting a remarkable 5.1% performance advantage in 1080p gaming scenarios.
- The Ryzen 7 5700G boasts about 11.2% improvement in power efficiency over the Ryzen 7 5800X, resulting in energy savings and lower electricity costs.
- As of December 2023, the Ryzen 7 5700G is priced at $175, and the Ryzen 7 5800X is slightly higher at $208.
Comparison Table
| Feature | AMD Ryzen 7 5800X | AMD Ryzen 7 5700G |
|---|---|---|
| Codename | Vermeer | Cezanne |
| No. of Cores | 8 | 8 |
| No. of Threads | 16 | 16 |
| Base Frequency | 3.8 GHz | 3.8 GHz |
| Boost Frequency | 4.7 GHz | 4.6 GHz |
| Memory Type & Frequency | DDR4 (Up to 3200MT/s) | DDR4 (Up to 3200MT/s) |
| PCI Express® Version | PCIe 4.0 | PCIe 3.0 |
| Max. Operating Temperature | 90°C | 95°C |
| TDP | 105 watts | 65 watts |
| Integrated Graphics | None | Radeon Vega 8 |
| Launch MSRP | $449 | $359 |
| Launch Date | November 2020 | April 2021 |
| Best Motherboards | Motherboard For Ryzen 7 5800X | - |
| Best CPU Coolers | Best CPU Coolers For Ryzen 7 5800X | - |
Architectural Difference
- Architecture: The Ryzen 7 5800X and Ryzen 7 5700G showcase AMD’s Zen 3 microarchitecture, known as Vermeer. This architecture predates Zen 4, representing an earlier iteration in AMD’s evolutionary processor design.
- Process Node: Coming to the manufacturing node, these two processors are precisely designed employing the cutting-edge 7nm semiconductor technology from TSMC.
- CPU Socket: The Ryzen 7 5800X and Ryzen 7 5700G are equipped with AMD’s AM4 socket, boasting a 1331-pin configuration. More pins enhance data rate and cooling.
- CPU Memory: Comming to memory specifications, the Ryzen 7 5800X and Ryzen 7 5700G only support DDR4 memory. They have a dual-channel memory bus. Additionally, the Ryzen 7 5800X supports ECC memory, while the Ryzen 7 5700G does not.
- Clock Speed: If you look at the base clock, these processors have the same base clock of 3.8 GHz. However, regarding the boost clock, the Ryzen 7 5800X surpasses the Ryzen 7 5700G by 0.1 GHz or 2.2%.
- Integrated Graphics: AMD does not provide integrated graphics with the Ryzen 7 5800X. However, we get the Radeon Vega 8 iGPU with the Ryzen 7 5700G. It has 8 GPU cores and a max graphics frequency of 2000 MHz.
Gaming Benchmarks
Now, let’s subject both processors to comprehensive gaming benchmark assessments to gain a deeper insight into their respective performance capabilities. I examined the gaming prowess of the Ryzen 7 5800X vs Ryzen 7 5700G across a spectrum of 7 demanding games I played at 1080p resolution.
Testing Rig
The gaming rig I employed for this assessment boasted the following specifications.
- OS: Windows 10 Pro
- Motherboard: Gigabyte x570 Aorus Extreme
- GPU: Nvidia Geforce RTX 3080 10 Gb
- RAM: 32GB Corsair Vengeance RGB Pro DDR4 3600 MHz (4*8Gb)
- Storage: XPG GAMMIX S70 BLADE 2TB NVMe
- Cooler: ARCTIC Liquid Freezer II 360 – Multi-Compatible AIO Water Cooler
- Power Supply: ENERMAX Revolution DFX ATX 3.0
Cyberpunk 2077
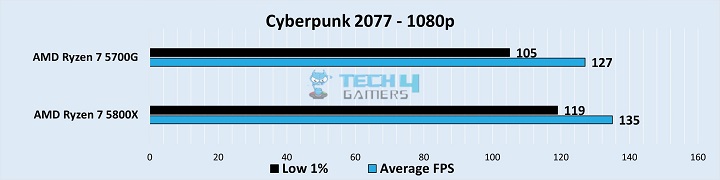
- During my first gameplay of Cyberpunk 2077, 5800X ran the game at 135 fps compared to 127 fps on 5700G. An 8 fps or 6.3% performance difference.
- Things only seem to get worse for 5700G, as 5800X manages 119 fps to widen the gap in 1% lows to a whopping 12.5% with a difference of 14 frames this time around.
Watch Dogs Legion
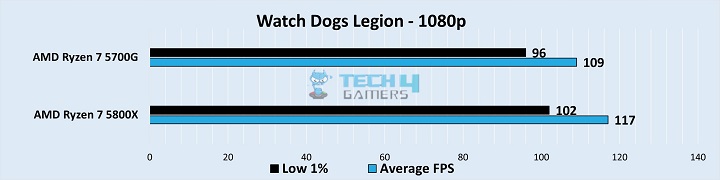
- While playing Watch Dogs Legion, I saw a similar difference of around 7% in terms of average fps in favour of our former winner, 5800X. It managed to run the game at around 117 fps, compared to the 109 fps by 5700G.
- A very predictable difference of 6% this time around. 1% lows are, again, 8 fps higher on 5800X at around 102 fps compared to 96 fps on 5700G.
Horizon Zero Dawn
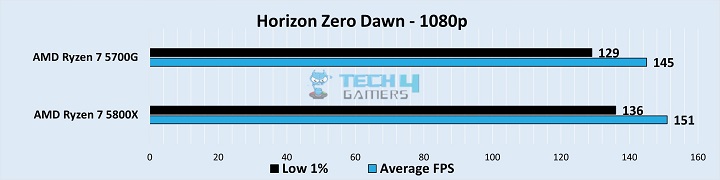
- The difference I observed in Horizon Zero Dawn was even smaller. 5800X was only 4% ahead with 151 fps average this time around in terms of average fps with a difference of 6 fps.
- Regarding 1% lows, I saw a bigger difference of around 5.2% this time. 5800X was pushing out approximately 7 more frames, averaging respectably at 136 fps compared to 129 fps on 5700G.
Red Dead Redemption 2
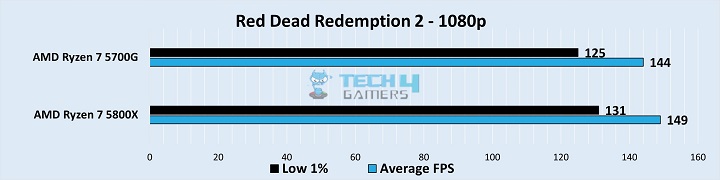
- I observed a similar trend in Red Dead Redemption 2, where the 5800X maintains a minor lead of 3.4%. The Ryzen 7 5800X runs the game at a solid 149 fps, whereas the Ryzen 7 5700G is behind at around 144 fps.
- This time, the difference in 1% lows is slightly more obvious at around 4.6%. A bigger 6 fps difference where 5800X managed to deliver 131 fps as opposed to 5700G, which would only push up to 125 fps.
Assassin’s Creed Valhalla
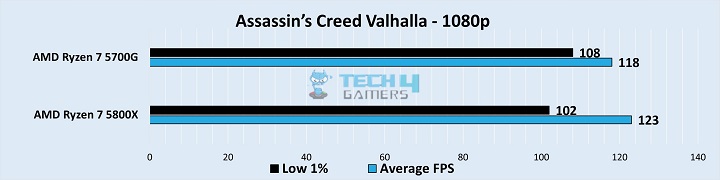
- During Assassin’s Creed Valhalla, I experienced that the game pushes out better average fps on 5800X at around 123 fps. The 5800X holds a slight 4% lead in average fps over the 5700G running the game at 118 fps.
- The 1% lows tell a different tale, however. This time, 5700G comes victorious with a lead of 6 fps this time. It was able to average around 108 fps, while the 1% lows of 5800X were at 102 fps.
Days Gone
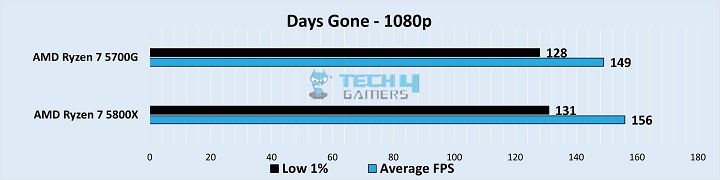
- While I was playing Days Gone, the Ryzen 7 5800X came 4.5% ahead of its competitor with a respectable 7 fps lead. It delivered a smooth experience of 156 fps compared to 5700G, struggling to reach 150 fps.
- Coming to the low 1% performance, the Ryzen 7 5700G was only short of 3 fps, averaging around 128 fps compared to 131 fps on 5800X.
Metro Exodus
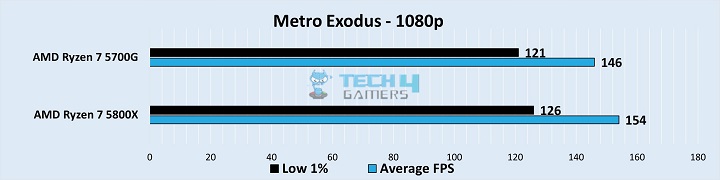
- When I played my last game, Metro Exodus, the Ryzen 7 5800X averaged around 154 fps, while the Ryzen 7 5700G delivered only 146 fps. A respectable 5% lead for 5800X.
- The difference in 1% lows was not that different either, with the 5800X being 4% ahead while averaging around 126 fps, compared to 121 fps on 5700G.
Overall Gaming Performance
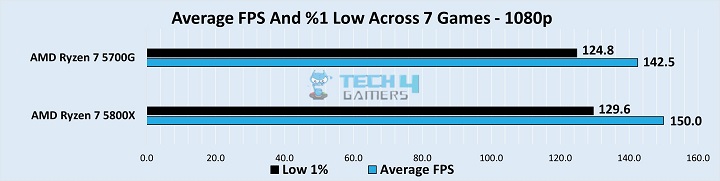
In my firsthand experience, testing the 5800X and 5700G at 1080p in seven modern AAA titles revealed a notable performance difference. The 5800X averaged 150 fps, surpassing the 5700G, which scored 142.5 fps. This translates to a 5.1% improvement in average fps for the 5800X compared to the 5700G.
Based on my gaming tests, there was a marginal 3.7% variance in 1% lows between the 5800X and 5700G. The 5800X maintained superiority with an average of 129.6 fps, while the 5700G closely followed at 124.8 fps.
Power Consumption
The Ryzen 7 5700G’s design TDP is just 65 watts. Compared to that, the Ryzen 7 5800X has a 47% higher TDP at 105 watts. These, however, are just numbers on paper. Let’s see how much power our CPUs actually draw during a stress test.
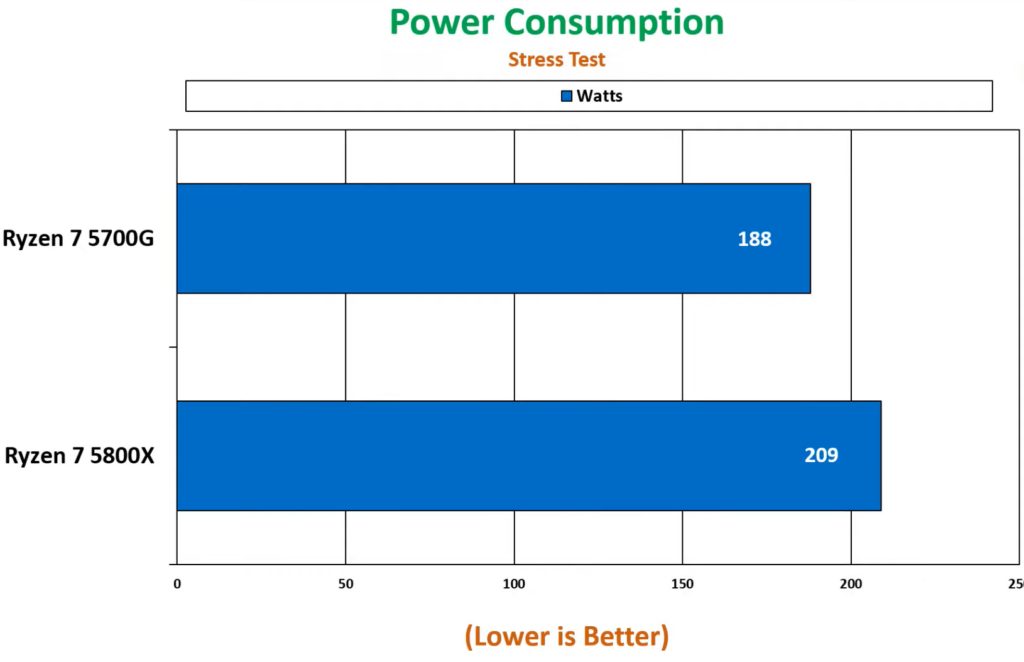
The difference in power consumption is not nearly as drastic as the difference in TDP. During my stress test, the Ryzen 7 5700G drew 11.2% less power than the Ryzen 7 5800X despite having a 47% lower TDP. It was drawing around 188 watts of power compared to 5800X, which was just drawing a little over 209 watts.
Pricing And Availability
At the time of launch, AMD introduced the Ryzen 7 5700G at a really attractive price of $360, whereas the Ryzen 7 5800X was a bit costlier at around $450. However, both of these CPUs are available for much cheaper than that.
Regarding current market prices, you can find 5700G for as low as $175 on Amazon now. On the other hand, 5800X is retailing at around $208. Moreover, these CPUs are still readily available in the market.
Both of these are good options for the price they are being sold at. 5700G sounds like a better bang for the buck since it’s approximately 20% cheaper.
What Do I Recommend?
Ryzen 7 5700G: Consider opting for the Ryzen 7 5700G for a budget-friendly choice with integrated graphics. Not only does it offer cost savings, but it also delivers commendable performance. Additionally, its energy-efficient design contributes to lower electricity expenses.
Ryzen 7 5800X: If you possess a dedicated GPU, particularly one equipped with PCI Express 4.0, and you’re keen on unlocking unparalleled performance while being open to a slightly higher investment, the 5800X stands out as the optimal choice. The 5800X excels at efficiently managing multi-core tasks, showcasing superior performance in handling parallel workloads.
More From Ryzen 7 5800X:
Thank you! Please share your positive feedback. 🔋
How could we improve this post? Please Help us. 😔
[Comparisons Expert]
Abdemanaf is a skilled creative writer who has been honing his craft since 2011. While initially working in different fields, he found a passion for technology and has been exploring the tech world since early 2015. Over the years, he has developed an in-depth knowledge of the latest tech trends and product offerings by various companies.
Abdemanaf’s writing reflects his analytical mindset and ability to think critically. He has a knack for breaking down complex technical information into easily digestible pieces, making his articles engaging and accessible to readers from all backgrounds. In February 2022, he joined Tech4Gamers as a blog and product comparison writer, where he has been able to hone his skills further.
As a writer, Abdemanaf is dedicated to staying up-to-date with the latest technological advancements and trends, enabling him to provide readers with the most relevant and accurate information. He is always eager to learn more and is constantly seeking new challenges to improve his skills.
Get In Touch: manaf@tech4gamers.com


