")


Intel Core i9-12900K
Rated: 8.4/10
Intel Core i9-12900KS
Rated: 8.2/10
Pros & Cons
| CPU | Pros | Cons |
|---|---|---|
| i9-12900K | ✅ Cost-effective choice for gamers ✅ Lower Thermal Design Power (TDP) for power efficiency ✅ Comparable gaming performance with i9-12900KS | ❌ Lower productivity performance ❌ Limited boost clock speed on P-Cores ❌ Lower overall productivity speed |
| i9-12900KS | ✅ Slight 5% performance boost in productivity tasks ✅ Marginally higher boost clock speed on P-Cores ✅ Suitable for users focused on productivity | ❌ Higher price compared to i9-12900K ❌ Higher TDP, potentially generating more heat ❌ Incremental performance gain may not justify the cost |
- The i9-12900K outperforms the i9-12900KS by 1% in FPS despite being 27% pricier, with lower TDP, offering similar gaming performance and cost savings.
- In terms of power efficiency, the i9-12900K has a lower TDP than the i9-12900KS, making it a more power-efficient option.
- The i9-12900KS shows a 27.5% price difference compared to its MSRP, while the i9-12900K exhibits a 24.6% difference.
- The i9-12900KS is faster, but the i9-12900K offers better performance per dollar.
Comparison Table
| CPU | i9-12900K | i9-12900KS |
|---|---|---|
| Generation | 12 | 12 |
| Hyperthreading | Yes | Yes |
| Overclocking | Yes | Yes |
| iGPU | Intel UHD Graphics 770 | Intel UHD Graphics 770 |
| Socket | LGA 1700 | LGA 1700 |
| Memory Speed | DDR4-3200, DDR5-4800 | DDR4-3200, DDR5-4800 |
| L3 Cache | 30 MB (Shared) | 30 MB (Shared) |
Architectural Differences
- Core/Thread Counts: The Intel i9-12900K and i9-12900KS both have 16 cores and 24 threads, delivering strong processing power for multitasking and parallel computing.
- Clock Speeds: Both processors have the same base and boost clock speeds for their E-Cores, running at 2.5 GHz base and 4.0 GHz boost. However, the i9-12900KS outshines the i9-12900K with a higher P-Core boost clock of 5.5 GHz compared to 5.2 GHz.
- Memory Support: Both CPUs support DDR4-3200 and DDR5-4800 memory, allowing users to choose their preferred type. With a maximum memory capacity of 128 GB, users can harness the benefits of high-speed memory for improved overall system performance.
- TDP (Thermal Design Power): The i9-12900K has a TDP ranging from 125W to 241W, while the i9-12900KS has a slightly higher TDP of 150W to 241W. This means the i9-12900KS might produce more heat and need better cooling for top performance.
Get ready for a showdown between Intel’s heavy hitters – the i9-12900K and its newer sibling, the i9-12900KS. Is the 12900KS worth the extra bucks compared to its predecessor, the 12900K? We’ll break down the on-paper specs and dive into the real-world performance.
Gaming Benchmarks
Let’s compare the Intel i9 12900K and the Intel i9 12900KS through various tests at 1080P resolution with ultra settings.
Testing Rig
- Motherboard: ASUS ROG Strix Z790-E Gaming
- GPU: GeForce RTX 4090 24GB
- Memory: V-Color Manta xSky RGB 32GB DDR5 5600Mhz
- SSD: Sabrent Rocket 4 Plus G 2TB
- Power Supply: ENERMAX REVOLUTION D.F. X 1050W
- CPU Cooler: be quiet! Dark Rock Pro 4
- OS: Windows 11
Shadow of the Tomb Raider
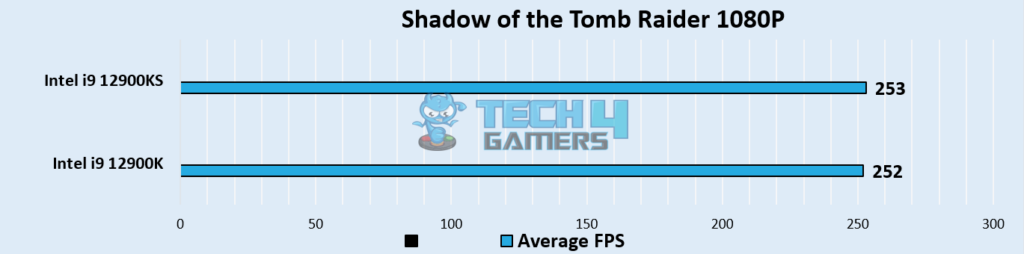
- Separate tests reveal negligible distinctions, showcasing the i9-12900K and i9-12900KS with remarkably similar results in Shadow of the Tomb Raider for 252 vs 253 FPS.
Red Dead Redemption 2
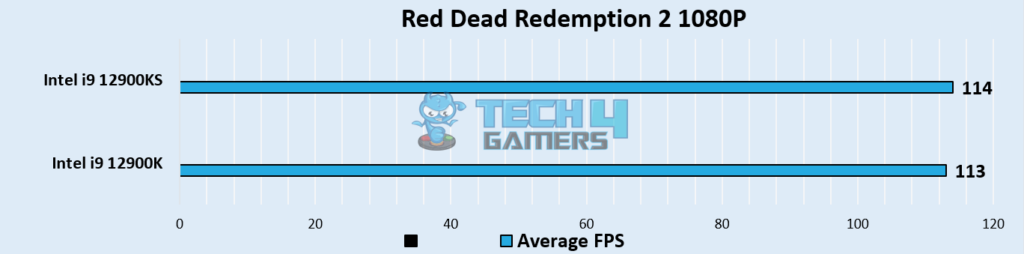
- Rockstar Games’ Red Dead Redemption 2 isn’t well-optimized. The i9-12900K(113 FPS) and i9-12900KS show similar FPS, with a slight edge to the 12900KS at 114 FPS due to its extra 300 MHz.
Far Cry 5
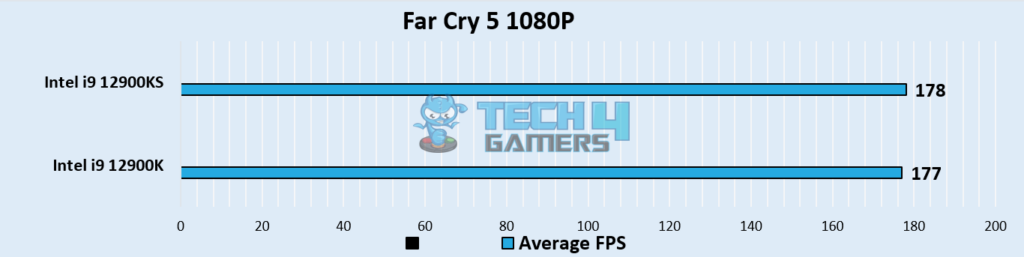
- Ubisoft’s Far Cry 5, despite having a high-end graphics card, is very CPU-intensive. The i9-12900K, at 177 FPS, and the i9-12900KS, at 178 FPS, show no significant FPS difference.
Doom Eternal
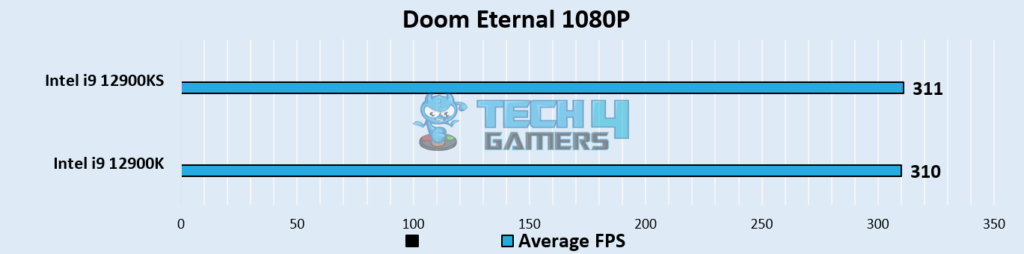
- Doom Eternal fails to widen the 1 FPS gap. Both CPUs, the i9-12900K at 310 FPS and the i9-12900KS at 311 FPS, demonstrate no significant difference in FPS.
Cyberpunk 2077
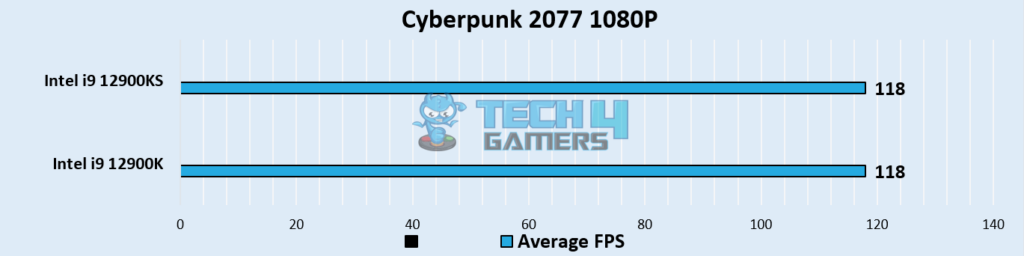
- Both processors in Cyberpunk 2077 perform similarly. The 12900K and 12900KS achieve 118 FPS, prioritizing price-per-performance, although customers often prefer raw performance.
Counter-Strike: Global Offensive
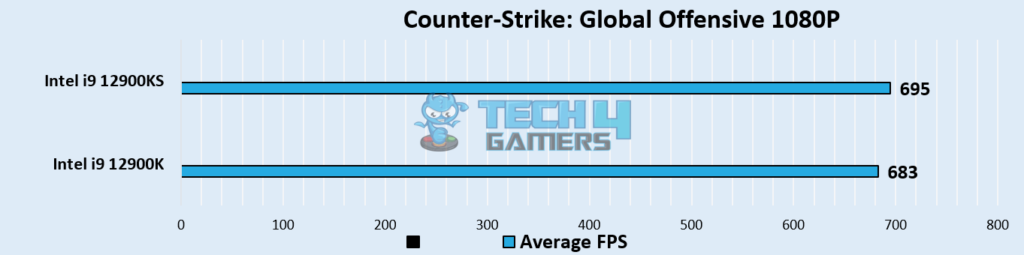
- Comparing the 12900K’s 683 FPS to the 12900KS’s 695 FPS reveals a slight gap. If you seek high core frequency for Counter-Strike: Global Offensive, the i9-12900KS could be your option.
Overall Gaming Performance
| Processor | Average FPS |
|---|---|
| i9-12900K | 📈 301.83 |
| i9-12900KS | 📈 303.17 |
| Winner: Intel i9-12900KS | |
The percentage difference between the average FPS of the i9-12900K and i9-12900KS is approximately 0.44%. Judging by this difference, the i9-12900KS is marginally better in average FPS than the i9-12900K.
Price And Availability
| CPU | MSRP | Current Price |
|---|---|---|
| i9-12900K | 💲599 | 💲590 |
| i9-12900KS | 💲739 | 💲750 |
| Price Difference | 24.6% | 27.5% |
The i9-12900KS shows a 27.5% price difference compared to its MSRP, while the i9-12900K exhibits a 24.6% difference. While the i9-12900KS may offer slightly better performance, the significant increase in price raises questions when compared to the more economical i9-12900K.
What Do We Recommend?
Intel Core i9-12900K: The 12900K is cost-effective for gamers. It offers comparable gaming performance with lower thermal design power (TDP) for power efficiency. It suits those looking for good gaming performance without breaking the bank.
Intel Core i9-12900KS: The 12900KS provides a slight 5% performance boost in productivity tasks and features a marginally higher boost clock speed on its performance cores. It’s ideal for users focused on productivity who are willing to pay extra for incremental performance gains.
Consider the i9-12900K for better price and performance, while the i9-12900KS offers a 5% boost for those willing to invest. Overall, the i9-12900K stands out for its value in gaming and productivity.
More From Core i9-12900KS:
- Core i9-12900KS vs Core i7-13700K
- Core i9-12900KS vs Core i9-13900K
- Ryzen 7 5800X3D vs Core i9-12900KS
Thank you! Please share your positive feedback. 🔋
How could we improve this post? Please Help us. 😔
[Comparisons Expert]
Abdemanaf is a skilled creative writer who has been honing his craft since 2011. While initially working in different fields, he found a passion for technology and has been exploring the tech world since early 2015. Over the years, he has developed an in-depth knowledge of the latest tech trends and product offerings by various companies.
Abdemanaf’s writing reflects his analytical mindset and ability to think critically. He has a knack for breaking down complex technical information into easily digestible pieces, making his articles engaging and accessible to readers from all backgrounds. In February 2022, he joined Tech4Gamers as a blog and product comparison writer, where he has been able to hone his skills further.
As a writer, Abdemanaf is dedicated to staying up-to-date with the latest technological advancements and trends, enabling him to provide readers with the most relevant and accurate information. He is always eager to learn more and is constantly seeking new challenges to improve his skills.
Get In Touch: manaf@tech4gamers.com


