 Threads

Intel’s Raptor Lake CPUs have taken the market by storm, with many Alder Lake users considering an upgrade. Today, I’m comparing the Core i9-12900KS vs Core i7-13700K. The former is the fastest Intel CPU of its generation, while the latter is the new mainstream Core i7 chip, replacing the Core i7-12700K. Let’s see how the two compare.
Key Takeaways
- Both the Core i9-12900KS and Core i7-13700K have very similar specifications. They are also based on the same Hybrid Core Architecture and share the same Intel 7 node.
- In my six 1080P gaming benchmarks, the Core i7-13700K proved 5.2% faster than the Core i9-12900KS.
- Furthermore, my performance analysis showed that the Core i7-13700K is 7.1% more power-efficient than the Core i9-12900KS in 1080P gaming.
- In terms of thermals, both the CPUs are very similar and differ by less than 1% in temperatures across my 1080P performance tests.
Comparison Table
Here’s how the CPUs compare in specifications:
| CPU | Core i9-12900KS | Core i7-13700K |
|---|---|---|
| Architecture | Hybrid Core | Hybrid Core |
| Codename | Alder Lake | Raptor Lake |
| CPU Socket | LGA1700 | LGA1700 |
| Cores | 8P, 8E (16 cores) | 8P, 8E (16 cores) |
| Threads | 24 | 24 |
| Base Clock |
|
|
| Boost Clock |
|
|
| Unlocked for Overclocking | Yes | Yes |
| Integrated Graphics | Intel UHD 770 | Intel UHD 770 |
| Default TDP | 150W | 125W |
| Max. Boost Power | 241W | 253W |
| Max. Operating Temperature | 90°C | 100°C |
| Die Size | 215mm² | 257mm² |
| Manufacturing Process | Intel 7 (10nm) | Intel 7 (10nm) |
| L1 Cache |
|
|
| L2 Cache |
|
|
| L3 Cache | 30MB | 30MB |
| PCIe Version | Gen 5 | Gen 5 |
| Memory Type & Speed |
|
|
| Release Date | Apr 5th, 2022 | Sept 27th, 2022 |
| MSRP | $739 | $409 |
| Best CPU Coolers | – | Best Memory for Core i7-13700K |
| Best Motherboards | – | Best Memory for Core i7-13700K |
| Best Memory | – | Best Memory for Core i7-13700K |
Core i9-12900KS vs Core i7-13700K
Architectural Differences
- Clock Speeds: Starting with the clock speeds, both CPUs have the same base clock speeds for both the P-cores and E-cores. As for the boost frequencies, the Core i9-12900KS can be pushed up to 5.2 GHz for the P-cores, which the Core i7-13700K betters with 5.3 GHz. Similarly, for the E-cores, the Core i9-12900KS has a boost clock frequency of 4.0 GHz, and the Core i7-13700K pushes that up to 4.20 GHz.
- Cache: The Raptor Lake Core i7s get an upgrade to 4MB of L2 cache per E-core cluster. With each cluster having 4 cores and 2 clusters in total, we get 8MB of L2 cache from the E cores. The Core i9-12900KS contains 2MB of L2 cache for every 4 E cores. Thus, the Core i7-13700K features 30MB of L2 cache, compared to 24MB of the Core i9-12900KS.
- TDP: In terms of the base TDP, the Core i7-13700K is the better CPU with a rating of 125 watts compared to the 150 watts of the Core i9-12900KS. However, the i7-13700K does have a higher boost TDP rating of 253 watts, while the Core i9-12900KS draws a maximum of 241 watts.
Similar Comparison: Core i9-12900KS vs Ryzen 7 5800X3D
Gaming Performance
Let’s see how these two CPUs stack against each other in gaming. I’ll compare their performance across 6 games, all tested at 1080P resolution with ultra or equivalent settings.
Note: The recorded figures may differ slightly from the actual figures due to shortcomings of the monitoring software.
Test Bench
- OS – Windows 11
- CPU Cooler – Cooler Master MasterLiquid Lite ML240L RGB
- SSD – XPG Gammix S70 Blade 2TB NVMe
- Power Supply – ENERMAX REVOLUTION D.F. X 1050W
- GPU – GIGABYTE RTX 3070 VISION OC
Hitman 3
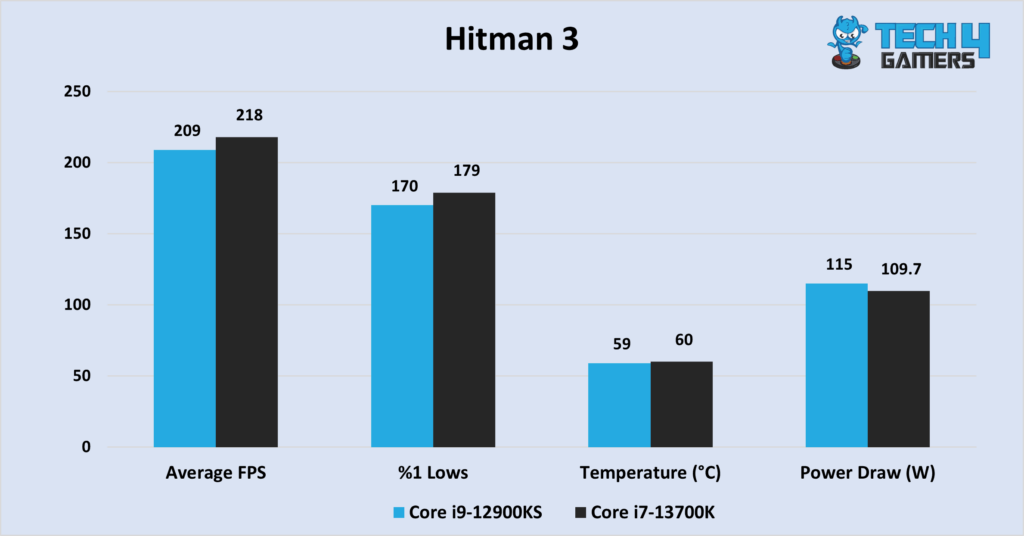
- Starting my benchmark tests with Hitman 3, I observed that the i7-13700K took a 4.3% lead with an average of 218 FPS. The Core i9-12900KS, in turn, scored 209 FPS, indicating a slight performance advantage for the Core i7-13700K.
- Examining the %1 low figures, I noticed another win for the Core i7-13700K, which outscored the Core i9-12900KS by 5.2% in terms of minimum frame rates.
- Turning my attention to temperatures, I found that the Core i9-12900KS ran at around 59°C, while the Core i7-13700K ran 1°C hotter, suggesting similar thermal performance between the two processors.
- Additionally, I observed that the Intel Core i9-12900KS showed slightly higher power consumption, drawing 115 watts, compared to the Raptor Lake Core i7-13700K.
Cyberpunk 2077
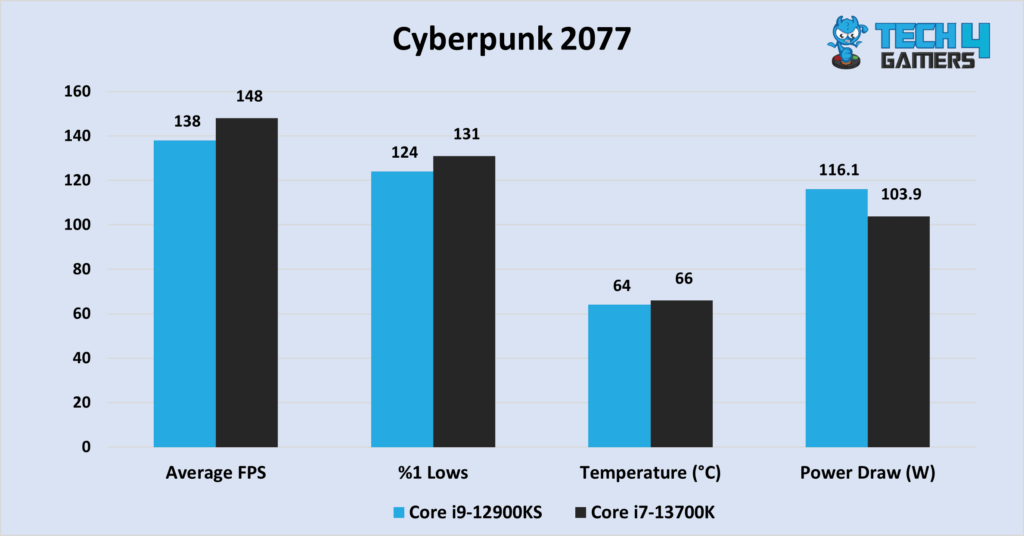
- Moving on to Cyberpunk 2077, I found that the Core i9-12900KS lagged behind the Core i7-13700K by 7.2% in terms of average FPS.
- In terms of %1 low FPS, the Core i7-13700K maintained a lead with 131 FPS, while the Core i9-12900KS managed 124 FPS, indicating better minimum frame rates for the Core i7-13700K.
- Another win for the Core i9-12900KS was in terms of thermal performance, as it ran 2°C cooler compared to the Core i7-13700K.
- However, the Core i9-12900KS proved to be more power-hungry in Cyberpunk 2077, drawing 11.7% more power than the Core i7-13700K.
Far Cry 6
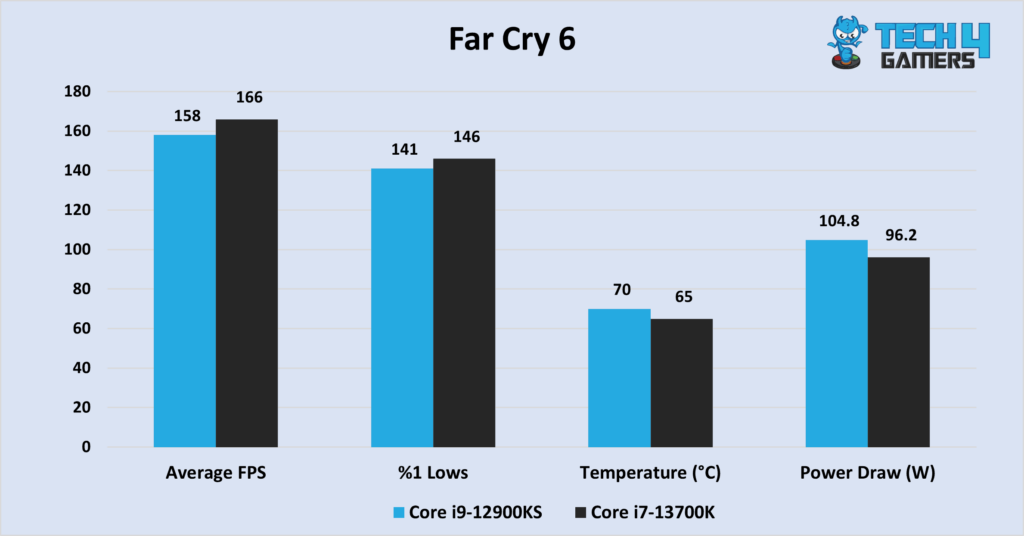
- In my testing of Far Cry 6, the Core i7-13700K managed another marginal lead, averaging 166 FPS, while the Core i9-12900KS replied with 158 FPS on average.
- Looking at the %1 lows, the Core i9-12900KS trailed the Core i7-13700K again, but this time by 3.5%, indicating slightly lower minimum frame rates.
- However, things took a turn in terms of thermal performance as the Core i9-12900KS reached the 70°C mark, while the Core i7-13700K ran at around 65°C, making it 7.6% cooler.
- The Core i7-13700K outperformed the Core i9-12900KS in terms of power efficiency, drawing 96.2 watts on average, which is notable.
Also Read: Intel i9-12900K vs i9-12900KS
God of War
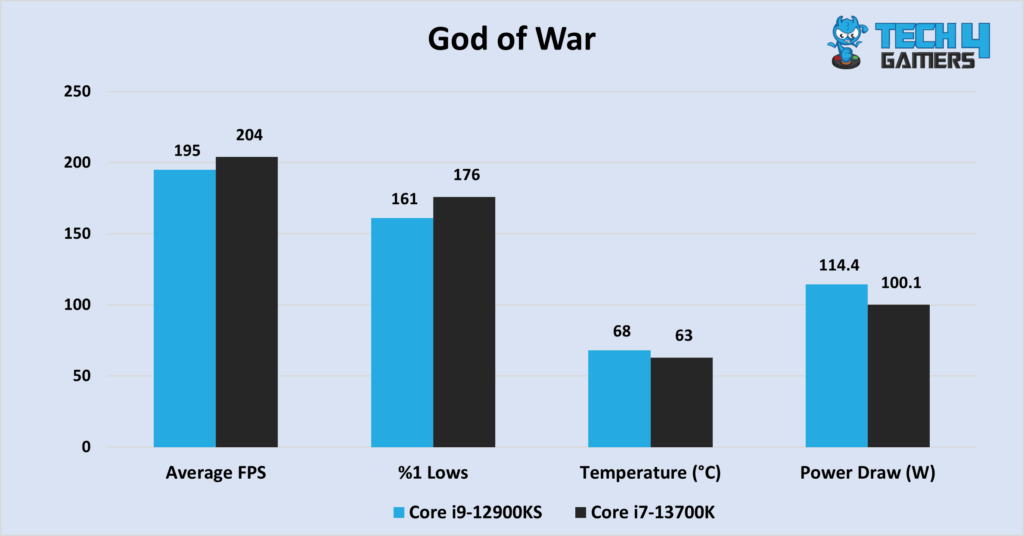
- In my God of War performance analysis, the Core i7-13700K continued to impress with an average of 204 FPS, while the Core i9-12900KS trailed slightly with 195 FPS, indicating a 4.6% difference.
- When examining the %1 lows, I found the Core i7-13700K extending its lead to 9.3% with 176 FPS, suggesting more stable minimum frame rates.
- Unfortunately, the Core i9-12900KS continued to lag behind in thermal performance, reaching around 68°C, while its competitor averaged 63°C, a 7.9% difference in temperature.
- In terms of power consumption, the Core i9-12900KS drew 14.2% more power compared to the Core i7-13700K, showing a notable difference in power efficiency.
Assassin’s Creed: Valhalla
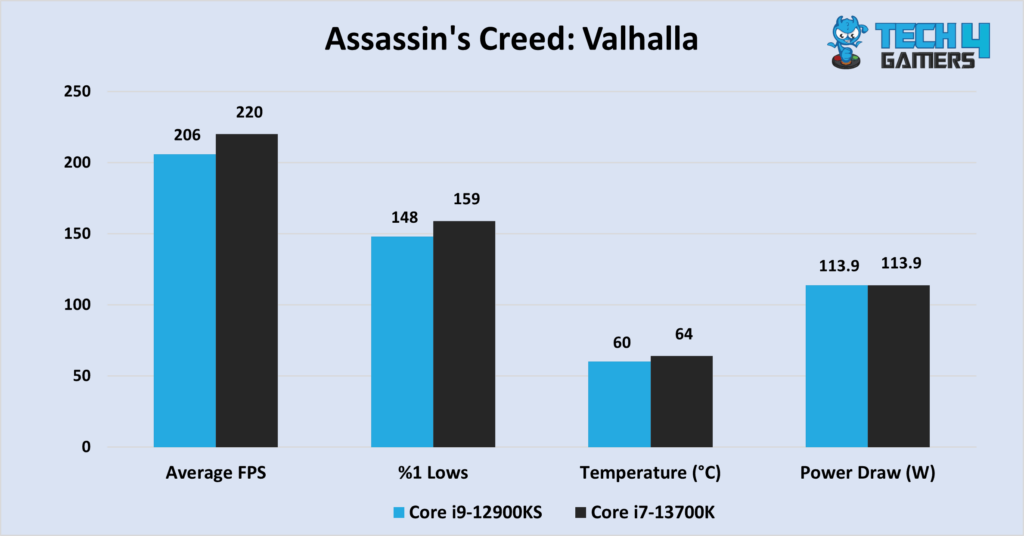
- Next, I tested Assassin’s Creed: Valhalla. Here, the Core i9-12900KS continues to trail behind the i7-13700K, with an average of 206 FPS.
- When considering the %1 low FPS, the i7-13700K scores 159 FPS, while the Core i9-12900KS scores 148 FPS, showcasing a 6.9% difference.
- The Core i9-12900KS outshines its competitor in thermal performance, averaging just around 60°C, compared to the i7-13700K, which runs 4°C hotter, demonstrating a 6.7% difference in temperature.
- A rare coincidence occurs as both CPUs draw the same amount of power on average, at 113.9 watts, emphasizing identical power consumption.
Horizon Zero Dawn
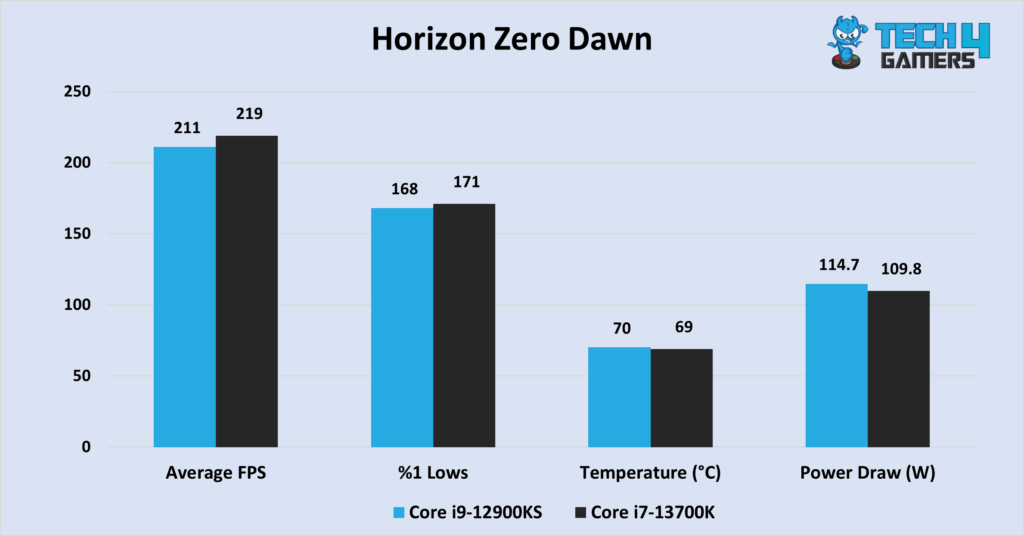
- Average FPS: Core i7-13700K maintains its lead with an average of 219 FPS, making it 3.6% faster than Core i9-12900KS, which achieves 211 FPS.
- 1% Lows: Core i7-13700K maintains a marginal 1.7% lead over Core i9-12900KS in terms of 1% lows.
- Temperatures: Core i9-12900KS reaches 70°C, while Core i7-13700K runs 1°C cooler, indicating a slight difference in thermal performance.
- Power Draw: Core i9-12900KS has an average power draw of 114.7 watts, whereas Core i7-13700K consumes 109.8 watts, making it 4.4% more power-efficient.
Overall Gaming Performance
Let’s look at the average FPS and %1 low FPS across the 6 games to summarize the gaming benchmarks.
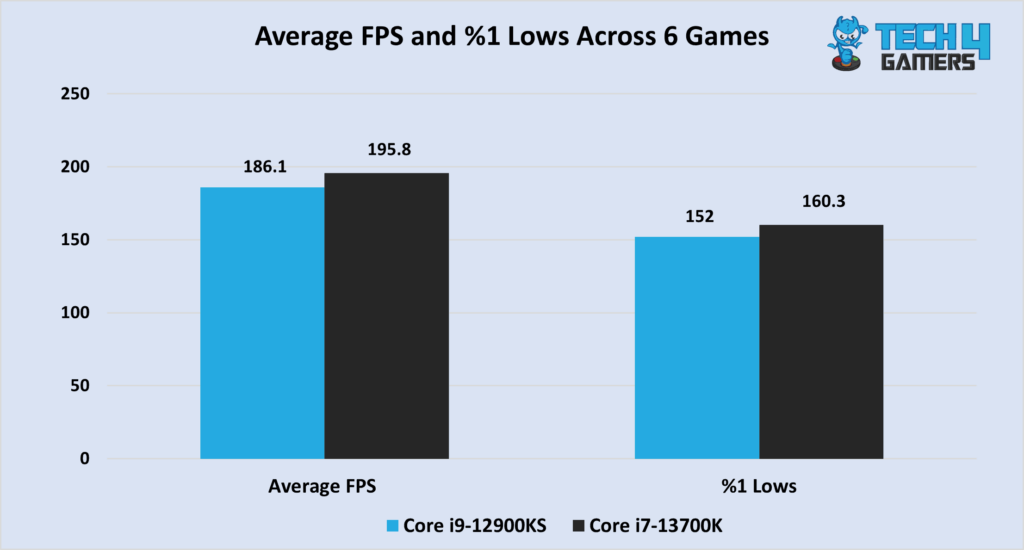
- Average FPS (1080P Gaming): Core i7-13700K averages 195.8 FPS, making it 5.2% faster than Core i9-12900KS, which averages 186.1 FPS.
- 1% Lows: Core i7-13700K achieves 160.3 FPS in 1% lows, surpassing Core i9-12900KS by 5.46%, as it scored 152 FPS.
Also Read: Intel i7-13700k Vs Ryzen 7 7700X
Power Consumption
Next, a look at the power consumption numbers across the six tested games.
Reminder:
- Core i9-12900KS Base TDP: 150W
- Core i7-13700K Base TDP: 125W (20% lower)
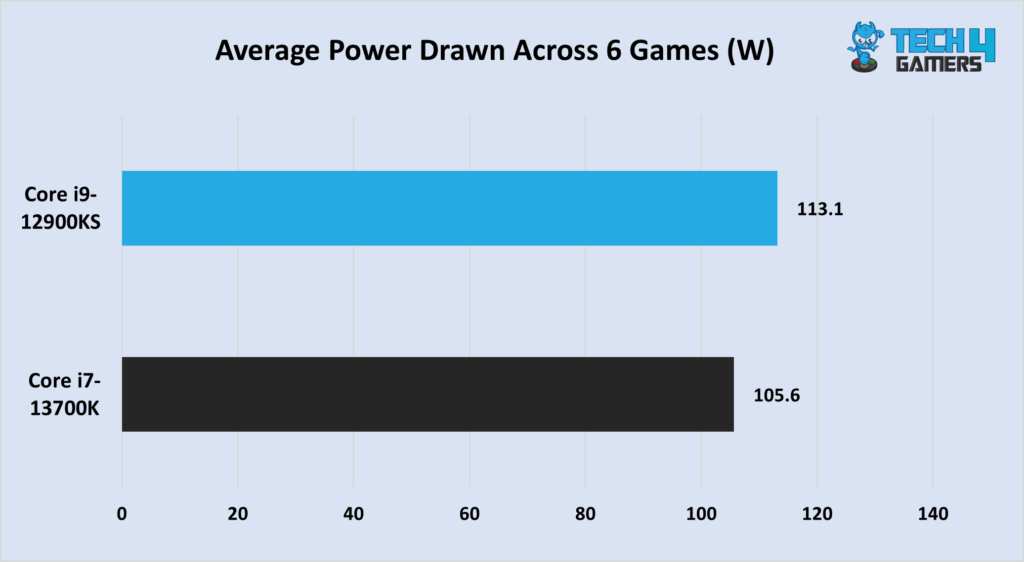
- Across my six benchmarks, the Core i9-12900KS drew 113.1 watts on average, while the Core i7-13700K used 105.6 watts. This makes the Core i7-13700K 7.1% more power-efficient in 1080P gaming.
- The CPU with the lower base TDP wins, though not by a significant margin.
Thermal Performance
The Core i7-13700K was the more power-efficient CPU, but is it also more thermally efficient? Let’s see.
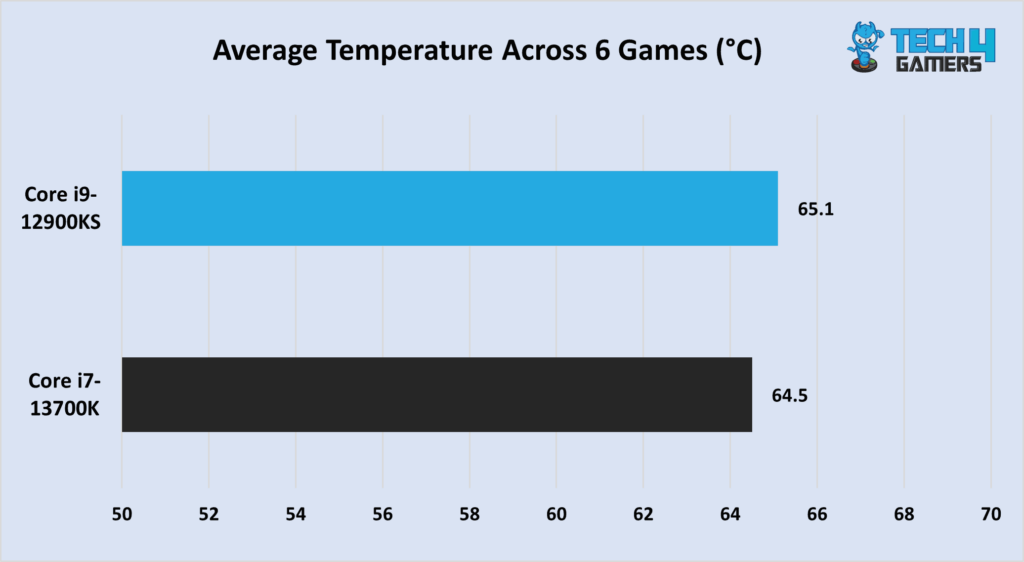
- In terms of temperatures, I observed that the Core i9-12900KS averaged 65.1°C across my six tests. In comparison, the Core i7-13700K ran slightly cooler, at 64.5°C.
- Therefore, the Core i7-13700K is not even 1% better than the Core i9-12900KS in terms of thermal performance when it comes to 1080P gaming.
CPU Cost And Electricity Prices
Since the Core i9-12900KS costs almost half of its launch MSRP now (around $419), it’s evenly matched with the Core i7-13700K (~$417) in terms of CPU prices. Furthermore, both CPUs support the same chipsets, so the question of platform costs does not come into consideration.
The two CPUs also share very similar power draw ratings. However, the Core i7-13700K is the more efficient CPU at a base frequency and could be slightly more economical if you’re running your CPU at stock settings.
In my 1080P gaming performance analysis, I found that the Core i7-13700K was 7.1% more power-efficient than the Core i9-12900KS. But, since the Core i7-13700K has a slightly higher boost TDP rating, it could cost more if your focus is on 4K gaming or productivity tasks.
Also Check: i7-13700K vs Ryzen 9 7900X
Core i7-13700K Vs Core i9-12900KS: Which CPU Do I Recommend?
- Both the Core i9-12900KS and Core i7-13700K are solid CPUs for gaming. Even though the two CPUs are from different lineups, their specifications are very similar, and they’re also based on the same architecture. Furthermore, they have comparable prices.
- Both the CPUs performed very well in 1080P gaming, but the i7-13700K proved to be faster. What gives the Core i7-13700K an advantage is its slightly better power efficiency, as I analyzed in my benchmarks. Additionally, it has improved DDR5 memory support. Thus, I recommend the Core i7-13700K over the Core i9-12900KS.
Pros And Cons
| CPU | Pros | Cons |
|---|---|---|
| Core i9-12900KS |
|
|
| Core i7-13700K |
|
|
More From Core i7-13700K
Thank you! Please share your positive feedback. 🔋
How could we improve this post? Please Help us. 😔
[Hardware Reviewer]
Hi! I’m Ali Tauseef, and I have been writing for Tech4Gamers since 2022. I love all things computer hardware but am particularly fond of CPUs and motherboards, and I like to stay up-to-date about the latest advancements in these worlds, and when possible, write about it. When I’m not doing that, I like to get into a little FPS action in CS2 or get lost in the vast world of RDR2.
Get In Touch: ali@tech4gamers.com


