")


AMD Ryzen 7 7800X3D
Rated: 9.5/10
Intel Core i9-13900K
Rated: 9.4/10
Pros And Cons
| GPU | Pros | Cons |
|---|---|---|
| AMD Ryzen 7 7800X3D | ✅ Highly power efficient ✅ Superb performance in low budget | ❌ Lower clock speed ❌ Only 8 cores & 16 threads |
| Intel Core i9-13900K | ✅ High cores and thread count ✅ Brilliant gaming at all resolutions | ❌ Not energy efficient ❌ Runs pretty hot |
- In our gaming performance tests at 1080p, the Core i9-13900K blows out the Ryzen 7 7800X3D by a margin of about 7.4%.
- Comming to processor efficency, the Ryzen 7 7800X3D is about 78% more power efficient, with both processors having similar thermal management capabilities.
- According to the latest market rates, the Ryzen 7 7800X3D is priced at around $383, whereas the Core i9-13900K remains significantly more expensive at about $549.
- We recommend the Core i9-13900K for its superior gaming performance and the Ryzen 7 7800X3D for its power efficiency and value at a low cost.
Comparison Table
| Feature | AMD Ryzen 7 7800X3D | Intel Core i9-13900K |
|---|---|---|
| No. of Cores | Total: 8 | Total Cores: 24 (P-Cores 8, E-Cores 16) |
| No. of Threads | 16 | 32 |
| Base Clock | 4.20 GHz | P-core base: 3.00 GHz E-core base: 2.20 GHz |
| Boost Clock | Max Turbo: Up to 5.0GHz | P-core: 5.40 GHz E-core: 4.30 GHz Max Turbo: 5.80 GHz |
| Integrated Graphics | AMD Radeon Graphics | Intel UHD Graphics 770 |
| iGPU Boost Clock | 2200 MHz | 1650 MHz |
| Best Motherboard | Best Motherboards For Ryzen 7 7800X3D | Best Motherboards For i9-13900K |
| Best RAM | Best RAM For Ryzen 7 7800X3D | Best RAM For Core i9-13900K |
| Best Cooler | Best CPU Coolers For Ryzen 7 7800X3D | Best CPU Coolers For Core i9-13900K |
Architectural Difference
- Architecture: The Core i9-13900K features Intel’s hybrid Raptor Lake core architecture, and the Ryzen 7800X3D offers AMD’s Zen 4 microarchitecture.
- CPU Socket: The Ryzen 7 7800X3D employs an AMD AM5 socket (LGA 1718), whereas the Core i9-13900K has an Intel’s FCLGA 1700 socket.
- CPU Memory: The Core i9-13900K supports DDR4 and DDR5 memory with speed of 5600 MT/s, whereas the Ryzen 9 7800X3D uses DDR5 memory exclusively, with a max speed of 5200 MT/s.
- Clock Speed: If we look at these CPU specs, the Ryzen 7 7800X3D has 40% greater base clock, while the Core i9-13900K beats the Ryzen 7 7800X3D by 16% in turbo clock.
- TDP: The Ryzen 7 7800X3D has a default TDP of 120W. In contrast, the Core i9-13900K has a processor Base Power of 125W and a maximum turbo power of 253W.
The Ryzen 7 7800X3D is an AMD gaming processor with next-gen AMD 3D-V cache technology for low latency and optimal gaming performance. The Intel Core i9-13900K is a top processor from Intel’s 13th generation, offering excellent gaming and productivity performance. In Ryzen 7 7800X3D vs Core i9-13900K, we will deeply examine the features and gaming skills of the two processors.
Gaming Benchmarks
After inspecting their technical specifications, let’s discuss the gaming abilities of the Ryzen 7 7800X3D vs Core i9-13900K. Here, we will analyze the skills of these processors in 10 demanding games at 1080p resolution. The system we used to conduct the benchmarks had the following specifications.
Gaming Rig
- GPU: Nvidia GeForce RTX 4090 24GB
- Motherboards: Gigabyte X670E AORUS Master, MSI MEG Z790 ACE MAX Motherboard
- RAM: XPG Lancer RGB 32GB 7200MHz DDR5 Ram
- SSD: Sabrent Rocket 4 Plus 1TB NVMe SSD
- Power Supply: ENERMAX REVOLUTION D.F. X 1050W
- CPU Cooler: be quiet! Dark Rock Pro 4
A Plague Tale: Requiem
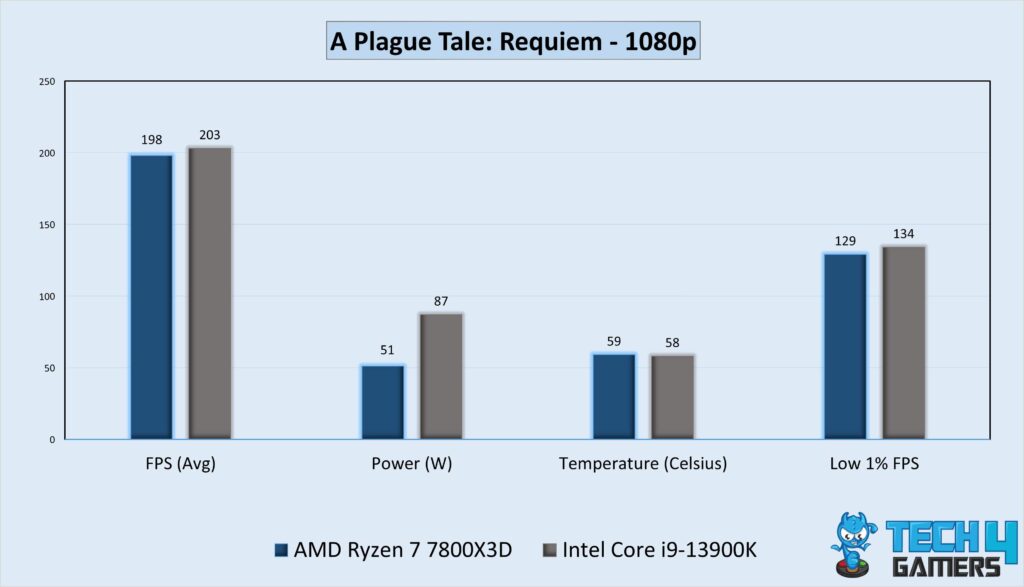
- In A Plague Tale: Requiem at 1080p, we noticed that the Core i9-13900K delivered 203 FPS on average, 2.52% better than the Ryzen 7 7800X3D’s 198 FPS.
- The Ryzen 7 7800X3D delivered a low 1% frame rate of 129 FPS, while the Core i9-13900K delivered 134 FPS.
Counter-Strike: Global Offensive
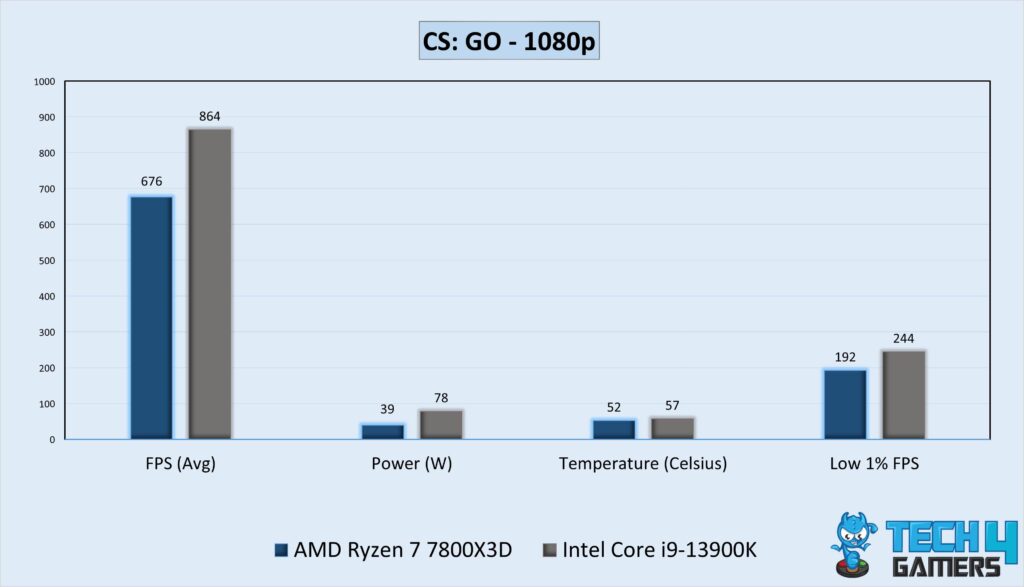
- During our CS: GO session, the performance of the Core i9-13900K was 27.8% better than the Ryzen 7 7800X3D’s 676 FPS.
- In terms of low 1%, the Core i9-13900K produced a frame rate of 244 FPS compared to the Ryzen 7 7800X3D’s 192 FPS.
Cyberpunk 2077
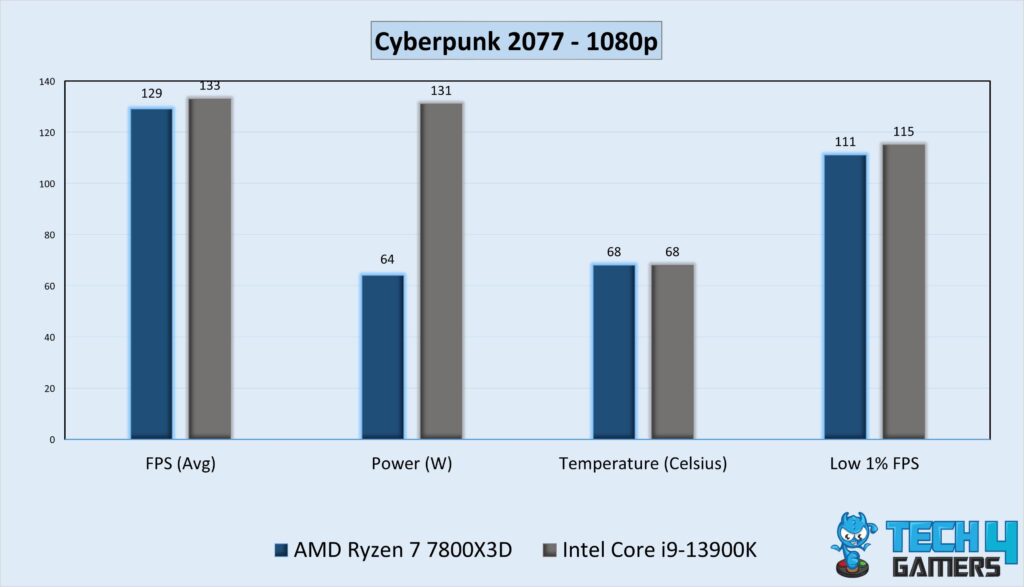
- In Cyberpunk 2077, the Core i9-13900K outperformed the Ryzen 7 7800X3D by 4 FPS or 3.1% by averaging 133 FPS.
- Regarding low 1% performance, the Ryzen 7 7800X3D’s delivered a frame rate of 129 FPS, while the Core i9-13900K delivered 133 FPS.
Forza Horizon 5
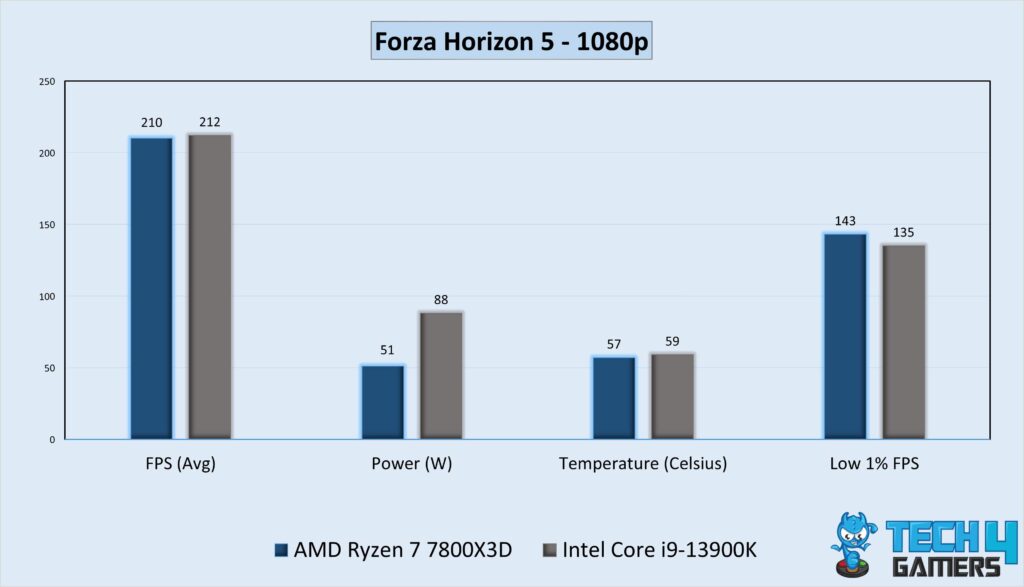
- The Core i9-13900K provided 212 FPS and outscored the Ryzen 7 7800X3D by 2 FPS or 1.0% greater performance in Forza Horizon 5.
- In this game, the Core i9-13900K produced a low 1% frame rate of 135 FPS, whereas the Ryzen 7 7800X3D produced 143 FPS.
Hitman 3
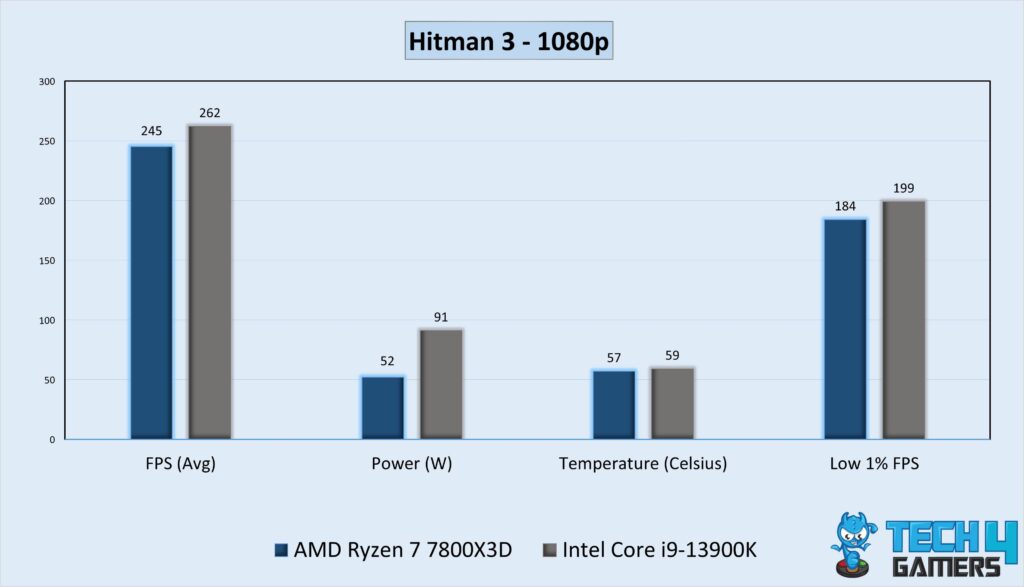
- In our Hitman 3 session, the Core i9-13900K provided 262 FPS and defeated the Ryzen 7 7800X3D by 17 FPS, or 6.9% better performance.
- The Core i9-13900K achieved a low 1% frame rate of 199 FPS, whereas the Ryzen 7 7800X3D achieved 184 FPS.
Hogwarts Legacy
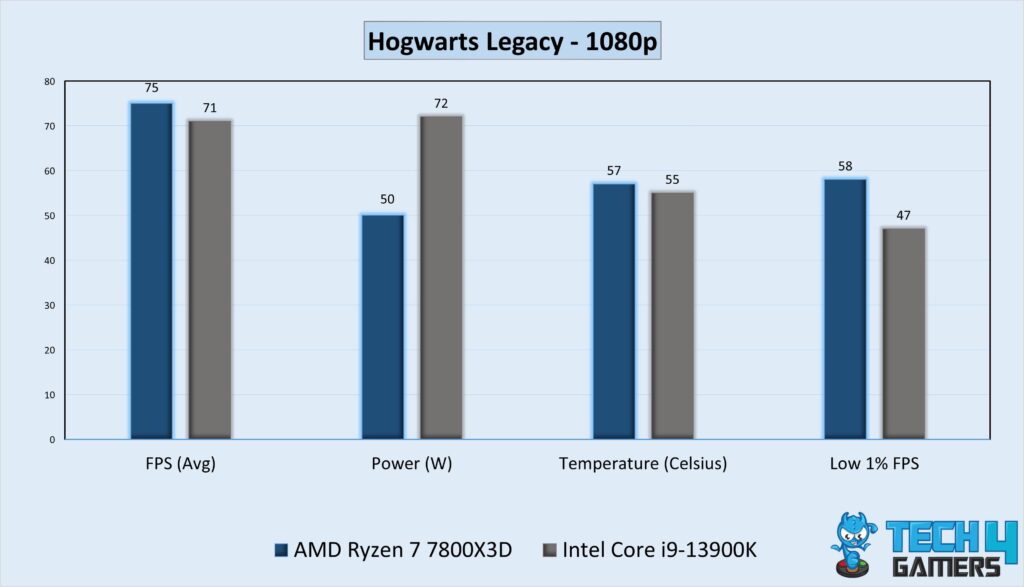
- During Hogwarts Legacy, we noticed that the performance of the Ryzen 7 7800X3D was 4 FPS or 5.6% better than the Core i9-13900K.
- While the Ryzen 7 7800X3D only managed 58 FPS at the low 1%, the Core i9-13900K could only make up a frame rate of 47 FPS.
Horizon Zero Dawn
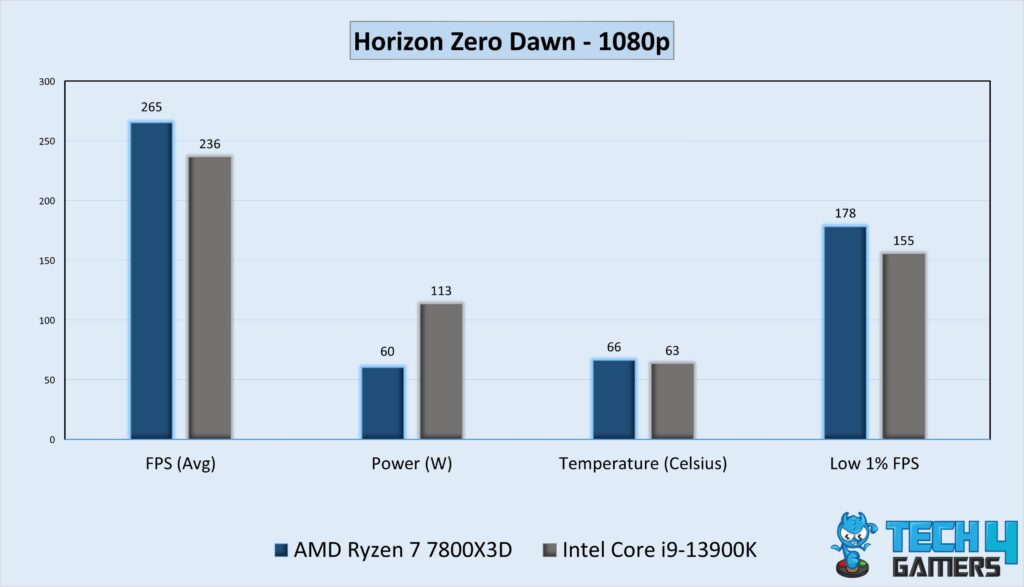
- When we played Horizon Zero Dawn, the Ryzen 7 7800X3D produced 265 FPS and outperformed the Core i9-13900K by 29 FPS or 12.3%.
- The Core i9-13900K could only achieve a low 1% frame rate of 155 FPS, while the Ryzen 7 7800X3D made a brilliant delivery of 178 FPS.
Microsoft Flight Simulator
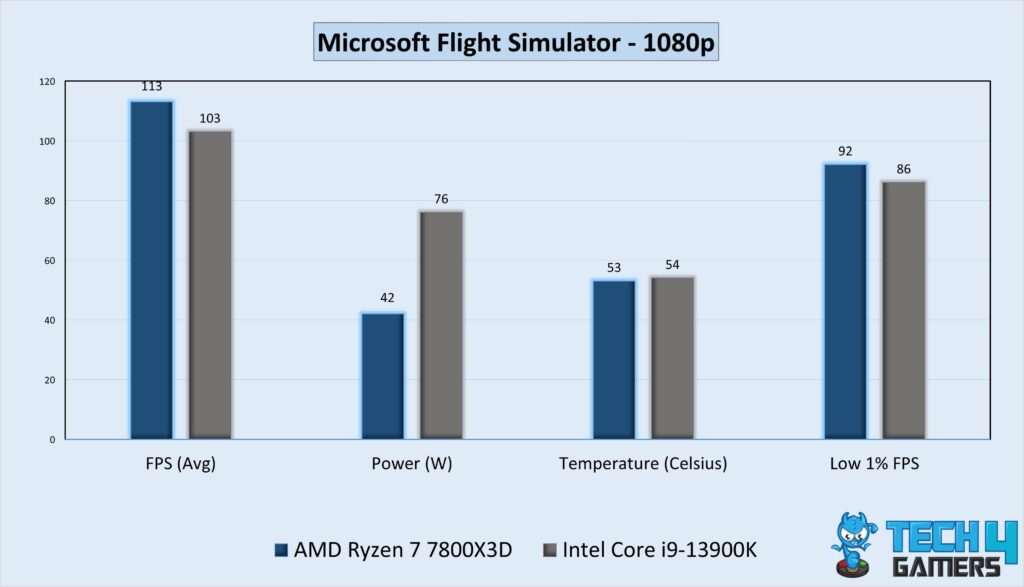
- In our Microsoft Flight Simulator session, the Ryzen 7 7800X3D achieved a performance lead of 10 FPS or 9.7% over the Core i9-13900K by supplying 113 FPS on average.
- The Ryzen 7 7800X3D delivered a fantastic 92 FPS low 1% frame rate, whereas the Core i9-13900K could only manage an average of 86 FPS.
Returnal
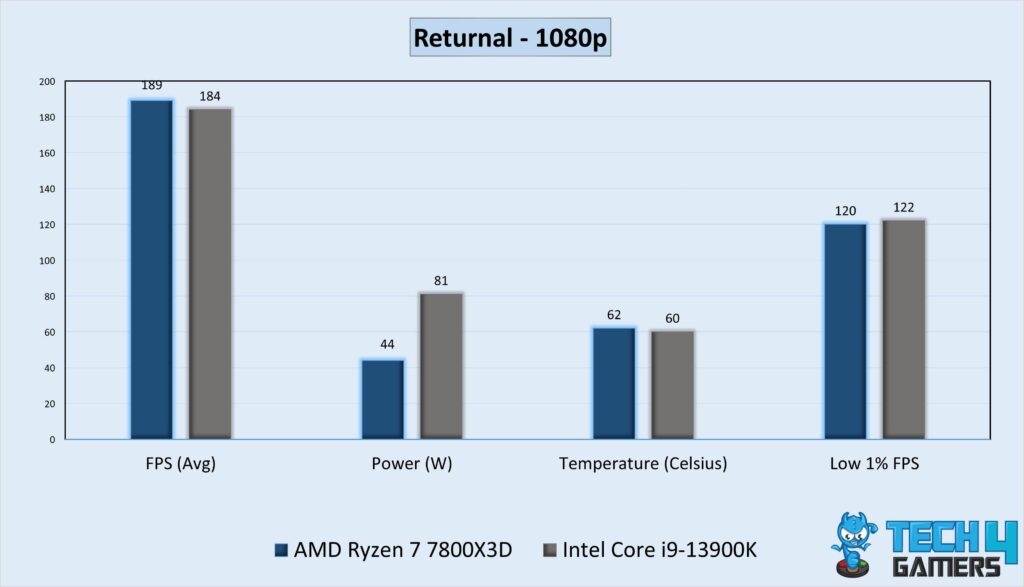
- The Ryzen 7 7800X3D delivered 189 FPS on average and outperformed the Core i9-13900K by 5 FPS or 2.7% during Returnal.
- During the low 1% performance time of this gameplay, the Core i9-13900K generated 122 FPS, while the Ryzen 7 7800X3D produced 120 FPS.
Spider-Man: Miles Morales
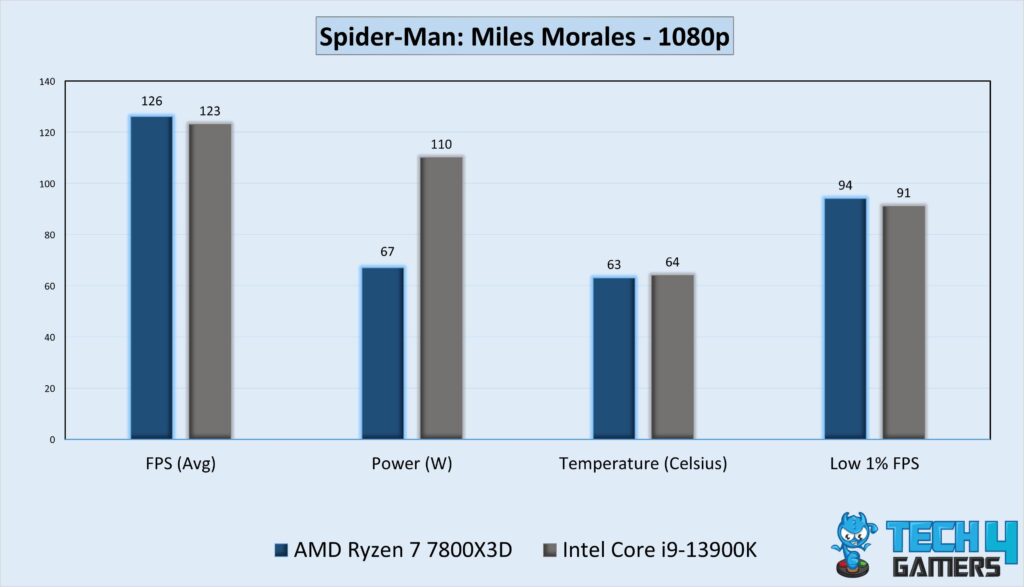
- In our last Spider-Man: Miles Morales session, the Ryzen 7 7800X3D defeated the Core i9-13900K by averaging 126 FPS, which is 2.4% greater performance.
- The Core i9-13900K garned a low 1% frame rate of 123 FPS, while the Ryzen 7 7800X3D turned 126 FPS on average.
Overall Gaming Performance
Stats Intel Core i9-13900K AMD Ryzen 7 7800X3D
Average FPS 239.1 📈 222.6 📉
Low 1% FPS 132.8 📈 130.1 📉
Winner: Intel Core i9-13900K
In terms of the overall frame rate we measured for the above-mentioned games at 1080p resolution, Intel Core i9-13900K conquers the gaming performance with an advantage of 7.4% more profitable over the Ryzen 7 7800X3D. If we figure out the 1% low performance of the two processors, the Core i9-13900K again leads the competition by about 2.1%.
Power Efficiency
Stats Intel Core i9-13900K AMD Ryzen 7 7800X3D
Average Power Draw (W) 92.7 ⚡ 52.0 ⚡
Winner: AMD Ryzen 7 7800X3D
Based on our testing of CPU power usage, the Ryzen 7 7800X3D is about 78.3% more power efficient than the Core i9-13900K. When comparing performance against power consumption, the Ryzen 7 7800X3D also demonstrates higher performance per watt.
Thermal Efficiency
Stats Intel Core i9-13900K AMD Ryzen 7 7800X3D
Average Gaming Temperaure(°C) 59.7 🌡️ 59.4 🌡️
Winner: AMD Ryzen 7 7800X3D
When it comes to thermal efficiency, there is no discernible difference between the thermal efficiencies of the two processors. As the Ryzen 7 7800X3D and the Core i9-13900K had almost the same average gaming temperature.
Price And Availability
| GPU | Launch MSRP | Current Price |
|---|---|---|
| AMD Ryzen 7 7800X3D | 💲449 | 💲383 |
| Intel Core i9-13900K | 💲599 | 💲549 |
| Price Difference | 33.3% | 43.9% |
The Core i9-13900K was initially much more expensive and hasn’t dropped much in price. In contrast, the Ryzen 7 7800X3D is around 43.9% cheaper and performs very good. This makes the Ryzen 7 7800X3D a better value in terms of performance, efficiency, and cost.
Final Verdict: What Do We Recommend?
Intel Core i9-13900K: The Core i9-13900K is the top-tier CPU from Intel’s 13th gen with great gaming and content creation performance. Its multitude of cores and threads, impressive turbo clock enable it to deliver peak performance.
AMD Ryzen 7 7800X3D: The Ryzen 7 7800X3D stands out as AMD’s latest gaming processor with 3D-V cache, offering exceptional efficiency and high performance. It delivers impressive gaming performance and maintains operational efficiency, all at a favorable price point.
If you’re looking to maximize a processor’s performance, the Core i9-13900K is a solid choice. However, for budget-conscious gamers, the Ryzen 7 7800X3D offers even better value with its lower price and running costs.
No, AMD Ryzen 7 7800X3D offers 8 cores and 16 threads. The Ryzen 7 7800X3D has a maximum boost frequency of up to 5.0 GHz, while the Core i9-13900K has a turbo boost frequency of 5.80 GHz. The gaming performance of the Ryzen 7 7800X3D is outstanding, but it does not beat the gaming skills of the Intel Core i9-13900K.Common Questions Answered
More From Core i9-13900K:
More From Ryzen 7 7800X3D:
- Core i5-14600k Vs Ryzen 7 7800X3D
- Core i7-14700K Vs Ryzen 7 7800X3D
- Ryzen 5 5600X3D Vs Ryzen 7 7800X3D
Thank you! Please share your positive feedback. 🔋
How could we improve this post? Please Help us. 😔
[Comparisons Specialist]
I’m a passionate computer hardware expert specializing in CPUs and GPUs. With a lifelong curiosity for hardware and extensive hands-on experience, I provide valuable insights, practical advice, and in-depth analysis on these components. Engaging with the hardware community, I exchange knowledge and stay at the forefront of technological advancements.
Get In Touch: uzair@tech4gamers.com