 Threads

The core i9-13900K is the top variant of Intel’s 13th generation, the Intel Raptor Lake. In contrast, the Ryzen 9 7900x is a processor of the AMD Ryzen 7000 series. Both CPUs brag top-tier specifications, ranking them among the market’s leading processors. Today, we’ll compare the Core i9-13900K vs Ryzen 9 7900X to determine which is the superior processor.
Key Takeaways
- Based on my testing, the Core i9-13900K outperforms the Ryzen 9 7900X by about 3.6% in gaming performance at 4K resolution.
- My findings show that the Ryzen 9 7900X is roughly 4.6% more thermally efficient and 22.7% more energy efficient than the Core i9-13900K.
- About the current CPU prices, the Core i9-13900K is available for $549, while the Ryzen 9 7900X costs $389.
Comparison Table
| Feature | Intel core i9-13900k | AMD Ryzen 9 7900X |
|---|---|---|
| Cores | Total: 24 (8 P-cores + 16 E-cores) | 12 |
| Threads | 32 | 24 |
| Base Clock | P-core base: 3.0 GHz E-core base: 2.2 GHz | 4.7 GHz |
| Turbo Clock | P-core turbo: 5.4 GHz E-core turbo: 4.3 GHz CPU Turbo: Up to 5.8 GHz | Up to 5.6 GHz |
| Memory Type & Frequency | DDR5: Up to 5600 MT/s DDR4: Up to 3200 MT/s | DDR5: Up to 5200 MT/s |
| TDP | 125-253 watts | 170 watts |
| Max Temperature | 100 °C | 95 °C |
| Integrated Graphics | Intel® UHD Graphics 770 | AMD Radeon 2 |
| Graphics Turbo Clock | Up to 1650 MHz | Up to 2200 MHz |
| Price | $589 | $549 |
| Best Motherboards | Best Motherboards For Core i9-13900K | Best Motherboards For Ryzen 9 7900X |
| Best RAM | Best RAM For Core i9-13900K | Best RAM For Ryzen 9 7900X |
| Best CPU Coolers | Best Coolers For Core i9-13900K | Best Coolers For Ryzen 9 7900X |
| Best GPU | Best GPUs For Core i9-13900K | - |
Architectural Difference
- Architecture: The Core i9-13900K has Intel’s hybrid architecture, the Raptor Lake, while the Ryzen 9 7900X features AMD’s Zen 4 architecture.
- Process Node: AMD uses TSMC’s 5nm FinFET technology to fabricate the Ryzen 9 7900X cores. In contrast, the Core i9-13900K is manufactured at Intel’s 10nm node.
- CPU Socket: The Ryzen 9 7900X features an advanced AM5 socket, also known as LGA1718, because it is AMD’s first LGA socket with a pin count of 1718 pins. Contrarily, Intel offers an FCLGA1700 socket with the Core i9-13900K.
- Clock Speed: In terms of CPU clock, the Ryzen 9 7900X features a 56.7% faster base clock than the Core i9-13900K. However, the Core i9-13900K surpasses the Ryzen 9 7900X by 3.6% in boost clock. Moreover, both the processors are also unlocked for overclocking.
- CPU Memory: Coming to CPU memory, the Ryzen 9 7900X does not support DDR4, while the Core i9-13900K does. The Core i9-13900K has a memory bandwidth of 89.6 GB/s and the Ryzen 9 7900X has 54.0 GB/s.
- Integrated Graphics: Both processors feature dual-core iGPUs, with the Ryzen 9 7900X’s AMD Radeon 2 Graphics boasting a 33.3% higher clock speed.
Gaming Benchmarks – 4K
I tested the gaming capabilities of the Core i9-13900K vs Ryzen 9 7900X by playing seven demanding games at 4K resolution, with ultra and high settings for optimal performance evaluation.
Test PC Specs
The system I used to check the performance of two CPUs had the following specifications.
- OS – Windows 11
- CPU Cooler – Cooler Master MasterLiquid Lite ML240L RGB
- SSD – XPG Gammix S70 Blade 2TB NVMe
- Power Supply – ENERMAX REVOLUTION D.F. X 1050W
- GPU – GIGABYTE RTX 3070 VISION OC
Assassin’s Creed Valhalla
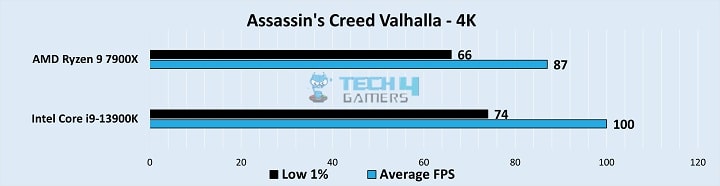
- During my gameplay of Assassin’s Creed Valhalla, the Core i9-13900K delivered a superb 100 FPS on average at 4K, while under the same conditions, the Ryzen 9 7900X produced only 87 FPS.
- When I observed the low 1% frame rate, the Core i9-13900K again led with its 74 FPS during the gameplay. Meanwhile, the Ryzen 9 7900X provided only 66 FPS.
Cyberpunk 2077
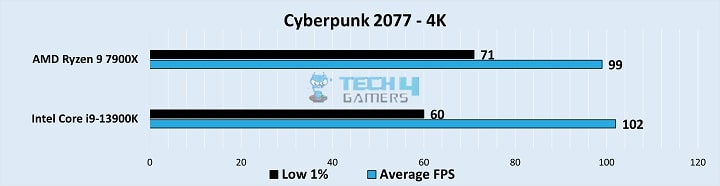
- During Cyberpunk 2077, I experienced the Core i9-13900K outperforming the Ryzen 9 7900X with an average frame rate of 102 FPS compared to 99 FPS, leading by 3.0%.
- Considering the low 1% performance scenario, the Ryzen 9 7900X led by providing 71 FPS, while the Core i9-13900K could only muster up 60 FPS.
God Of War
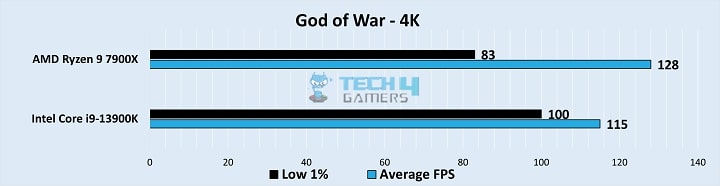
- In my testing of God of War, the Ryzen 9 7900X outperformed the Core i9-13900K’s 115 FPS by delivering an average of 128 FPS, surpassing the latter by 11.3% or 13 FPS.
- Regarding the low 1% performance metrics, the Ryzen 9 7900X provided only 83 FPS, whereas the Core i9-13900K turned over 100 FPS at its low 1%.
Horizon Zero Dawn
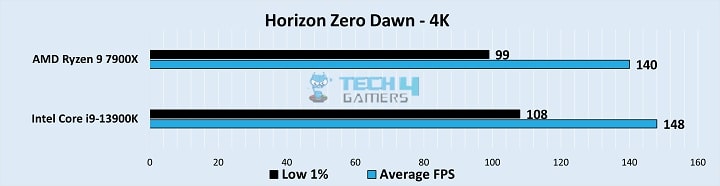
- When I played Horizon Zero Dawn at 4K, the Core i9-13900K outperformed with an average of 148 FPS, surpassing the Ryzen 9 7900X by 5.7%, which achieved 140 FPS.
- I experienced the Core i9-13900K providing 108 FPS at the low 1% performance, surpassing the Ryzen 9 7900X, which provided 99 FPS.
Red Dead Redemption 2
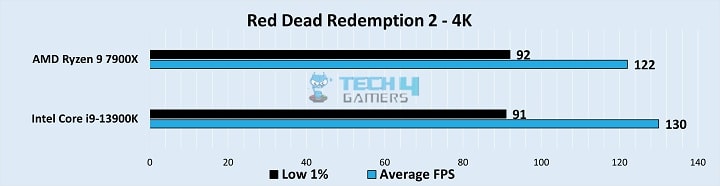
- When I tested the performance of two CPUs in Red Dead Redemption 2, the Core i9-13900K was leading the Ryzen 9 7900X by 6.5%, delivering 130 FPS on average.
- In my testing, the Core i9-13900K achieved 91 FPS at 1% performance, whereas the Ryzen 9 7900X provided 92 FPS.
Watch Dogs Legion
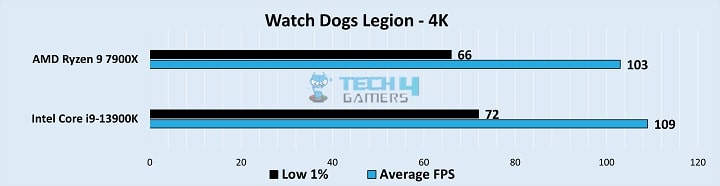
- During my Watch Dogs Legion’s gameplay, I experienced the Core i9-13900K delivering an average of 109 FPS, 5.8% better than the Ryzen 9 7900X’s average of 103 FPS.
- I observed the Core i9-13900K delivering 72 FPS at the low 1% performance, outperforming the Ryzen 9 7900X, which supplied only 66 FPS at low 1%.
Overall Gaming Performance
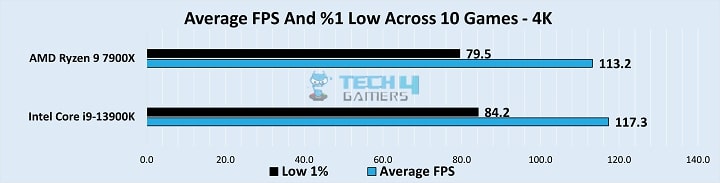
Upon examination of the benchmark data, I discovered that the Core i9-13900K emerged victorious in the battle of gaming performance, with an average of 117.3 FPS, defeating the Ryzen 9 7900X’s average of 113.2 FPS. The Core i9-13900K was victorious in all other games, but the Ryzen 9 7900X was limited to outperforming it in God of War. So, the Core i9-13900K offers around 3.6% more satisfactory gaming performance at 4K than the Ryzen 9 7900X.
When comparing the low 1% performance numerals, the Ryzen 9 7900X averaged 79.5 FPS, whereas the Core i9-13900K averaged 84.2 FPS. In light of this, the Core i9-13900K outperforms the Ryzen 9 7900X by 5.9% under worst 1% performance scenarios.
Gaming Power Consumption
| Game | Intel Core i9-13900K (W) | AMD Ryzen 9 7900X (W) |
|---|---|---|
| Assassin's Creed Valhalla | 120 | 95 |
| Cyberpunk 2077 | 145 | 121 |
| God of War | 152 | 120 |
| Horizon Zero Dawn | 123 | 103 |
| Red Dead Redemption 2 | 122 | 104 |
| Watch Dogs Legion | 155 | 123 |
| Average Power Draw | 136.2 | 111 |
During my gaming sessions, the Core i9-13900K had an average power draw of 136.2 watts, while the Ryzen 9 7900X averaged 111.0 watts. Computing the performance-to-power ratio reveals that the Ryzen 9 7900X achieved 1.02 frames per watt, surpassing the Core i9-13900K’s 0.86 frames per watt. This translates to a 22.7% power efficiency advantage for the Ryzen 9 7900X, significantly reducing electricity costs.
Gaming Temperatures
| Game | Intel Core i9-13900K (°C) | AMD Ryzen 9 7900X (°C) |
|---|---|---|
| Assassin's Creed Valhalla | 57 | 61 |
| Cyberpunk 2077 | 63 | 60 |
| God of War | 60 | 56 |
| Horizon Zero Dawn | 71 | 67 |
| Red Dead Redemption 2 | 59 | 57 |
| Watch Dogs Legion | 60 | 53 |
| Average Temperature | 61.7 | 59 |
During my testing, the Core i9-13900K averaged a gaming temperature of 61.7°C, while the Ryzen 9 7900X maintained a cooler average of 59.0°C. This indicates a 4.6% superior thermal efficiency for the Ryzen 9 7900X over the Core i9-13900K.
Price And Availability
Now, let’s talk about each CPU’s price and availability. While Intel released the Core i9-13900K, with an initial price of $589, AMD presented the Ryzen 9 7900X at a price point of $549.
Regarding the current market price, the Core i9-13900K is presently available for $549. If you require the Ryzen 9 7900X, it is also more affordable at $389.
When speaking of performance per dollar, the Ryzen 9 7900X delivers approximately 36% better FPS-to-cost ratio than the Core i9-13900K. The Ryzen 9 7900X produced about 0.291 FPS per dollar, whereas the Core i9-13900K provided 0.214 FPS per dollar.
Regarding availability, both processors are readily available through official Intel and AMD stores and popular internet merchants like Amazon and Newegg.
Which One Would I Recommend?
With my suggestion, Let me conclude the comparison of the Core i9-13900K vs Ryzen 9 7900X.
I heartily recommend the Core i9-13900K for its superior gaming performance and adeptness in content creation. During my gaming performance evaluation at 4K resolution, the Core i9-13900K provided about 3.6% better performance.
However, I suggest the AMD Ryzen 9 7900X if you want a gaming processor with strong power efficiency. In comparison to the Core i9-13900K, the Ryzen 9 7900X has a 22.7% higher energy efficiency and provides more performance per watt.
Pros And Cons
| Intel Core i9-13900K | AMD Ryzen 9 7900X | ||
|---|---|---|---|
| Pros | Cons | Pros | Cons |
| Excellent Gaming Performance | High Power Consumption | Powerful Integrated Graphics | DDR5 Not Supported |
| High Cores and Threads count | High Price | Power Efficient CPU | No Stock Cooler in box |
Related Comparisons
Thank you! Please share your positive feedback. 🔋
How could we improve this post? Please Help us. 😔
[Comparisons Expert]
Abdemanaf is a skilled creative writer who has been honing his craft since 2011. While initially working in different fields, he found a passion for technology and has been exploring the tech world since early 2015. Over the years, he has developed an in-depth knowledge of the latest tech trends and product offerings by various companies.
Abdemanaf’s writing reflects his analytical mindset and ability to think critically. He has a knack for breaking down complex technical information into easily digestible pieces, making his articles engaging and accessible to readers from all backgrounds. In February 2022, he joined Tech4Gamers as a blog and product comparison writer, where he has been able to hone his skills further.
As a writer, Abdemanaf is dedicated to staying up-to-date with the latest technological advancements and trends, enabling him to provide readers with the most relevant and accurate information. He is always eager to learn more and is constantly seeking new challenges to improve his skills.
Get In Touch: manaf@tech4gamers.com


