 Threads
We’ve been eagerly awaiting the latest showdown in the CPU arena, and it’s finally here! In this comparison article, We’ll be pitting the new Core i7-14700K vs Ryzen 7 7800X3D. With the Core i7-14700K being the newest release, it’s high time we explore the capabilities.
Key Takeaways
- Our benchmarking suggests the Ryzen 7 7800X3D is the preferred choice for gamers, edging out the Core i7-14700K by 1.4% in average FPS, offering a slight gaming advantage.
- Moreover, for users prioritizing power efficiency, our results clearly favour the Ryzen 7 7800X3D, with a remarkable 42.8% lower power consumption compared to the Core i7-14700K at 1080p resolution.
- In terms of thermal performance, the Core i7-14700K maintains a 17.6% cooler temperature during 1080p gaming, appealing to users who value cooler operations.
- While the Ryzen 7 7800X3D comes at a slightly higher price point, reflecting a 9.3% cost increase over the Core i7-14700K, its gaming and power efficiency benefits may justify the investment for an enhanced gaming experience.
Comparison Table
| Feature | Core i7-14700K | Ryzen 7 7800X3D |
|---|---|---|
| Architecture | Core i7 | Zen 4 |
| Codename | Raptor Lake-R | Raphael |
| CPU Socket | Intel Socket 1700 | AMD Socket AM5 |
| Unlocked for Overclocking | Yes | No |
| L1 Cache | 80K (per core) | 64K (per core) |
| L2 Cache | 2MB (per core) | 1MB (per core) |
| L3 Cache | 33MB (shared) | 96MB (shared) |
| PCIe Express Version | Gen 5 | Gen 5 |
| Memory Type & Speed | DDR4, Up to 3200 MHz | DDR5, Up to 5600 MHz |
| Release Date | Oct 17th, 2023 | Jan 4th, 2023 |
| MSRP | 409 USD | 449 USD |
| Best Motherboard | Best Motherboards For i7-14700K | Best Motherboard For Ryzen 7 7800X3D |
| Best Cooler | Best CPU Cooler For i7-14700K | BEST CPU Coolers For Ryzen 7 7800X3D |
| Best GPU | BEST GPU For Core i7-14700K | Best GPU For Ryzen 7 7800X3D |
Architectural Difference
- Process Node: The Core i7-14700K is built on a 10nm Intel process node, providing a modern and power-efficient architecture. In contrast, the Ryzen 7 7800X3D utilizes a 5nm TSMC process node, which has further enhanced technology.
- Frequency: The Core i7-14700K boasts a 3.4 GHz Base frequency, which can turbocharge up to an impressive 5.6 GHz. Meanwhile, the Ryzen 7 7800X3D starts with a 4.2 GHz Base Frequency and can reach up to 5 GHz with its Turbo Clock.
- TDP: The Core i7-14700K carries a 125W TDP, reflecting its power consumption and heat generation under load. In comparison, the Ryzen 7 7800X3D is slightly more power-efficient, with a 120W TDP.
- Cores & Threads: The Core i7-14700K flexes its muscle with an impressive 20 Cores (P-Cores: 8 & E-Cores: 12) and 28 Threads. On the other hand, the Ryzen 7 7800X3D offers 8 cores and 16 Threads.
- Supported Technologies: The Core i7-14700K features UHD Graphics 770, which is Intel’s integrated graphics solution, suitable for light gaming. In contrast, the Ryzen 7 7800X3D comes equipped with Radeon Graphics.
Gaming Benchmarks
Now that we have covered all the specifications and architectural differences of these CPUs let us now focus on how they perform under rigorous gaming benchmarks. We will be putting these chips through 10 different games at 1080p. Let’s get started:
Test Bench
Here are the specs of our testing bench for this examination:
- CPU: Core i7-14700K, Ryzen 7 7800X3D
- CPU Cooler: MSI MAG CORELIQUID C360
- Motherboard: Asus ROG Strix Z790-E Gaming, MSI MPG X670E CARBON
- RAM: XPG Lancer RGB 32GB 7200MT/s DDR5 Ram
- GPU: GeForce RTX 4090 24GB
- Storage: Sabrent Rocket 4 Plus G 2TB
- Operating System: Windows 11
- Power Supply: ENERMAX REVOLUTION D.F. X 1050W
Learn: How To Benchmark Your Gaming PC
Assassin’s Creed Mirage
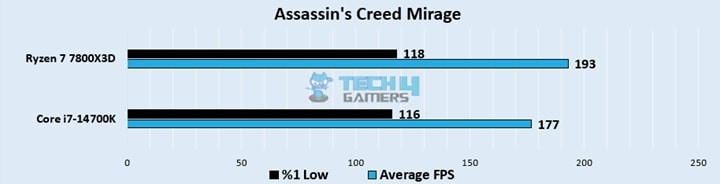
- In our performance tests, the Core i7-14700K delivered an average FPS of 177, while the Ryzen 7 7800X3D outshone it with 193 FPS. This results in a notable 8.6% advantage for the AMD processor.
- When examining the 1% lows, the Core i7-14700K displayed a result of 116 FPS, whereas the Ryzen 7 7800X3D performed slightly better with 118 FPS. This marginal 1.7% suggests both processors offer consistent gaming experiences.
Hogwarts Legacy
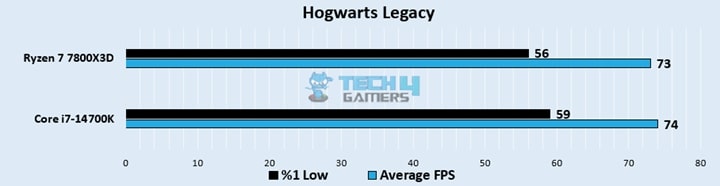
- We observed the Core i7-14700K achieving an average FPS of 74, whereas the Ryzen 7 7800X3D maintained a slightly better performance with 73 FPS. The difference here is just 1.3%, showing that both CPUs offer competitive gaming experiences.
- In our testing, the Core i7-14700K achieved 1% lows of 59 FPS, while the Ryzen 7 7800X3D showcased a more resilient performance at 56 FPS. The 5.2% in favour of AMD implies that Ryzen handles gaming dips more effectively in Hogwarts Legacy.
Red Dead Redemption 2
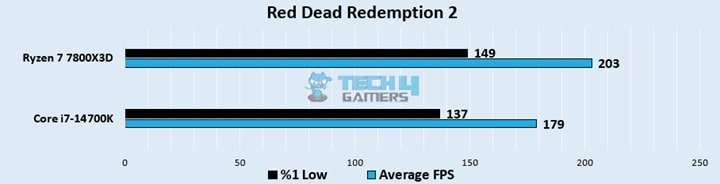
- Testing the waters with RDR2 gameplay, the Core i7-14700K averaged 179 FPS, while the Ryzen 7 7800X3D stormed ahead with an impressive 203 FPS. This substantial 12.5% difference signifies AMD’s gaming prowess.
- Exploring 1% lows, the Core i7-14700K maintained a score of 137 FPS, while the Ryzen 7 7800X3D surged ahead with 149 FPS. This noteworthy 8.3% underlines AMD’s strength in providing a more stable gaming experience.
Cyberpunk 2077
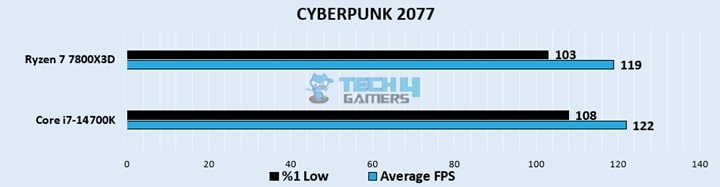
- Again, we noticed the Core i7-14700K provided a solid average of 122 FPS, closely trailing the Ryzen 7 7800X3D, which managed 119 FPS. Here, the difference is a modest 2.4%.
- The Core i7-14700K demonstrated 1% lows at 108 FPS, whereas the Ryzen 7 7800X3D delivered a slightly better result of 103 FPS. With a 4.7% between both the processors.
Hitman 3
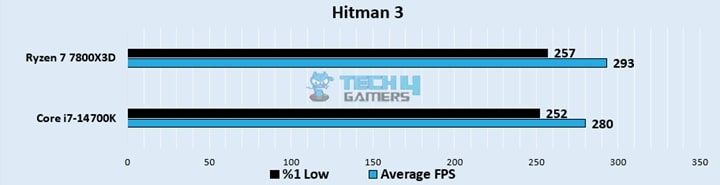
- As we were testing Hitman 3, the Core i7-14700K excelled with 280 average FPS, and the Ryzen 7 7800X3D maintained a strong lead with 293 FPS. This translates to a 4.5% difference, suggesting AMD’s advantage.
- Assessing 1% lows, the Core i7-14700K recorded 252 FPS, and the Ryzen 7 7800X3D closely followed with 257 FPS. This slight 1.9% suggests that both CPUs offer a similar level of performance.
Microsoft Flight Simulator

- In our gaming benchmark, the Core i7-14700K scored an average of 115 FPS, whereas the Ryzen 7 7800X3D surged ahead with 139 FPS. This notable 18.8% difference..
- During our further performance evaluation, the Core i7-14700K provided 1% lows at 85 FPS, while the Ryzen 7 7800X3D demonstrated a more robust 98 FPS. This notable 14.2% highlights AMD’s advantage.
Starfield
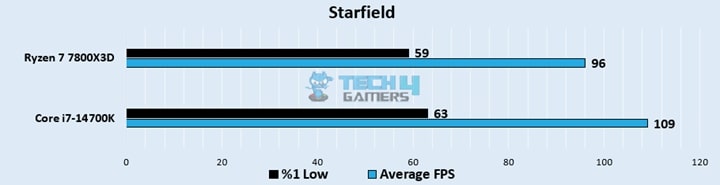
- When we put these processors to test in Starfield, the Core i7-14700K achieved an average FPS of 109, while the Ryzen 7 7800X3D managed 96 FPS. This signifies a 12.6% gap, favouring the Intel processor in this specific gaming scenario.
- The Core i7-14700K delivered 1% lows of 63 FPS, while the Ryzen 7 7800X3D maintained 59 FPS. With a 6.5%, AMD showcases its proficiency in handling gaming dips again.
The Last Of Us Part I
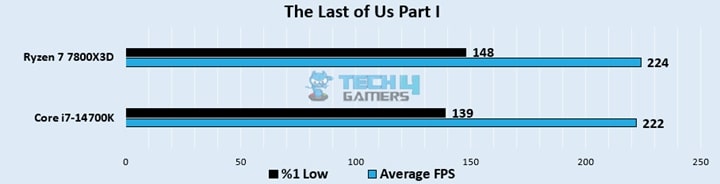
- With our performance review of The Last Of Us Part l, the Core i7-14700K recorded an average of 222 FPS, closely followed by the Ryzen 7 7800X3D at 224 FPS. The difference is a mere 0.8%, indicating similar capabilities.
- In our extensive testing, the Core i7-14700K exhibited 1% lows at 139 FPS, and the Ryzen 7 7800X3D was close behind with 148 FPS. This 6.2% underscores the comparable performance of both processors.
Spider-Man Miles Morales
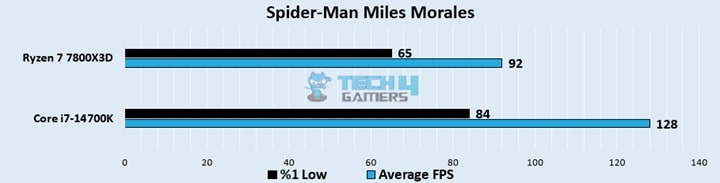
- We observed the Core i7-14700K achieving an average of 128 FPS, but the Ryzen 7 7800X3D fell significantly behind with 92 FPS. This substantial 32.7% difference highlights the Core i7-14700K’s advantage.
- The Core i7-14700K achieved 1% lows of 84 FPS, while the Ryzen 7 7800X3D lagged behind with 65 FPS. This substantial 25.5% indicates that the Core i7-14700K excels in providing smoother gaming experiences.
Forza Horizon 5
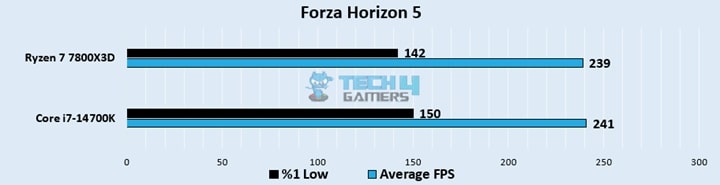
- In our extensive testing, the Core i7-14700K secured an average of 241 FPS, while the Ryzen 7 7800X3D was nipping at its heels with 239 FPS. This minuscule 0.8% difference underscores the nearly identical gaming.
- During our performance evaluation, the Core i7-14700K displayed 1% lows of 150 FPS, while the Ryzen 7 7800X3D achieved 142 FPS. This 5.4% difference suggests that both processors maintain consistent gaming performance.

I really like the Ryzen 7 7800X3D among these processors because not only does it provide better performance by 1.4%, it also excels in power efficiency by a major 42.8%, so it will easily provide you better FPS while saving your money in the long run.
– Shehryar Khan
Overall Gaming Performance
Now that we have checked the performance of these CPUs in each of the games individually let’s check how they performed in general across the 10 titles that we tested today at 1080p. Below are the results based on our assessments.
As per our benchmarking, we saw both the Core i7-14700K and Ryzen 7 7800X3D perform quite well throughout our testing and examinations.
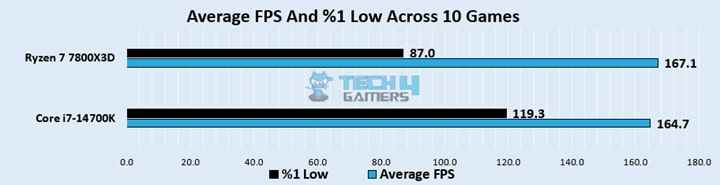
According to our results, we noticed the Core i7-14700K drawing out 164.7 FPS on average. Meanwhile, the Ryzen 7 7800X3D can be seen drawing 167.1 FPS on average, and these results provide a minor 1.4% lead with users running the Ryzen 7 7800X3D.
Contrary to average FPS, we saw a different picture in the %1 lows, as the Core i7-14700K drew an average of 119.3 FPS while its counterpart, Ryzen 7 7800X3D, only managed to draw 87 FPS on average, providing a clear lead of 31.3% in favour of the Core i7-14700K.
Here’s our YouTube video, which demonstrates how we tested each of these games individually on these processors.
Gaming Power Consumption
Next, let’s take a look at the power consumption of the Core i7-14700K Vs Ryzen 7 7800X3D at 1080p gaming:
Note: Keep in mind that both of these CPUs come with different TDP ratings, with the Core i7-14700K boasting a 125W TDP and the Ryzen 7 7800X3D having 120W TDP, leading to a difference of 4%.
| Processors | Core i7-14700K (Watts) | Ryzen 7 7800X3D (Watts) |
|---|---|---|
| Assassin's Creed Mirage | 103 | 72 |
| Hogwarts Legacy | 77 | 56 |
| Red Dead Redemption 2 | 110 | 68 |
| Cyberpunk 2077 | 129 | 77 |
| Hitman 3 | 92 | 68 |
| Microsoft Flight Simulator | 77 | 60 |
| Starfield | 126 | 75 |
| The Last of Us Part I | 134 | 82 |
| Spider-Man Miles Morales | 124 | 64 |
| Forza Horizon 5 | 90 | 65 |
Based on our assessments and results, in terms of power consumption, the Core i7-14700K generally consumes more watts than the Ryzen 7 7800X3D across a range of games.
When discussing averages, we saw the Core i7-14700K drawing 106.2W on average. Meanwhile, the Ryzen 7 7800X3D shows a usage of 68.7W on average. This leads to a primary difference of 42.8% among the two competitors when it comes to power efficiency.
Similar Read: How Much Power Does A Gaming PC Use?
Gaming Temperatures
Now, it’s time to dive into the gaming temperatures of these processors as we undergo our comprehensive testing at 1080p resolution.
| Processors | Core i7-14700K (°C) | Ryzen 7 7800X3D (°C) |
|---|---|---|
| Assassin's Creed Mirage | 55 | 62 |
| Hogwarts Legacy | 47 | 64 |
| Red Dead Redemption 2 | 54 | 58 |
| Cyberpunk 2077 | 60 | 66 |
| Hitman 3 | 53 | 63 |
| Microsoft Flight Simulator | 48 | 60 |
| Starfield | 55 | 63 |
| The Last of Us Part I | 57 | 76 |
| Spider-Man Miles Morales | 58 | 65 |
| Forza Horizon 5 | 49 | 63 |
Examining the thermal performance in our gaming results, the Core i7-14700K exhibited superior heat control at 53.6°C, while the Ryzen 7 7800X3D faced a higher thermal output at 64°C.
This substantial 17.6% difference underscores Intel’s proficiency in maintaining lower temperatures during gaming sessions.
Prices And Availability
Based on our findings, we discovered that the Core i7-14700K boasts an appealing MSRP of 409 USD and is readily available on popular platforms such as Amazon, making it an accessible choice for budget-conscious consumers.
Conversely, the Ryzen 7 7800X3D comes with a slightly lower price tag, hovering around 399 USD, and it can also be conveniently acquired through Amazon. While it offers robust performance, the Ryzen processor does come at a slightly heftier cost compared to its Intel counterpart.
When considering the cost, the Ryzen 7 7800X3D is positioned at a lower price point, reflecting a 2.4% decrease over the Core i7-14700K. This price differential should be weighed against the performance and features each processor offers.
Ryzen 7 7800X3D Vs Core i7-14700K: Which One We Recommend?
Based on our findings, we would recommend the Ryzen 7 7800X3D over the Core i7-14700K for gaming enthusiasts. The Ryzen processor edges out the Intel CPU by 1.4%, drawing an average of 167.1 FPS, providing a slight gaming advantage.
Moreover, if power efficiency is a priority, the Ryzen 7 7800X3D is the clear choice. In our tests, it showcased an average power consumption of 68.7W, a remarkable 42.8% more efficient than the Core i7-14700K, which averaged 106.2W.
But in terms of thermal performance, the Core i7-14700K runs cooler, with a 17.6% lower temperature difference during gaming. This makes it a solid option for users who prioritize cooler operations.
Finally, while the Ryzen 7 7800X3D does come at a slightly lower price point, reflecting a 2.4% decrease over the Core i7-14700K, its gaming and power efficiency advantages may justify the investment for those seeking an optimal gaming experience.
Pros And Cons
| Core i7-14700K | Core i7-14700K | Ryzen 7 7800X3D | Ryzen 7 7800X3D |
|---|---|---|---|
| Pros | Cons | Pros | Cons |
| Outstanding performance | High power consumption | Impressive gaming performance | Lack of support for DDR4 memory |
| Four additional E-cores than before | Prone to overheating | Integration of PCIe 5.0 technology | Absence of an included cooler |
More From Ryzen 7 7800X3D:
Thank you! Please share your positive feedback. 🔋
How could we improve this post? Please Help us. 😔
[Comparisons Expert]
Shehryar Khan, a seasoned PC hardware expert, brings over five years of extensive experience and a deep passion for the world of technology. With a love for building PCs and a genuine enthusiasm for exploring the latest advancements in components, his expertise shines through his work and dedication towards this field. Currently, Shehryar is rocking a custom loop setup for his built.
Get In Touch: shehryar@tech4gamers.com


