Nvidia GeForce RTX 2080 Ti
Rated: 8.5/10
Nvidia GeForce RTX 4060 Ti (16GB)
Rated: 8.3/10
Pros And Cons
| GPU | Pros | Cons |
|---|---|---|
| Nvidia GeForce RTX 4060 Ti | ✅ Low price for 16GB ✅ Better ray tracing and AI technologies | ❌ Low Performance/price ratio for a new-gen GPU |
| Nvidia GeForce RTX 2080 Ti | ✅ Better performance at 1440p ✅ Also good at 4K ✅ DLSS stands out as a key feature. | ❌ Higher power consumption |
- In our gaming performance tests, the RTX 2080 Ti performed 0.6% better at 1080p and 4.5% better at 1440p than the RTX 4060 Ti 16GB.
- The RTX 2080 Ti utilizes roughly 32% additional power and is about 11.3% less thermally efficient than the RTX 4060 Ti 16GB.
- As of February 2024, the RTX 4060 Ti 16GB costs around $429, and a refurbished RTX 2080 Ti costs around $279.
- I suggest the RTX 4060 Ti 16GB for its advanced features and efficient power usage and the RTX 2080 Ti for better performance.
Comparison Table
| Technical Specs | GeForce RTX 4060 Ti | GeForce RTX 2080 Ti |
|---|---|---|
| GPU Name | AD106 | TU102 |
| Architecture | Ada Lovelace | Turing |
| CUDA Cores | 4352 | 4352 |
| Tensor Cores | 136 | 544 |
| RT Cores | 34 | 68 |
| Memory Bus Width | 128 bit | 352 bit |
| Memory Bandwidth | 288.0 GB/s | 616.0 GB/s |
| TDP | 165W | 250W |
| Best Variants | Best RTX 4060 Ti Cards | - |
Architectural Differences
- Process Node: Firstly, the RTX 4060 Ti utilizes a cutting-edge TSMC 5nm process node, contrasting with the RTX 2080 Ti’s TSMC 12nm process, showcasing technological advancements in fabrication.
- Clock Speed: The RTX 4060 Ti boasts a dynamic performance range with a Base Clock of 2310 MHz and a Boost Clock of up to 2535 MHz. In comparison, the RTX 2080 Ti maintains a Base Clock of 1350 MHz and a Boost Clock of up to 1545 MHz.
- VRAM: Additionally, the RTX 4060 Ti equips itself with a generous 16GB of GDDR6 memory, surpassing the RTX 2080 Ti’s 11GB GDDR6 allocation, potentially enhancing its ability to handle memory-intensive tasks.
- TDP: The RTX 4060 Ti demonstrates its power efficiency with a 165W TDP, whereas the RTX 2080 Ti operates with a comparatively higher 250W TDP.
- Supported Technologies: Finally, embracing innovation, the RTX 4060 Ti incorporates DLSS (Deep Learning Super Sampling) technology into its repertoire, a feature also present in the RTX 2080 Ti.
In RTX 4060 Ti 16GB vs RTX 2080 Ti, we’ll explore their architecture, specifications, and their performance in gaming benchmarks. By the end, you will possess a clearer understanding of their comparative merits.
Gaming Benchmarks
In our gaming benchmarks, we will analyze the performance of the RTX 4060 Ti and the RTX 2080 Ti in various games at 1080p and 1440p resolutions, considering FPS, 1% lows, power usage, and gaming temperature.
Testing Rig
- OS: Windows 11 22H2 (Debloated)
- CPU: Intel Core i5-13600K
- Motherboard: MSI Z790 Tomahawk Max WiFi Motherboard
- RAM: Kingston Fury Renegade RGB DDR5 32GB 7200MHz
- SSD: CORSAIR MP700 PRO 2TB Gen5 NVMe SSD
- Power Supply: ENERMAX REVOLUTION D.F. X 1050W
- CPU Cooler: Noctua NH-L9x65 chromax.black CPU Air Cooler
1080p
Star Wars Jedi Survivor
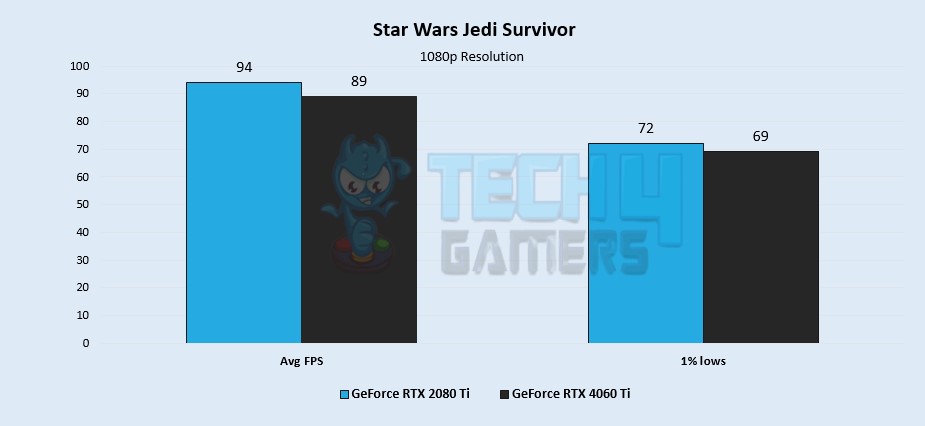
- In our first Star Wars Jedi Survivor gameplay at 1080p, the RTX 4060 Ti delivers an average FPS of 89, while the RTX 2080 Ti achieves 94 FPS, revealing a 5.4% performance difference.
- The RTX 2080 Ti achieves a 1% low of 72 FPS, while the RTX 4060 Ti trails behind at 69 FPS, with a 4.2% fall.
Resident Evil 4 Remake

- During Resident Evil 4, the RTX 4060 Ti achieved an average of 108 FPS, exhibiting a 4.7% advantage in frame rate than the RTX 2080 Ti’s 103 FPS.
- The RTX 4060 Ti achieves a 1% low of 86 FPS, while the RTX 2080 Ti maintains a slight 4.7% advantage with 82 FPS.
The Last Of Us I

- In The Last Of Us Part I, the RTX 4060 Ti leads by 2.5% in average FPS, achieving 81 FPS, compared to the RTX 2080 Ti’s 79 FPS.
- Displaying closely matched 1% lows, both the RTX 2080 Ti and RTX 4060 Ti achieve 67 FPS, highlighting similar performance levels.
Hogwarts Legacy
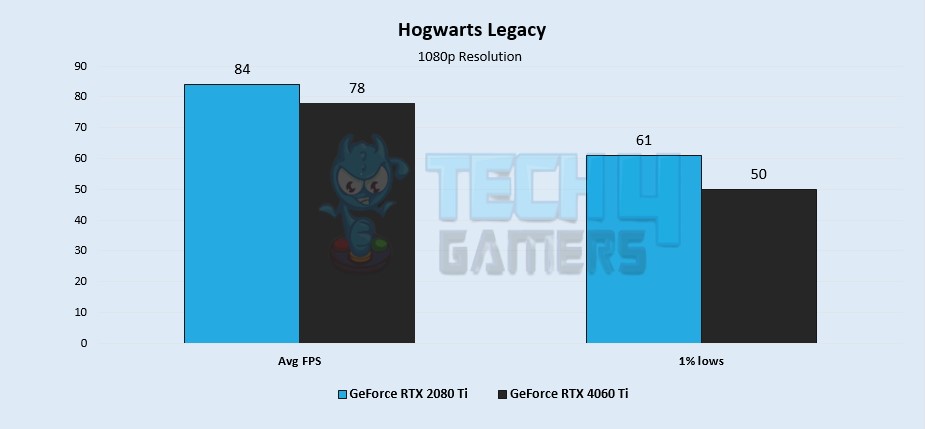
- The RTX 2080 Ti secures a lead of 7.4% in average FPS, achieving 84 FPS, while the RTX 4060 Ti trails slightly behind with 78 FPS.
- Moreover, the RTX 2080 Ti commands an impressive 19.8% lead in 1% lows, achieving 61 FPS, while the RTX 4060 Ti falls behind with 50 FPS.
The Callisto Protocol

- In The Callisto Protocol at 1080p, we saw that the RTX 4060 Ti achieves an average of 127 FPS, only 0.7% ahead of the RTX 2080 Ti’s 126 FPS.
- The RTX 4060 Ti achieves a 1% low of 94 FPS, just 1% higher than the RTX 2080 Ti’s 93 FPS.
1440p
Star Wars Jedi Survivor
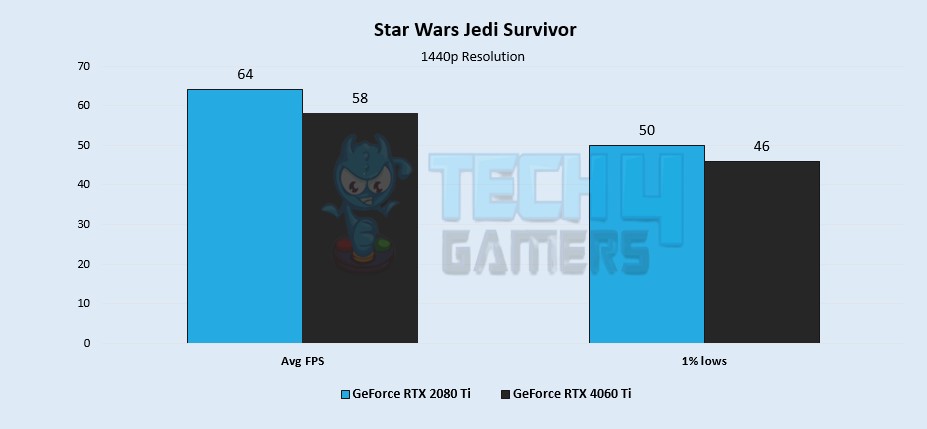
- During Star Wars Jedi Survivor at 1440p, the RTX 4060 Ti delivers an average FPS of 58, while the RTX 2080 Ti achieves 64 FPS, displaying a 9.8% performance gap.
- With an 8.3% lead, the RTX 2080 Ti achieves a 1% low of 50 FPS, surpassing the RTX 4060 Ti’s 46 FPS.
Resident Evil 4 Remake
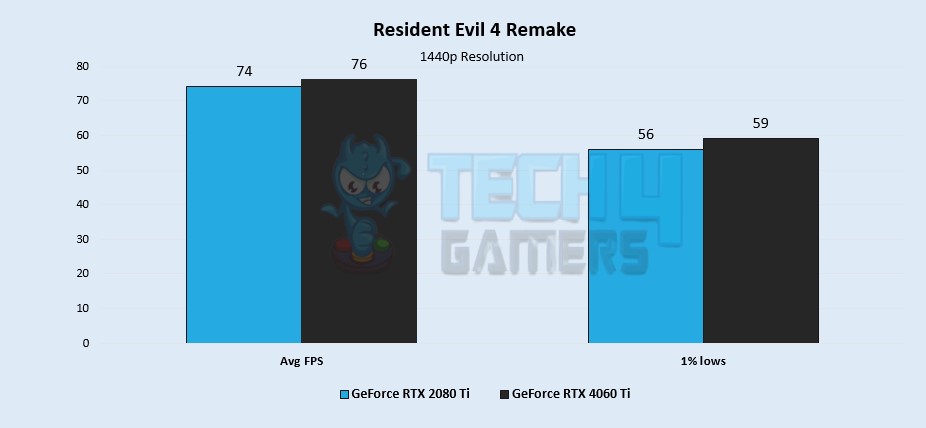
- In our Resident Evil 4 Remake session at 1440p resolution, the RTX 4060 Ti achieves an average FPS of 76 FPS, demonstrating a slight 2.6% advantage over the RTX 2080 Ti’s 74 FPS.
- In the low 1% performance time, the RTX 4060 Ti achieved 59 FPS, while the RTX 2080 Ti maintains a slightly lower 56 FPS.
The Last Of Us I
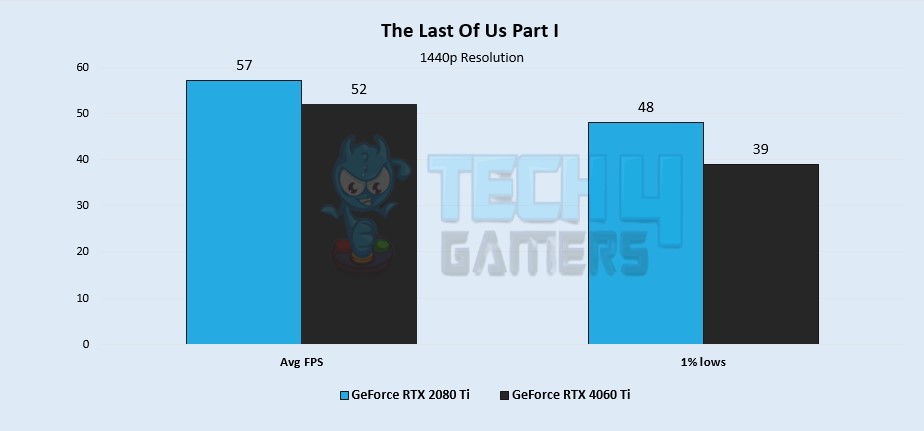
- While playing The Last Of Us Part I at 1440p, we saw that the RTX 2080 Ti secured a lead of 9.1%, achieving 57 FPS, while the RTX 4060 Ti trails behind with 52 FPS.
- In addition, the RTX 4060 Ti trails behind with a 20.6% disadvantage in 1% lows, achieving 39 FPS, while the RTX 2080 Ti commands a higher 48 FPS.
Hogwarts Legacy
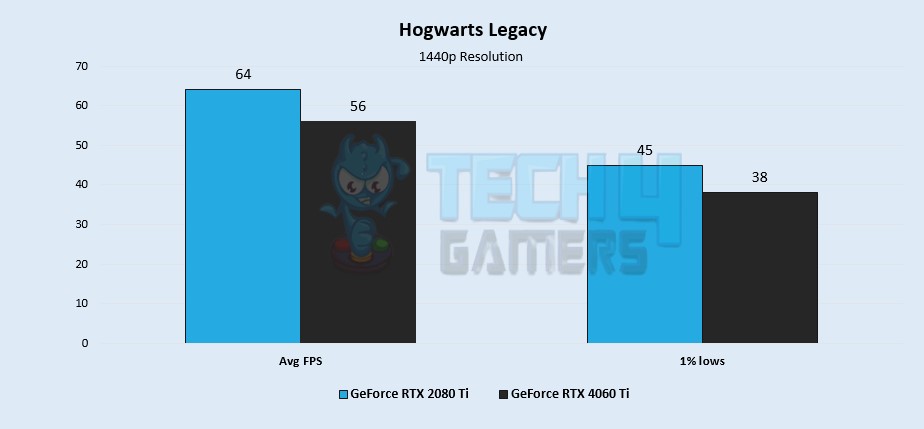
- During Hogwarts Legacy, the RTX 4060 Ti achieved an average of 56 FPS showing a significant 13.3% performance lag, while the RTX 2080 Ti rushes ahead with 64 FPS.
- Moreover, using a significant 16.8% advantage, the RTX 2080 Ti achieves a 1% low of 45 FPS, while the RTX 4060 Ti trails with 38 FPS.
The Callisto Protocol
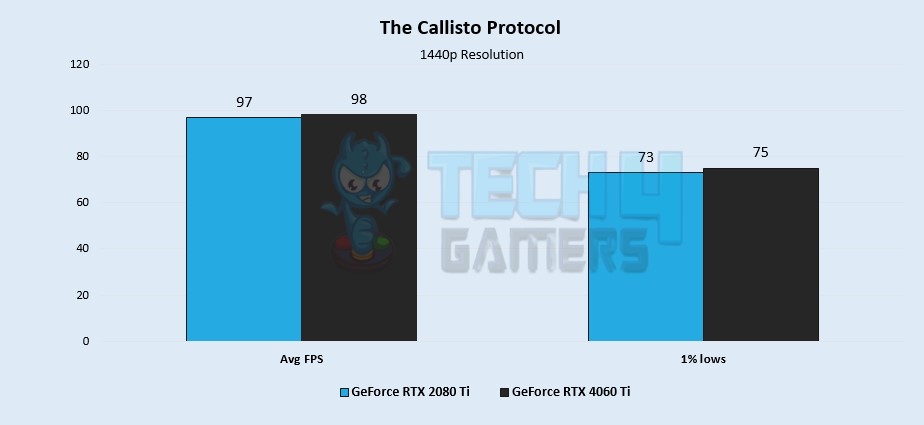
- In our last gameplay of The Callisto Protocol at 1440p, the RTX 4060 Ti achieved an average of 98 FPS, just 1% higher than the RTX 2080 Ti’s 97 FPS.
- Regarding low 1% performance, the RTX 4060 Ti maintains a slight 2.7% lead, achieving a 1% low of 75 FPS, while the RTX 2080 Ti trails at 73 FPS.
Overall Gaming Performance
1080p
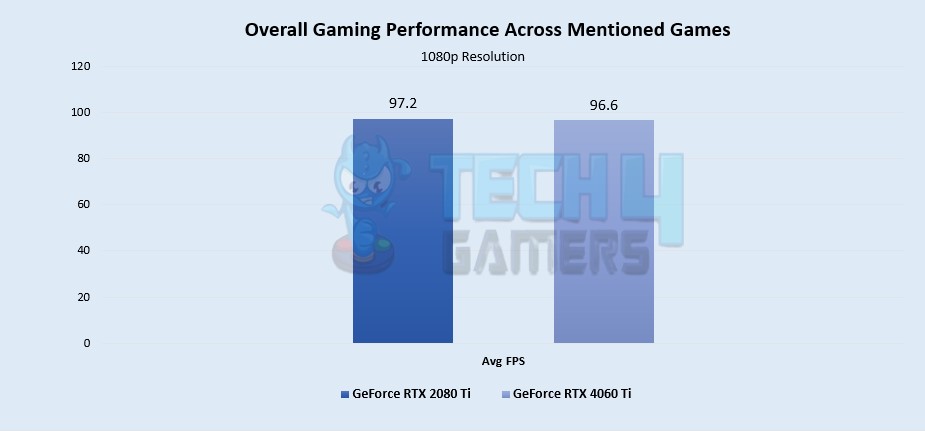
In our gaming tests at 1080p resolution, the RTX 2080 Ti achieves an average of 97.2 FPS, closely followed by the RTX 4060 Ti at 96.6 FPS, demonstrating their comparable performance levels. Despite its slim 0.6% lead, the RTX 2080 Ti emerges as the superior choice, showcasing the closely contested performance between the two GPUs.
1440p
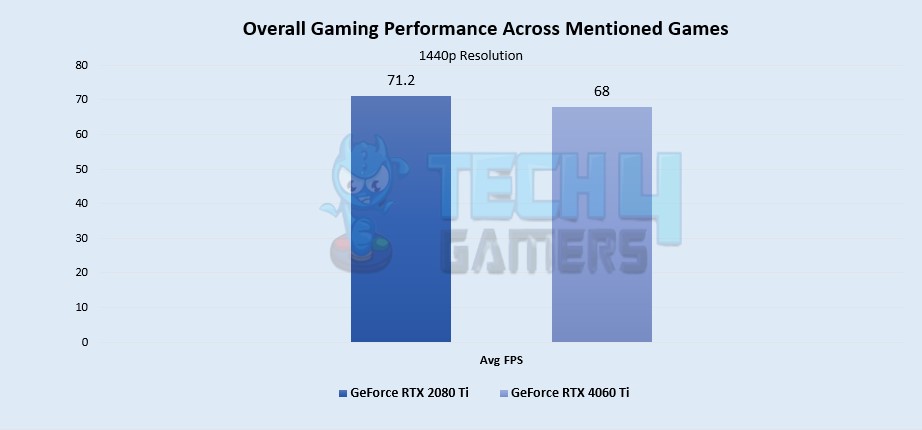
Comparing their performance, the RTX 2080 Ti achieves an average of 71.2 FPS, while the RTX 4060 Ti maintains a stable 68 FPS, showcasing the subtle performance differences between the two graphics cards. With a 4.5% edge in average FPS, the RTX 2080 Ti emerges as the leader over the RTX 4060 Ti.
Winner: GeForce RTX 2080 Ti
Pricing And Availability
| GPU | Launch MSRP | Current Price |
|---|---|---|
| Nvidia GeForce RTX 4060 Ti | 💲499 | 💲429 |
| Nvidia GeForce RTX 2080 Ti | 💲999 | 💲279 (Refurbished) |
| Price Difference | 100% | 53.7% |
Buying a new RTX 2080 Ti in 2024 doesn’t make sense, so here’s the price for a refurbished one, which is about 53.7% cheaper than the RTX 4060 16GB. Regarding availability, the RTX 4060 Ti 16GB and the refurbished RTX 2080 Ti are reading available in markets.
Final Verdict: What Do We Recommend?
GeForce RTX 4060 Ti 16GB: The RTX 4060 Ti is a new card with Nvidia’s latest architecture and has the benefit of huge 16GB memory. Moreover, it is good for 1080p and 1440p games and is power efficient option, suitable for low-budget users.
GeForce RTX 2080 Ti: The RTX 2080 Ti, though dated, is a high-end GPU. It performs well for 1440p gaming and can handle some 4K games. Considering the current price of a refurbished RTX 2080 Ti, it offers a much better performance-to-price ratio.
By considering the above-mentioned factors, you can easily determine which GPU aligns more closely with your requirements and personal preferences.
More From RTX 4060 Ti:
More From RTX 2080 Ti:
Thank you! Please share your positive feedback. 🔋
How could we improve this post? Please Help us. 😔
[Comparisons Specialist]
I’m a passionate computer hardware expert specializing in CPUs and GPUs. With a lifelong curiosity for hardware and extensive hands-on experience, I provide valuable insights, practical advice, and in-depth analysis on these components. Engaging with the hardware community, I exchange knowledge and stay at the forefront of technological advancements.
Get In Touch: uzair@tech4gamers.com