 Threads
Intel Core i5-13600k Review
Review Summary
The Intel Core i5-13600K stands out as the best value gaming CPU in the market. It delivers impressive gaming performance while also excelling in overall tasks, making it a compelling choice. While the Core i9-13900K is an option, this CPU efficiently handles daily tasks and fulfills gaming and general needs admirably.
Overall
-
Overall Performance - 9/10
9/10
-
Value - 9/10
9/10
-
Thermal Performance - 9/10
9/10
-
Features - 9/10
9/10
-
Overclocking - 9/10
9/10
Pros
- Strong Single Core Performance.
- Overall better Multi-Core Performance over the last gen.
- iGPU
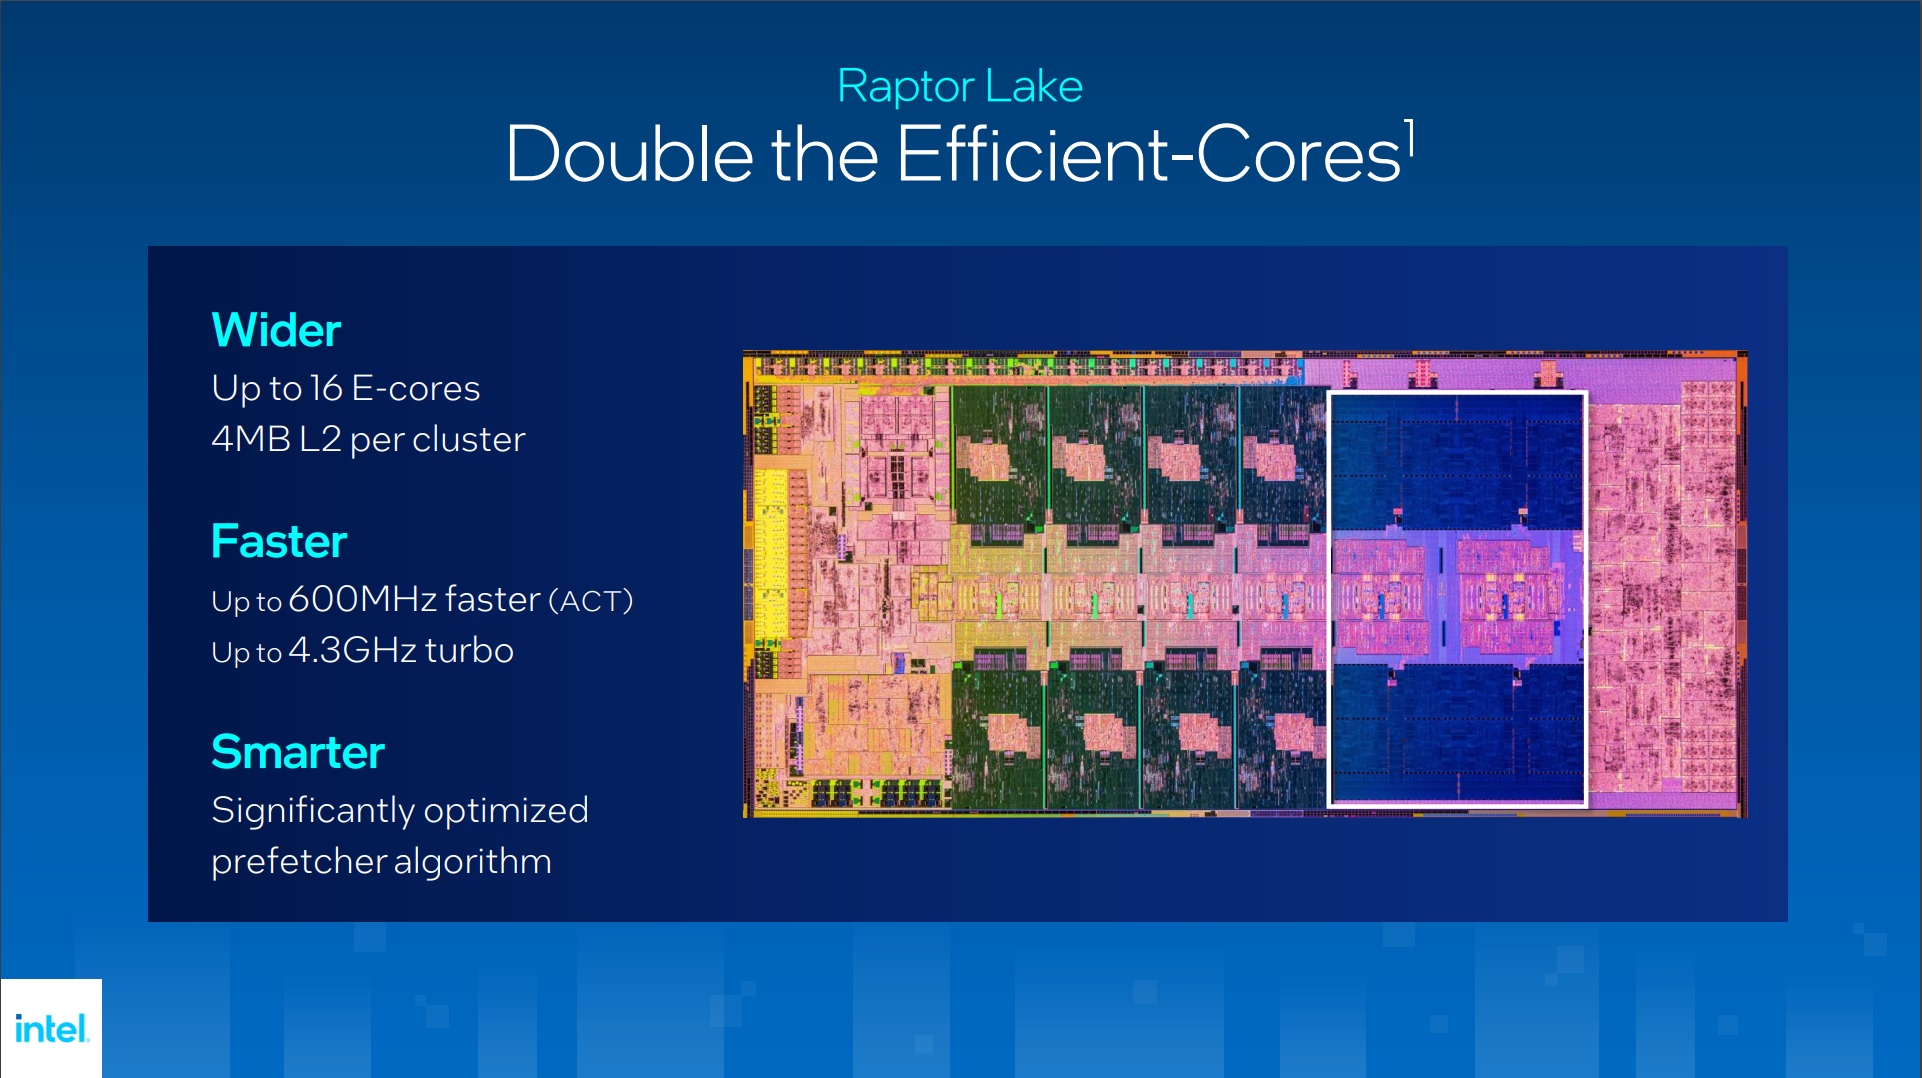
- 4x more E-Cores over the last gen.
- 1GHz Sustained Clocks on all P-Cores.
- 9GHz Sustained Clocks on all E-Cores.
- DDR4 and 5 Support.
- PCIe 5.0 Support.
Cons
- None


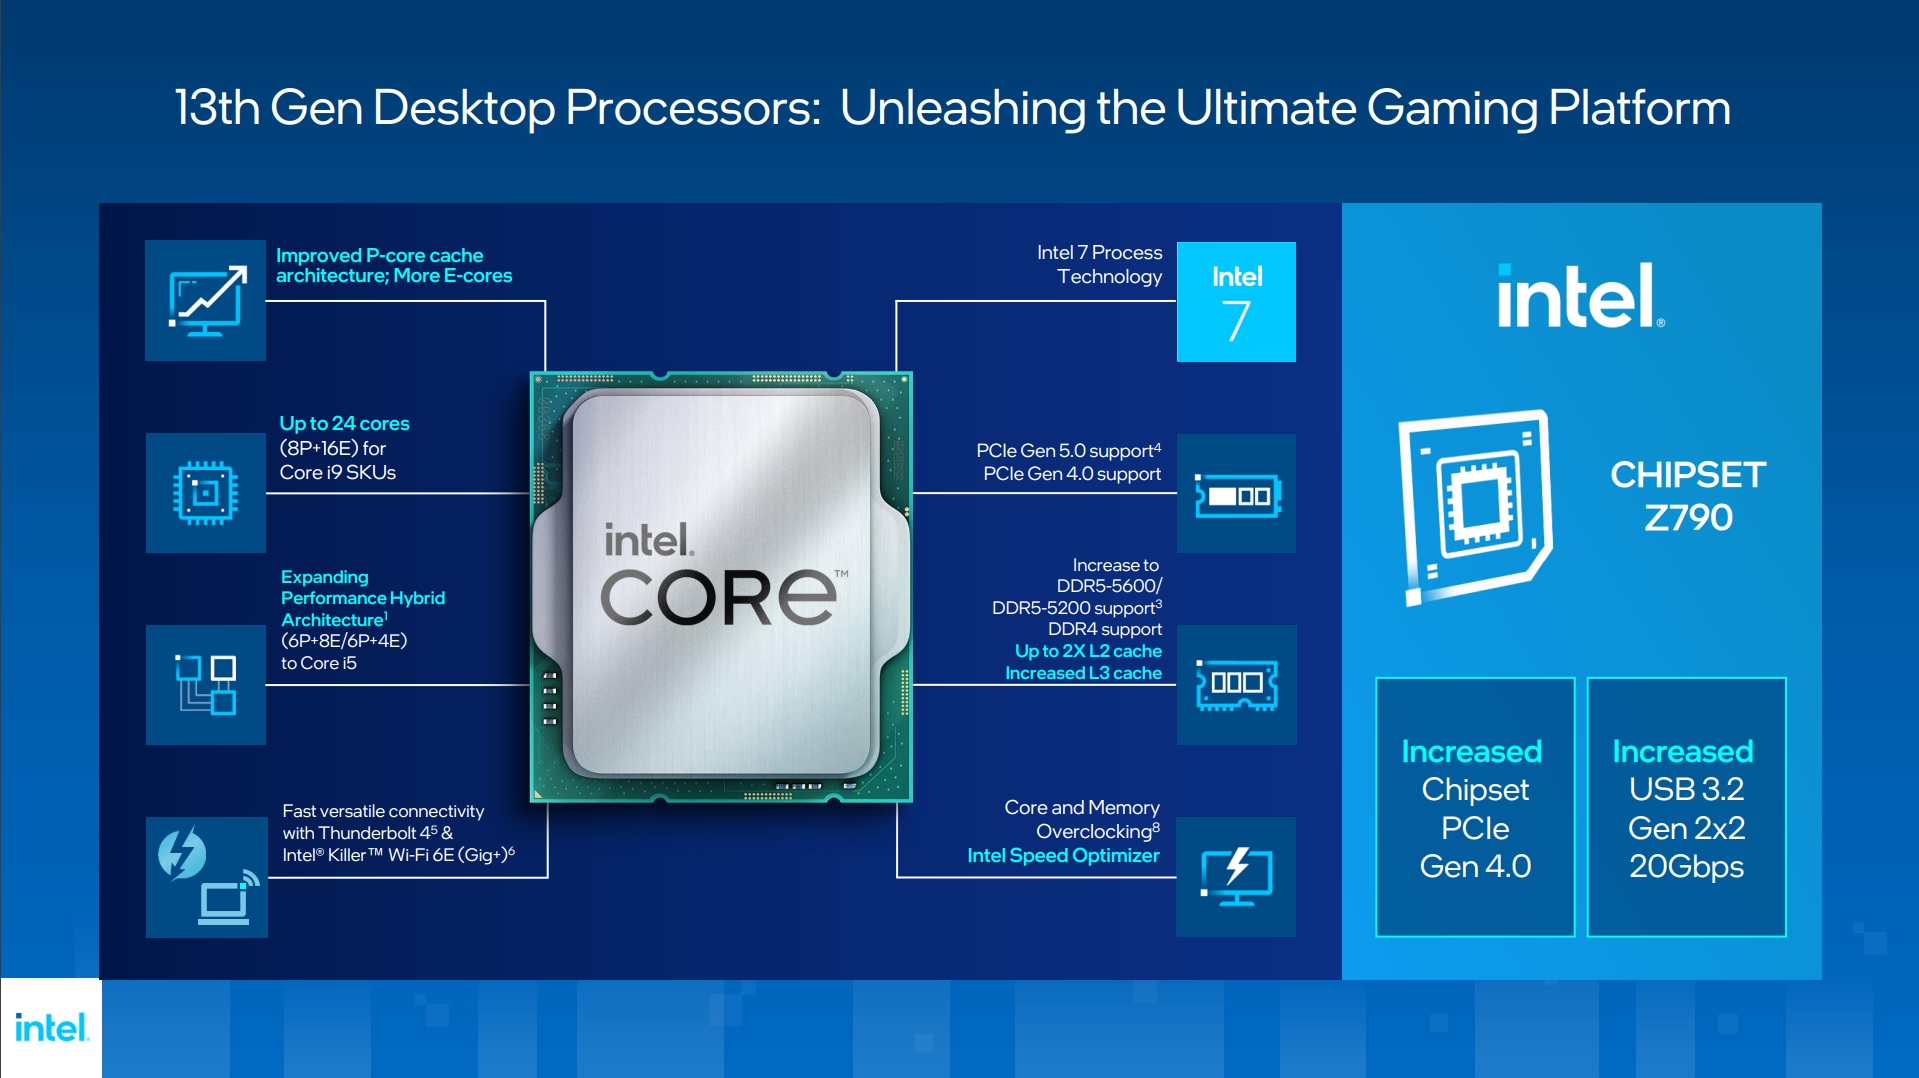
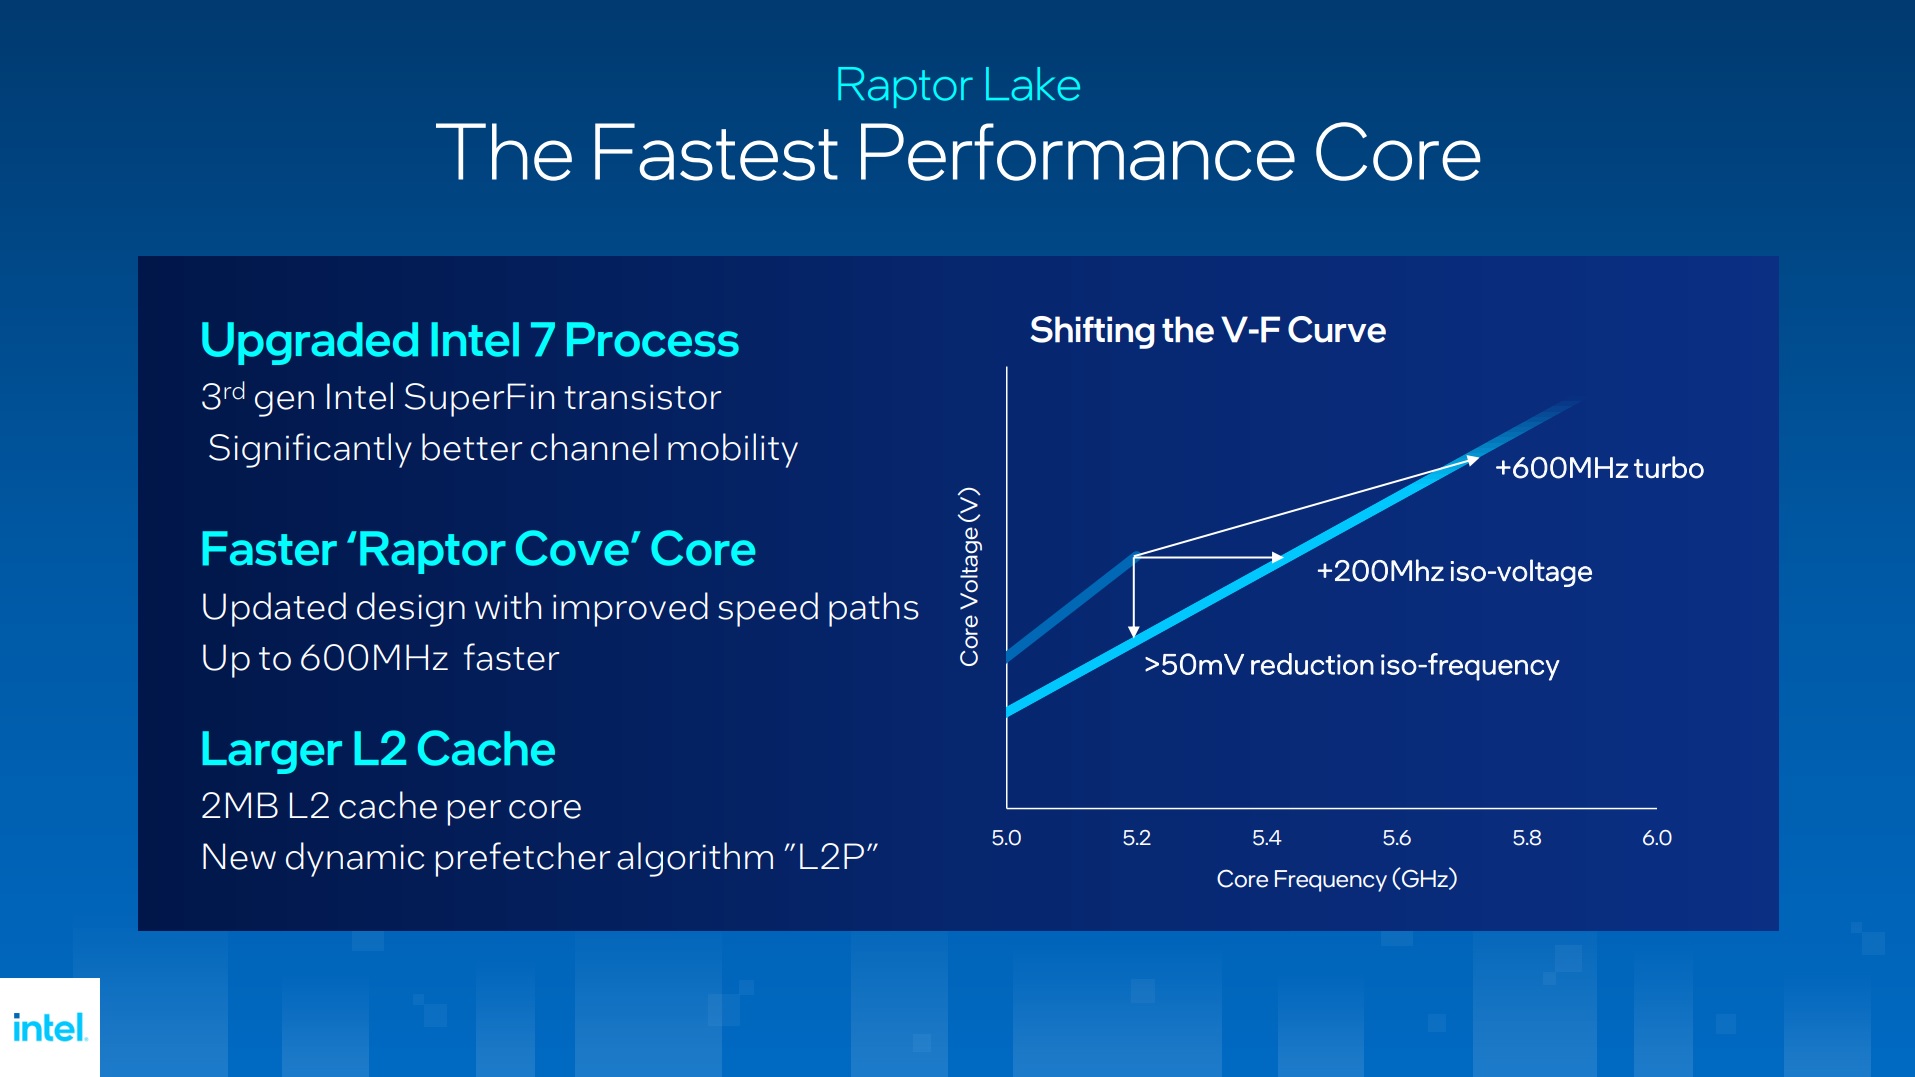
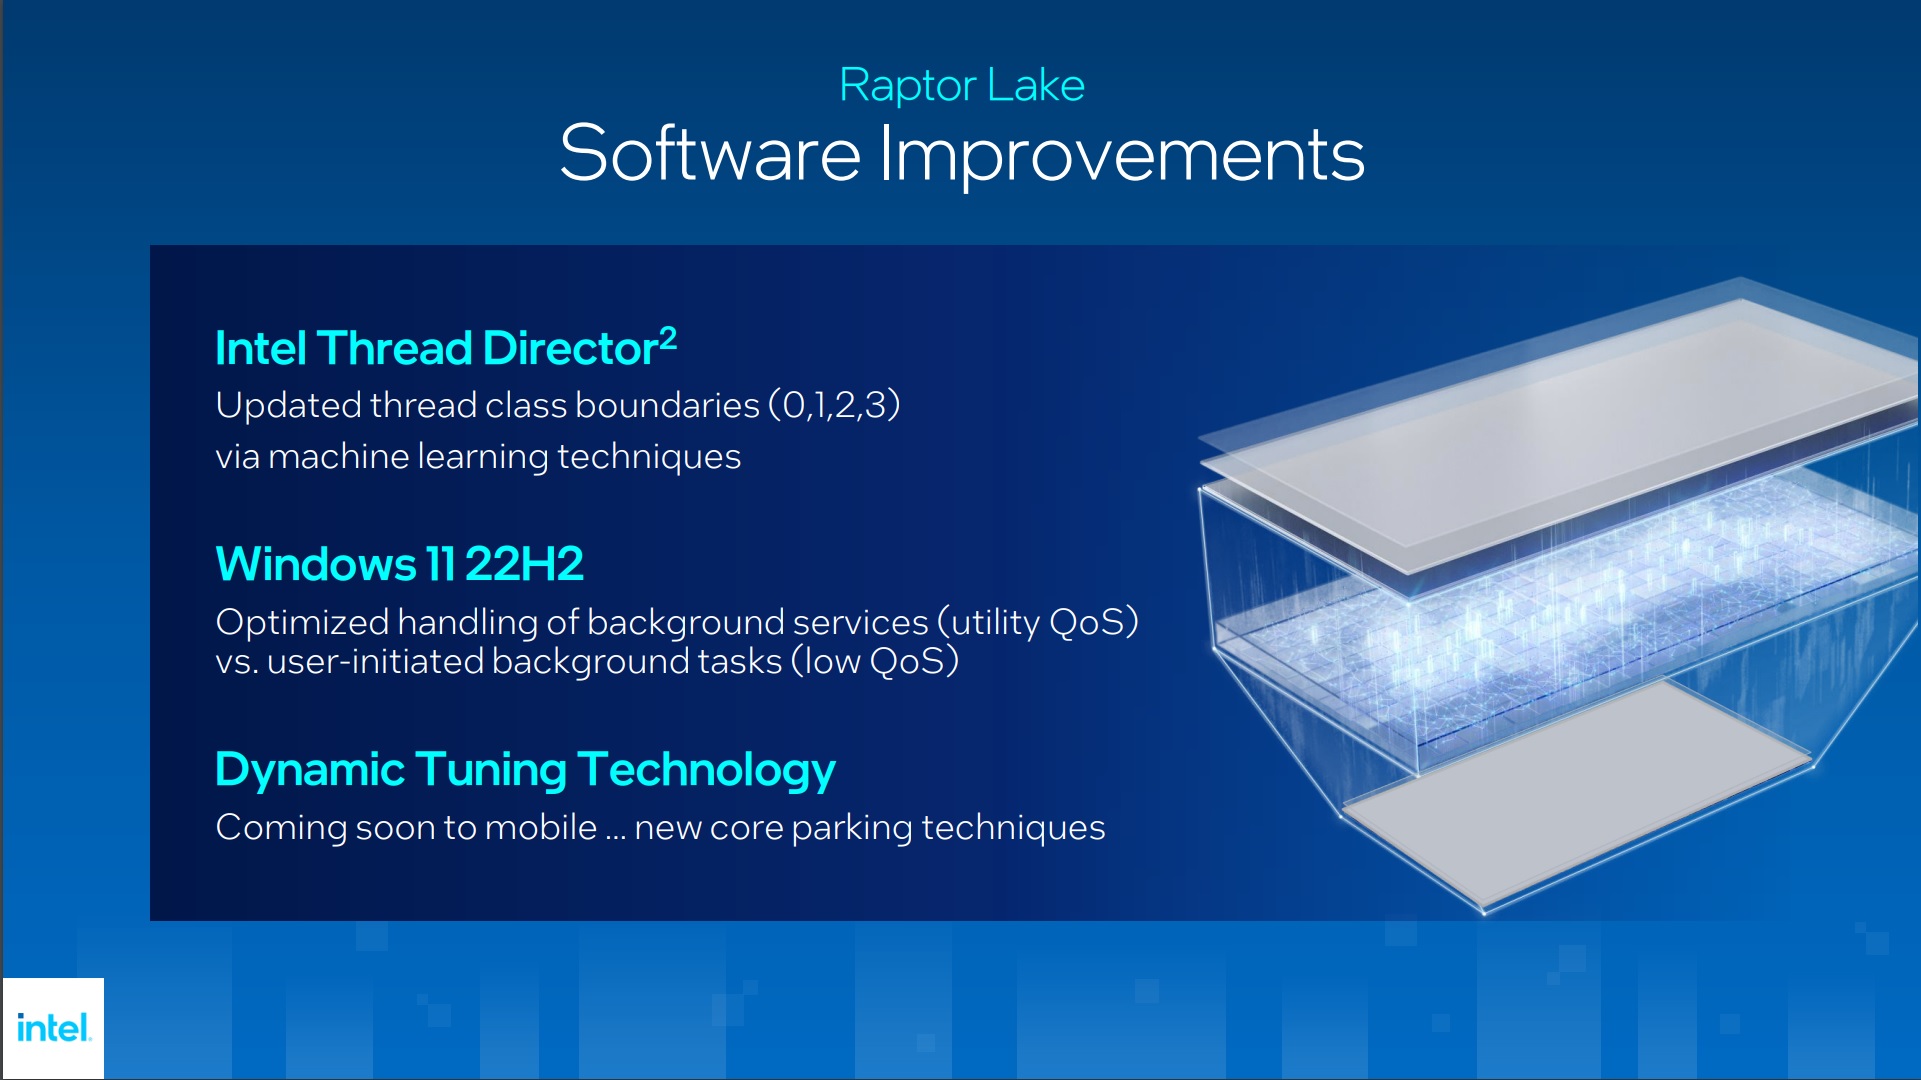
Intel has successfully launched the Raptor Lake series desktop processors, termed the 13th generation. Intel is continuing the hybrid architecture design introduced with the Alder Lake but with further refinements and advancements. They introduced new “Raptor Cove” cores in the desktop processors that benefit from larger cache sizes, higher IPC than the Alder Lake, and high clock speeds. The Core i5-13600K is among the options put forward to the users.
Key Takeaways
- The Core i5-13600K is ideal for anyone looking for a capable mid-range processor that does not break the bank.
- The Core i5-13600K is not for users looking for a power-efficient processor.
- The Core i5-13600K comes with support for both DDR4 and DDR5 and manages to provide solid performance across the board, while also benefitting from an increased core count.
About i5-13600k Architecture
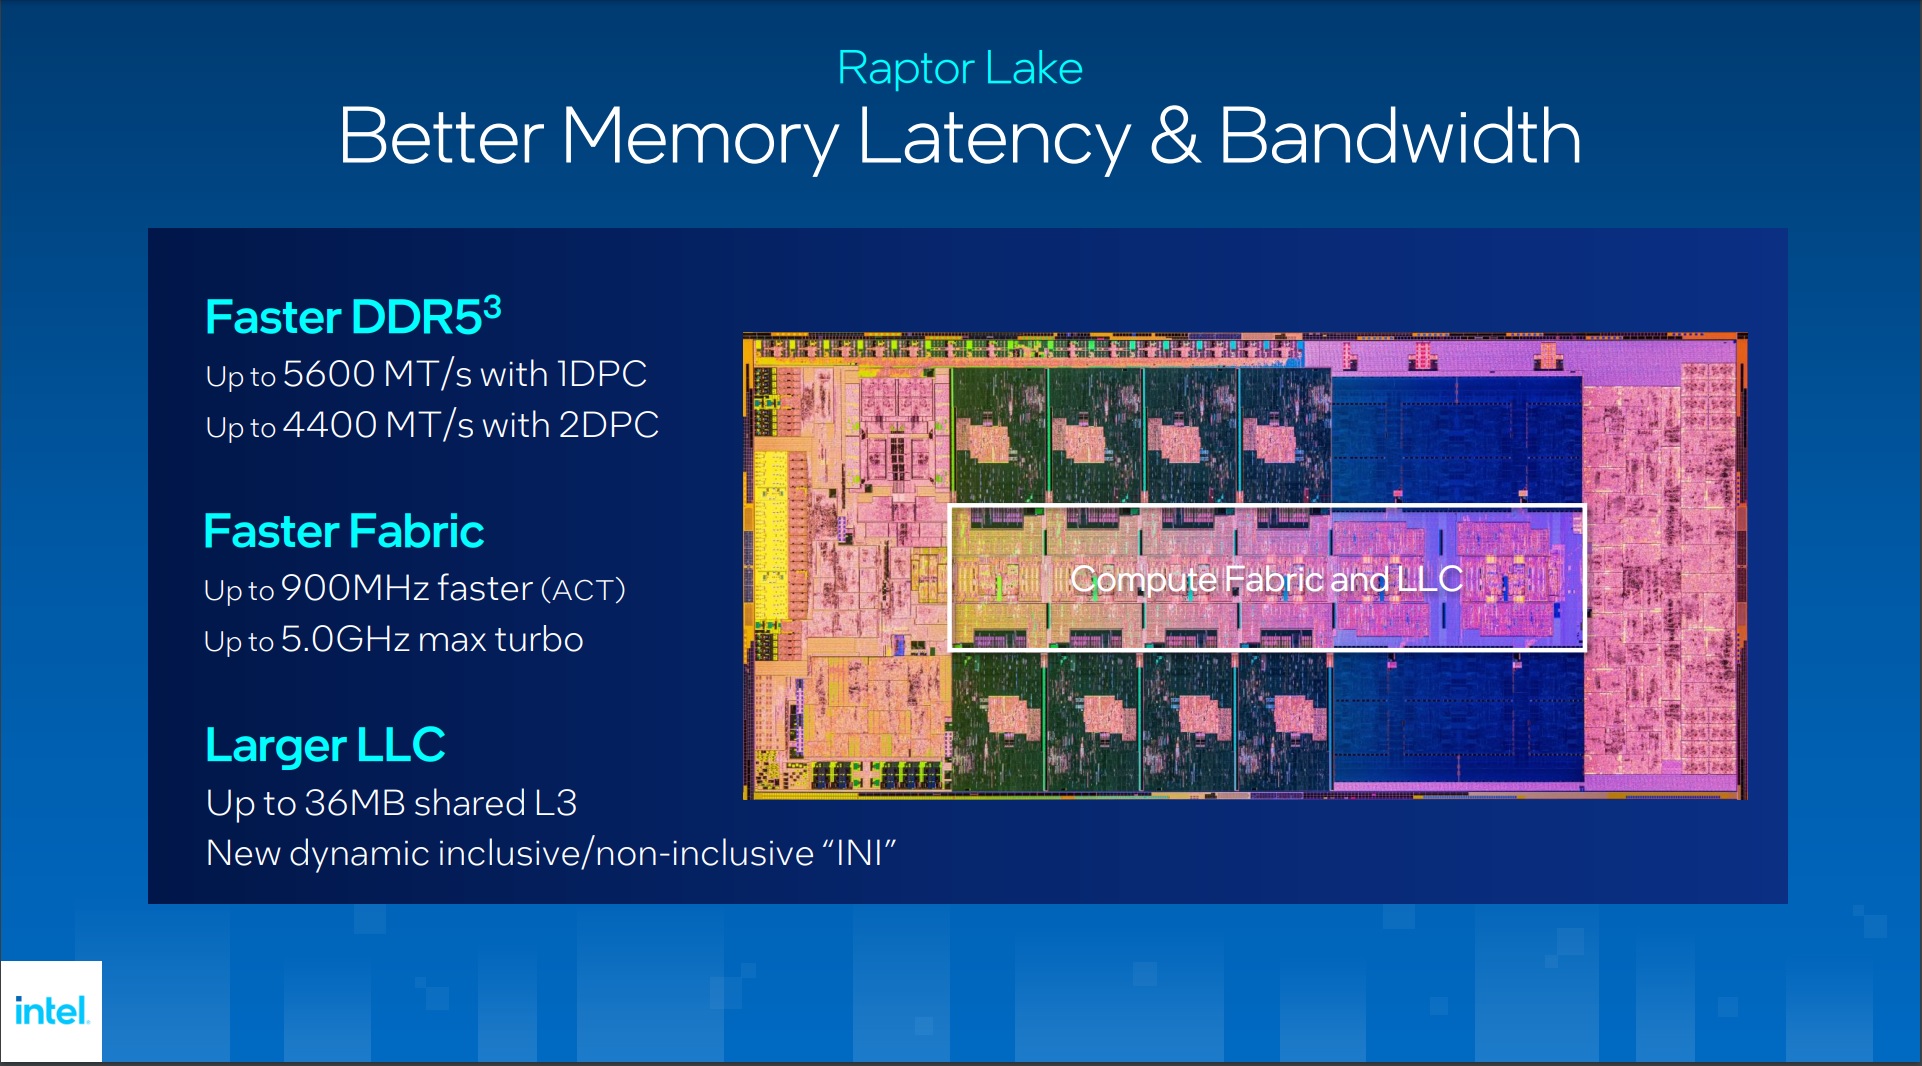
This gallery summarizes the key features of the new series.
| Product | Core i5-13600K |
|---|---|
| Manufacturer | Intel |
| Price | $320 (At the time of review) |
| Motherboard Support | BEST Motherboards For i5-13600K |
| Cooler Support | Best CPU Coolers For i5-13600K |
| GPU Support | Best GPU For i5-13600K |
| RAM Support | Best RAM For i5-13600K |
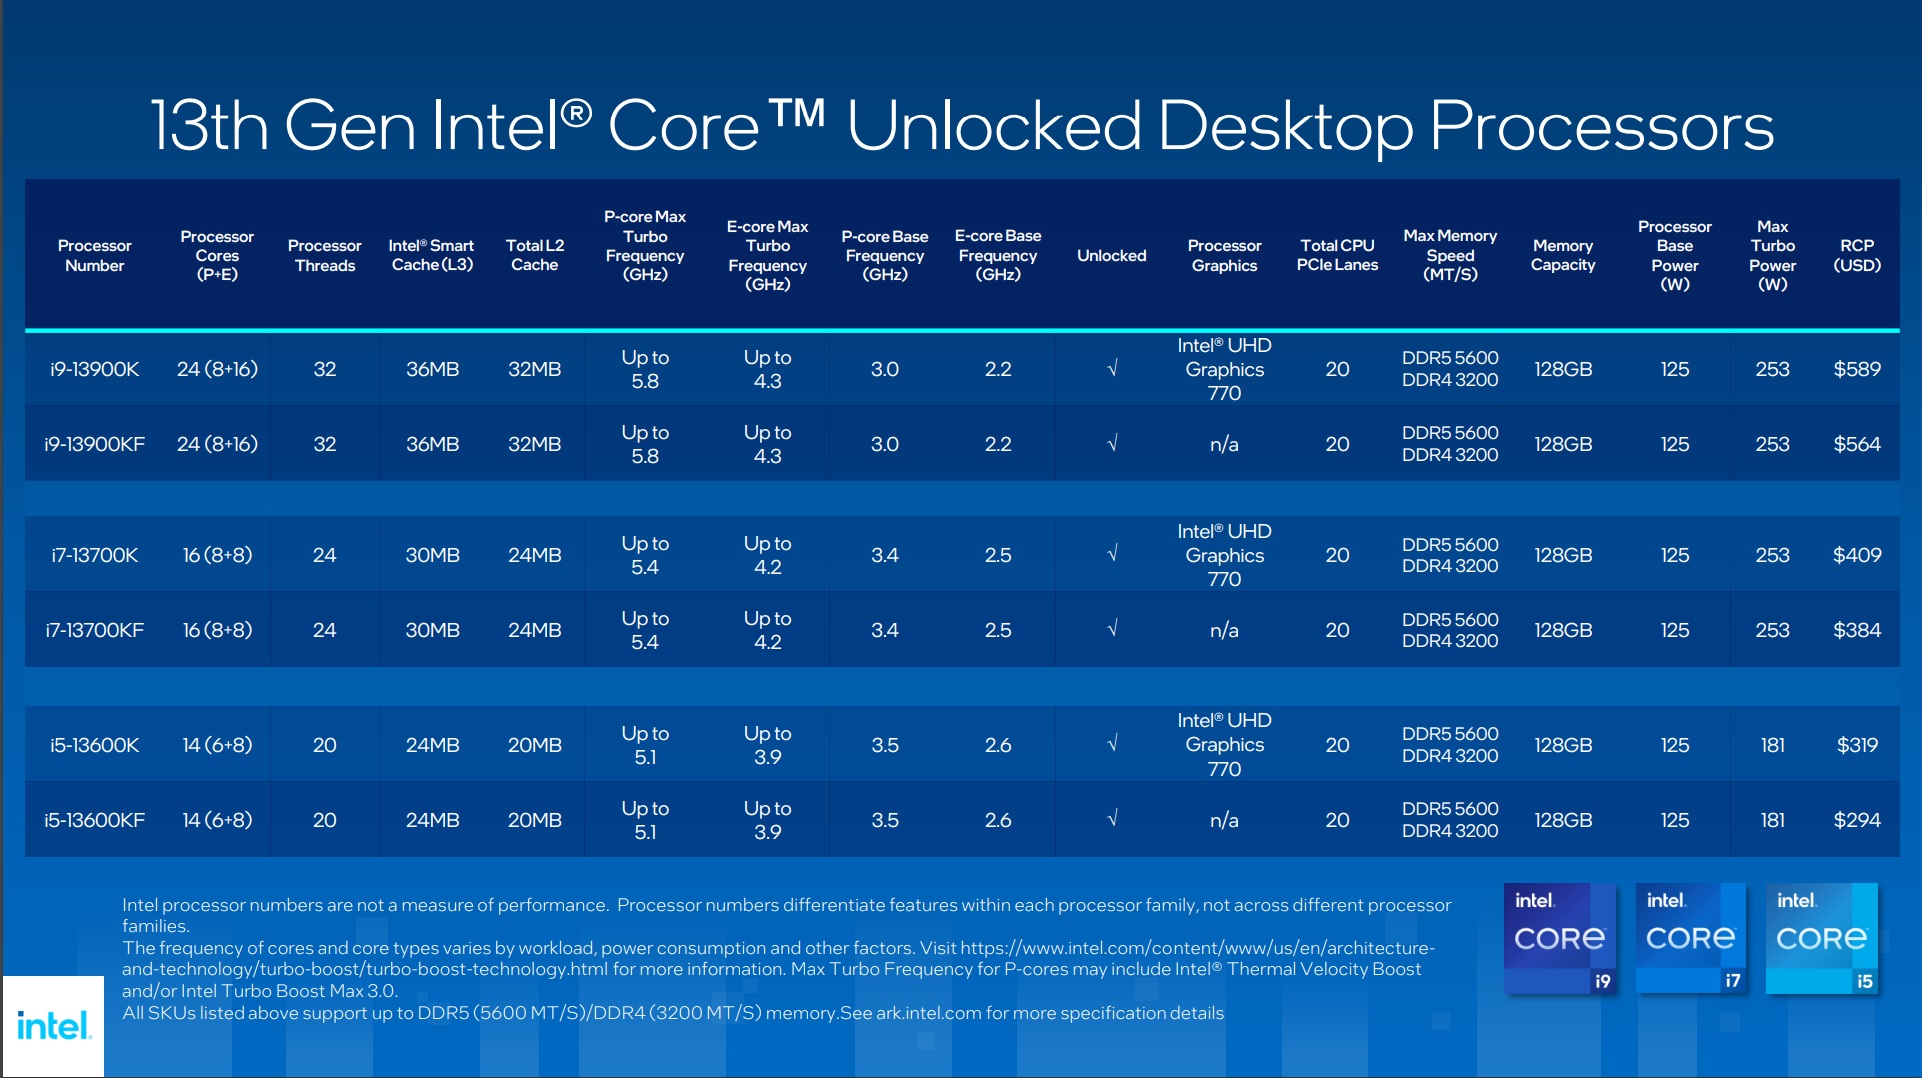
I’m currently testing the Core i5-13600K, featuring 6 P-Cores and 8 E-Cores with a thread count of 12 for P-Cores thanks to hyper-threading, bringing the total thread count to 20. P-Cores run at a 3.50GHz base clock, with E-Cores at 2.60GHz. Max Turbo Frequency is 5.1GHz for P-Cores and 3.9GHz for E-Cores. The CPU boasts a 20MB L2 cache, 24MB L3 cache, 125W power at base clocks, and 181W at max turbo frequency.
These are the specifications for the 13th-gen lineup.
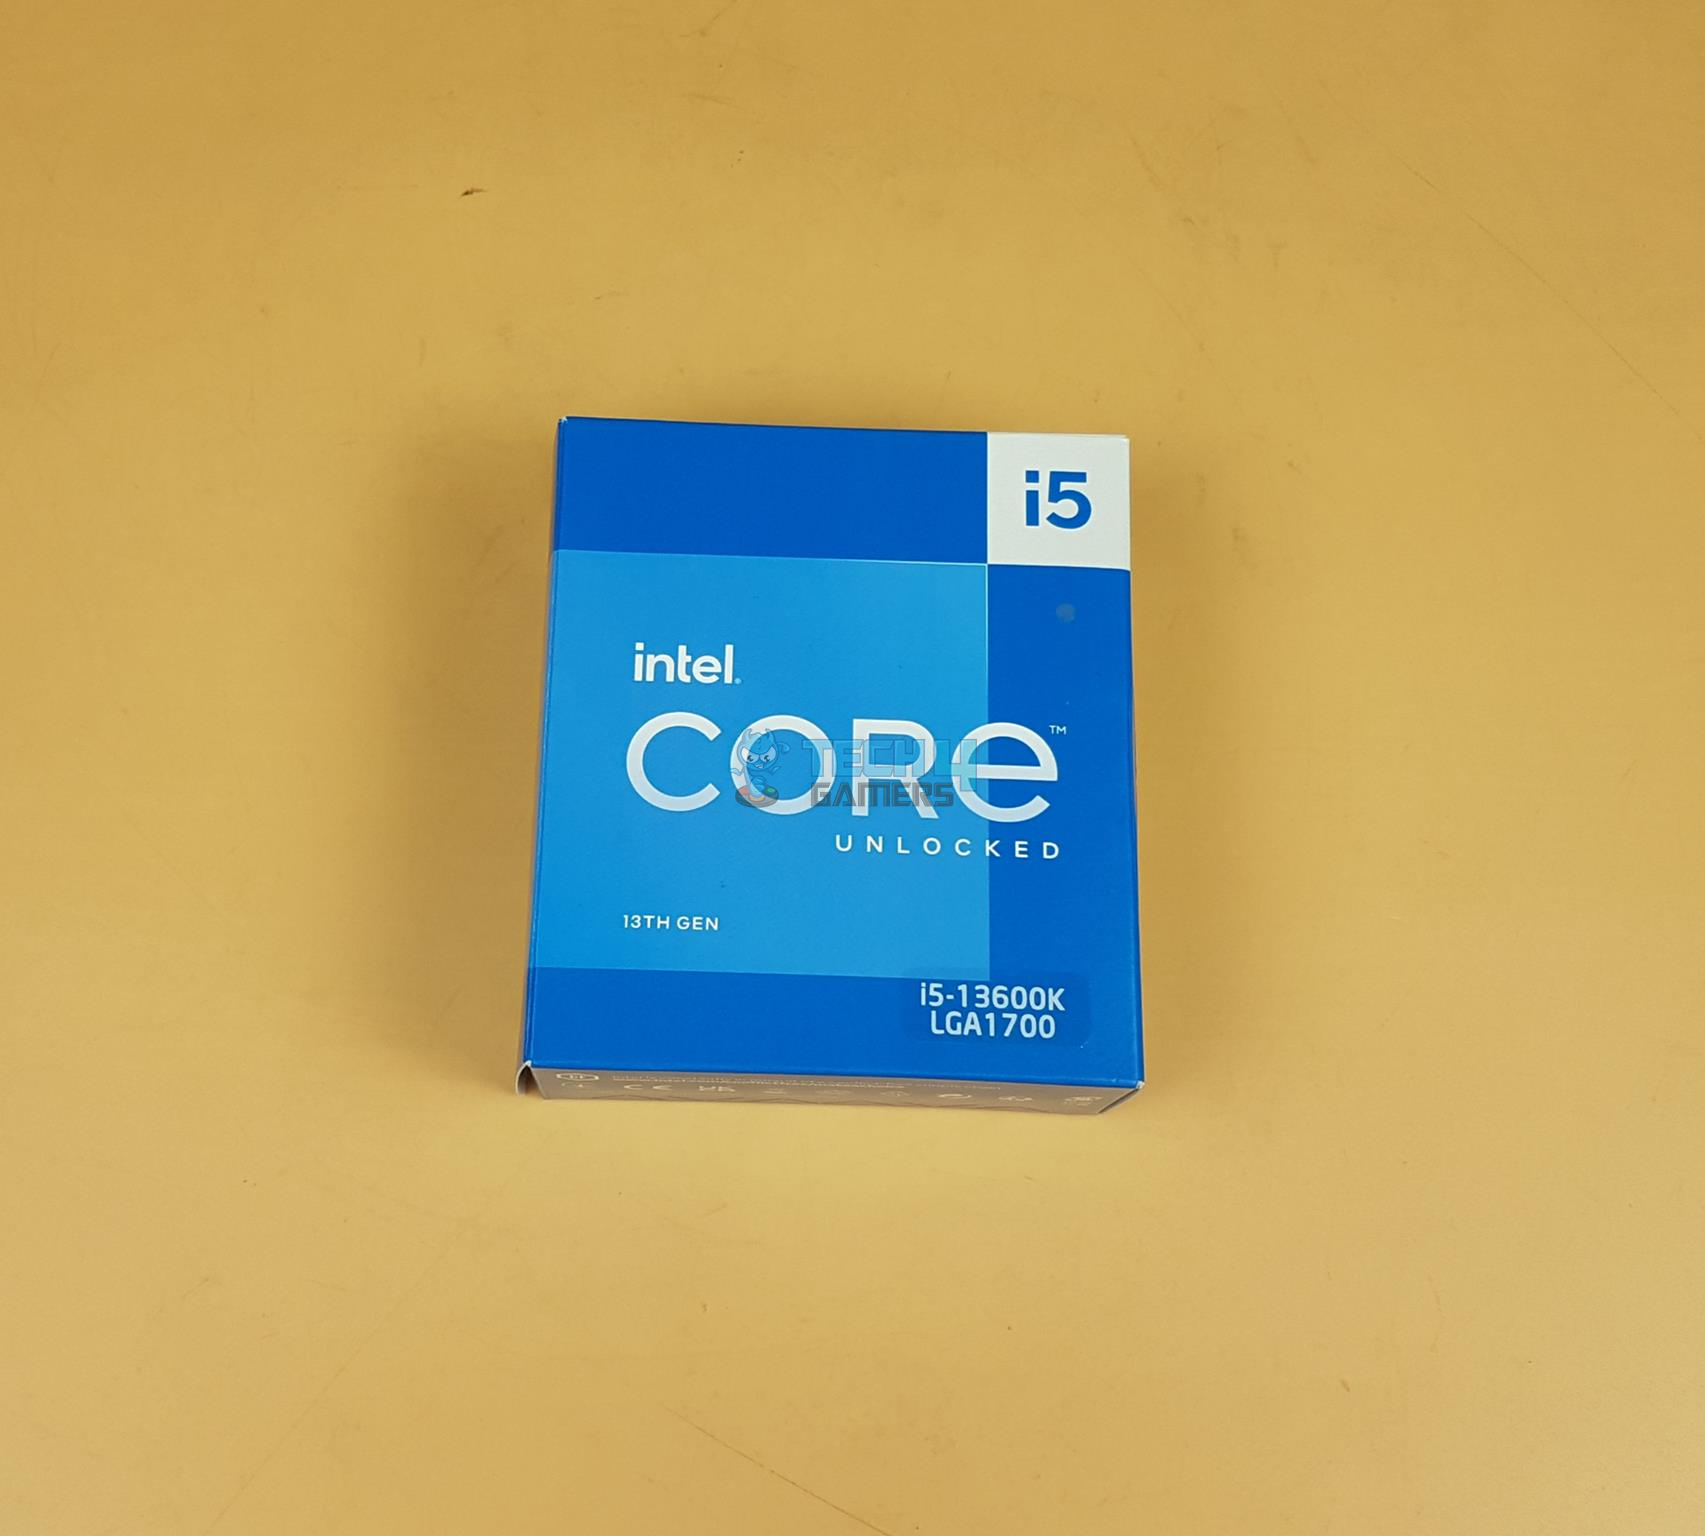
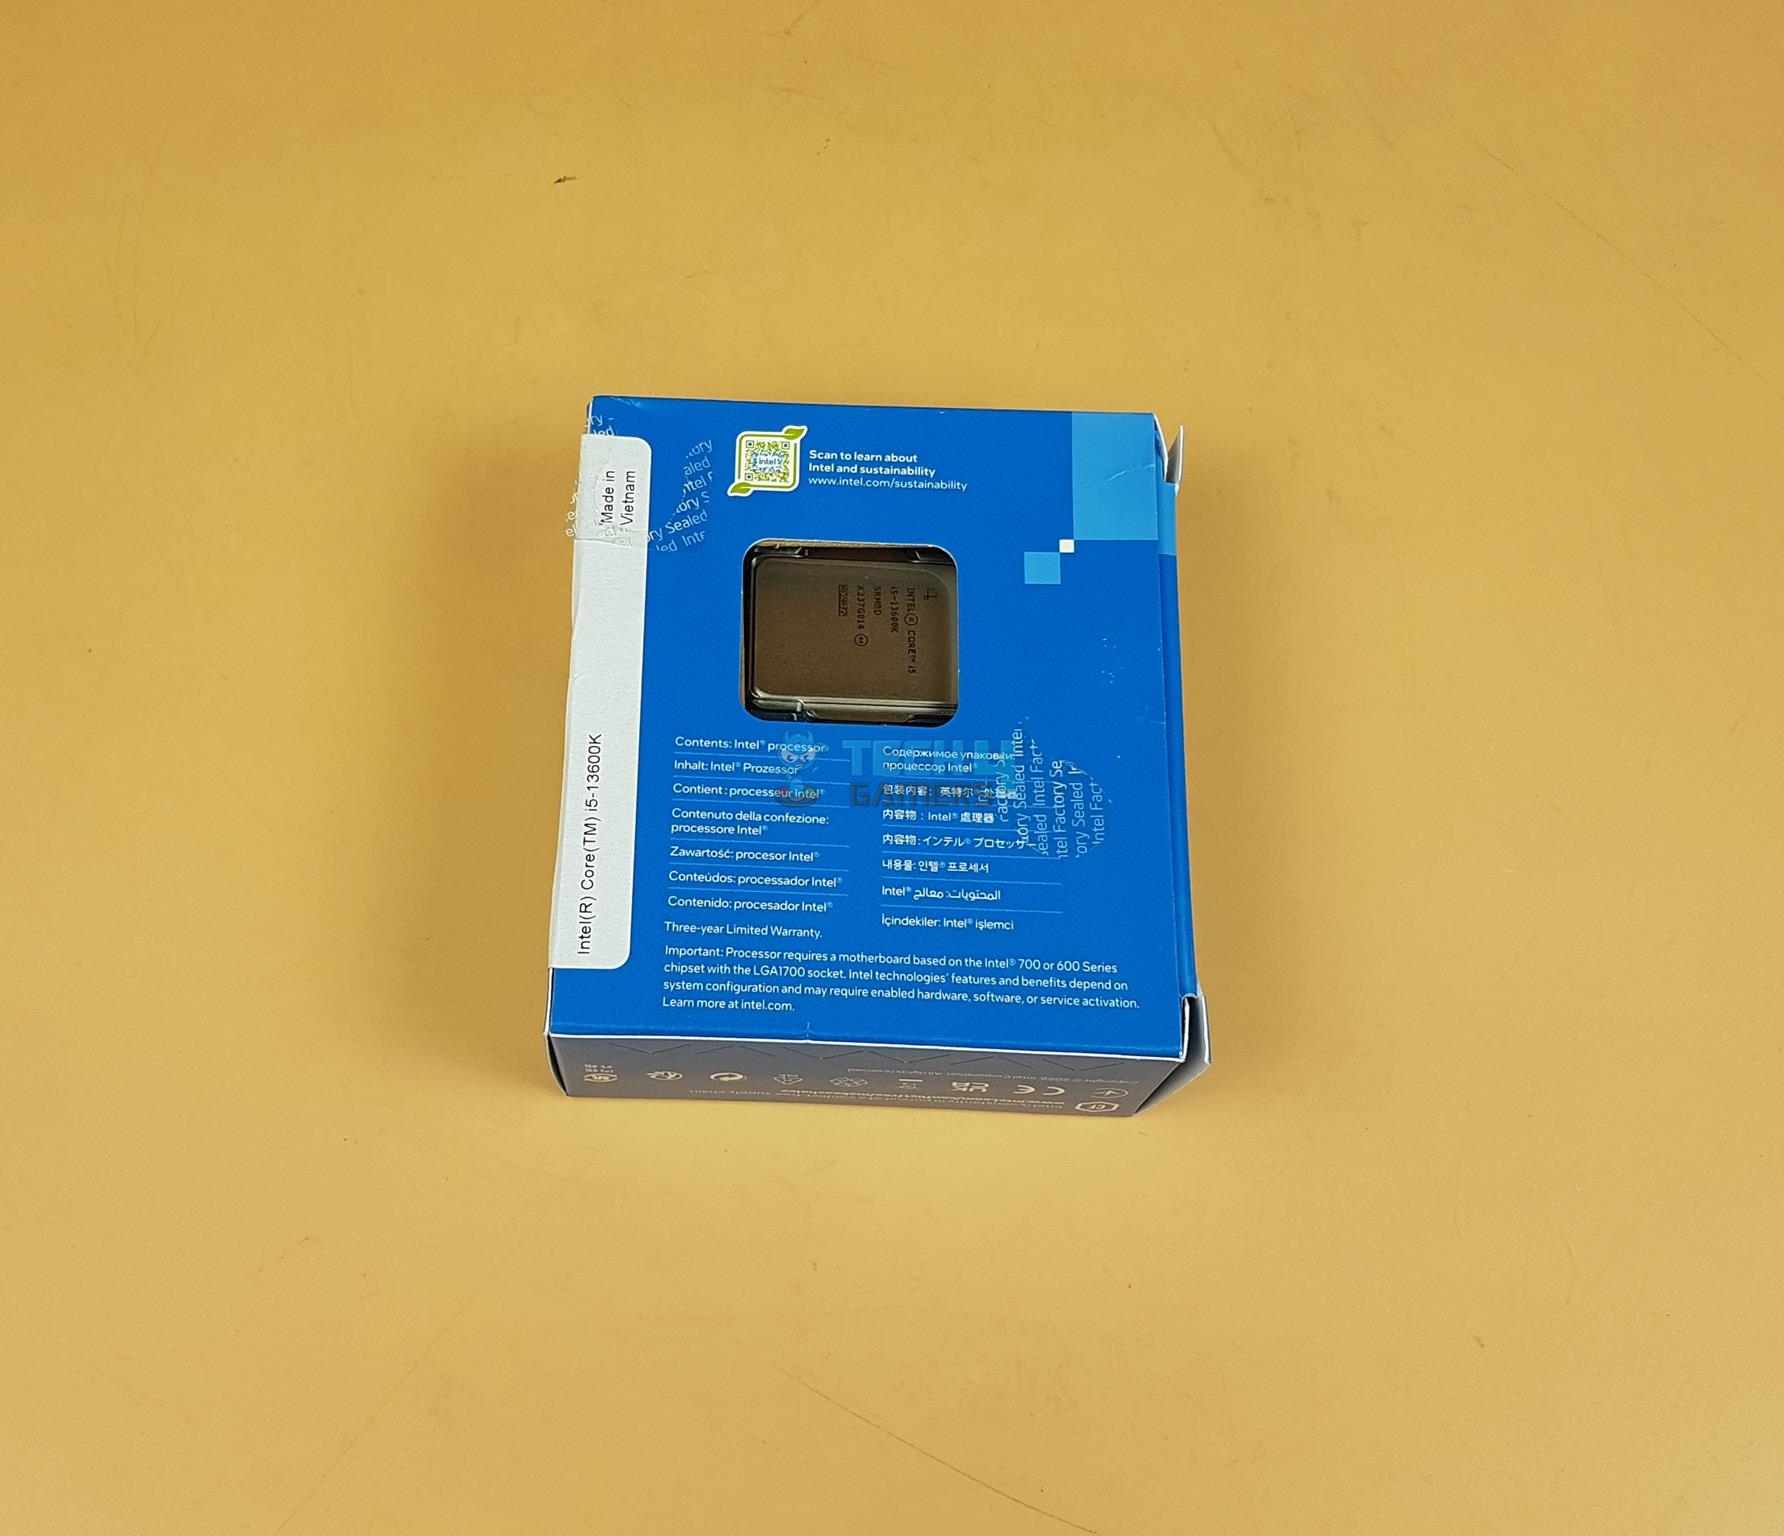
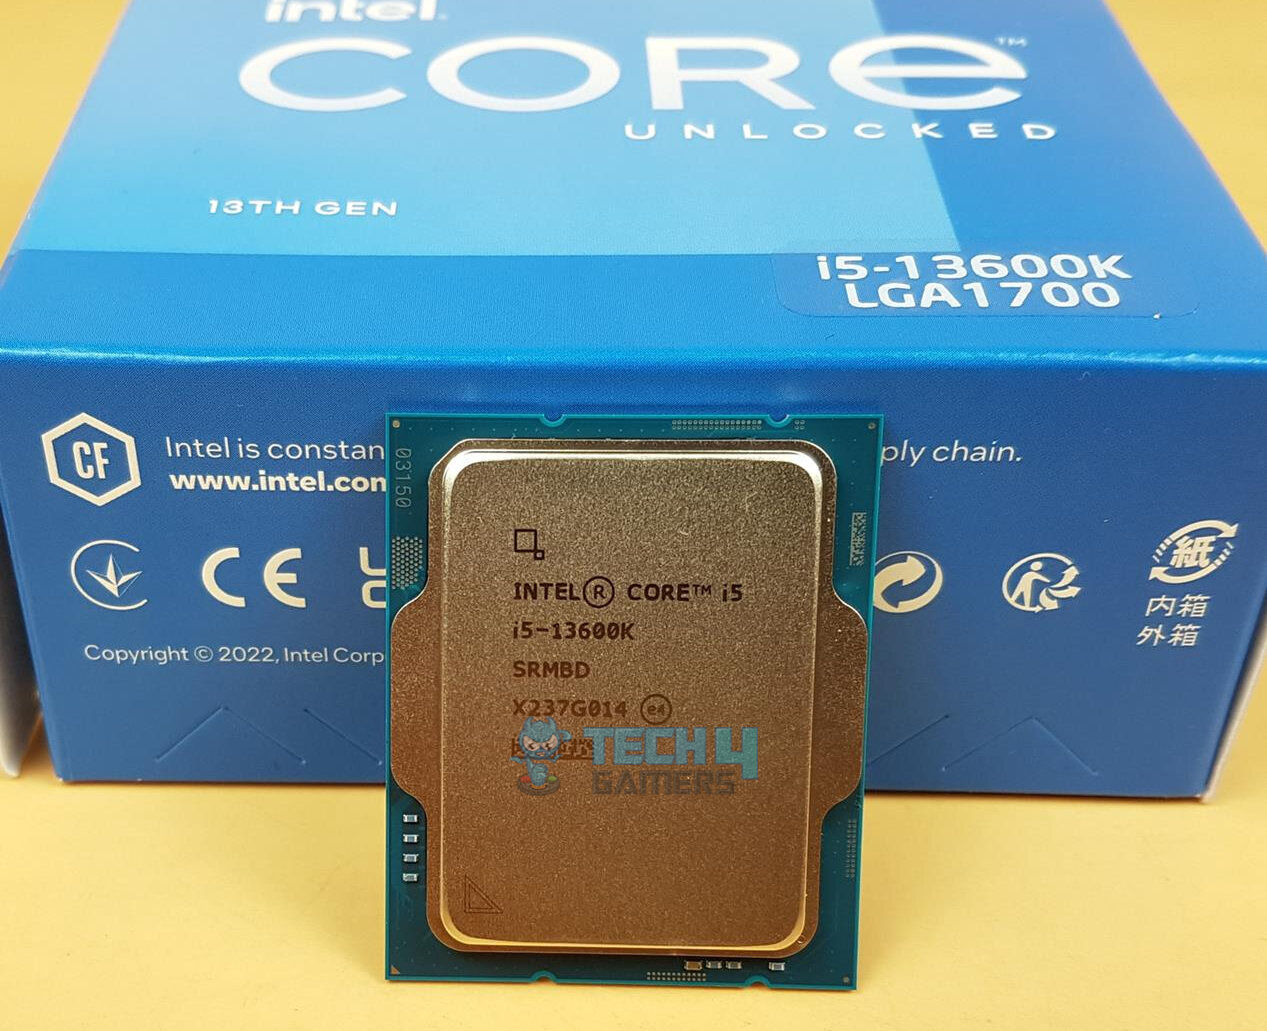
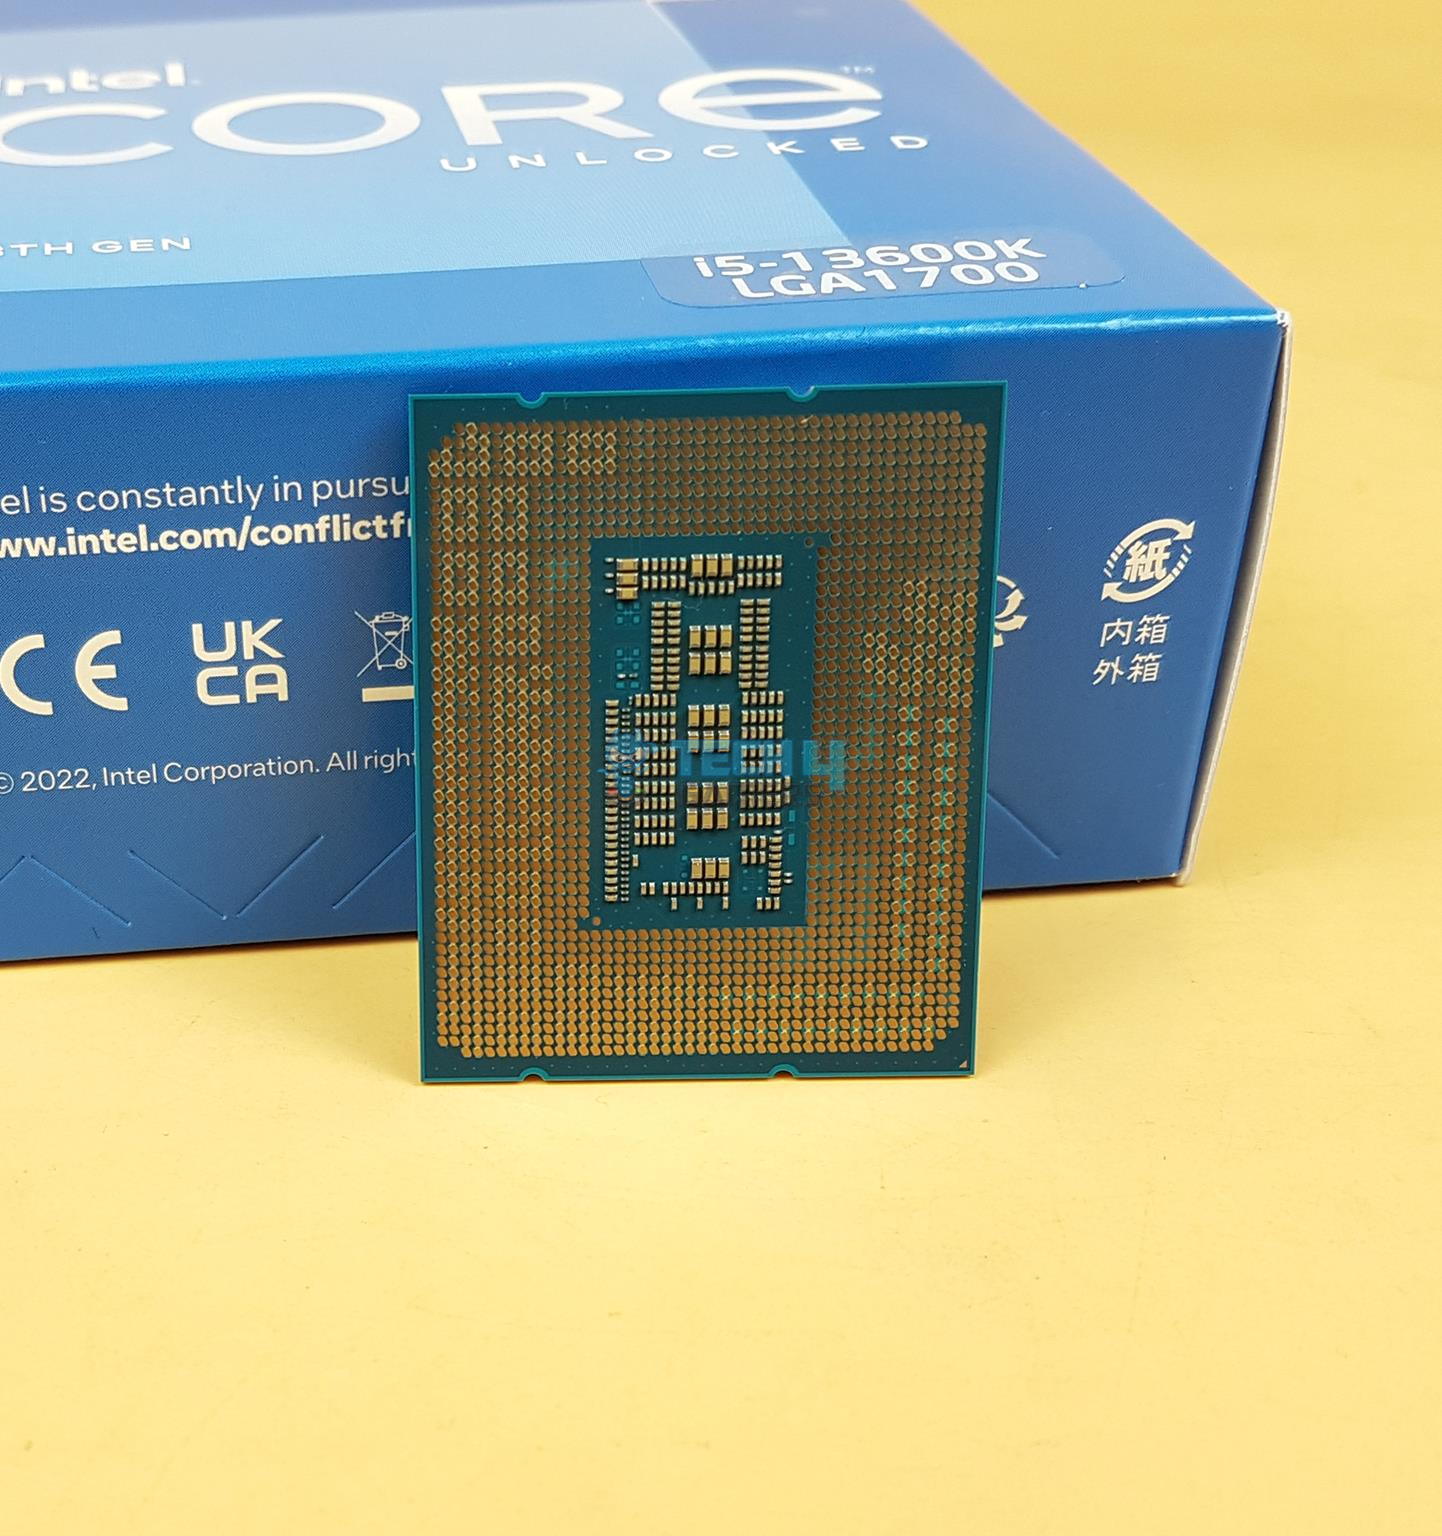
Packing and Unboxing
The CPU is shipped inside the blue color-themed paperboard packing box.
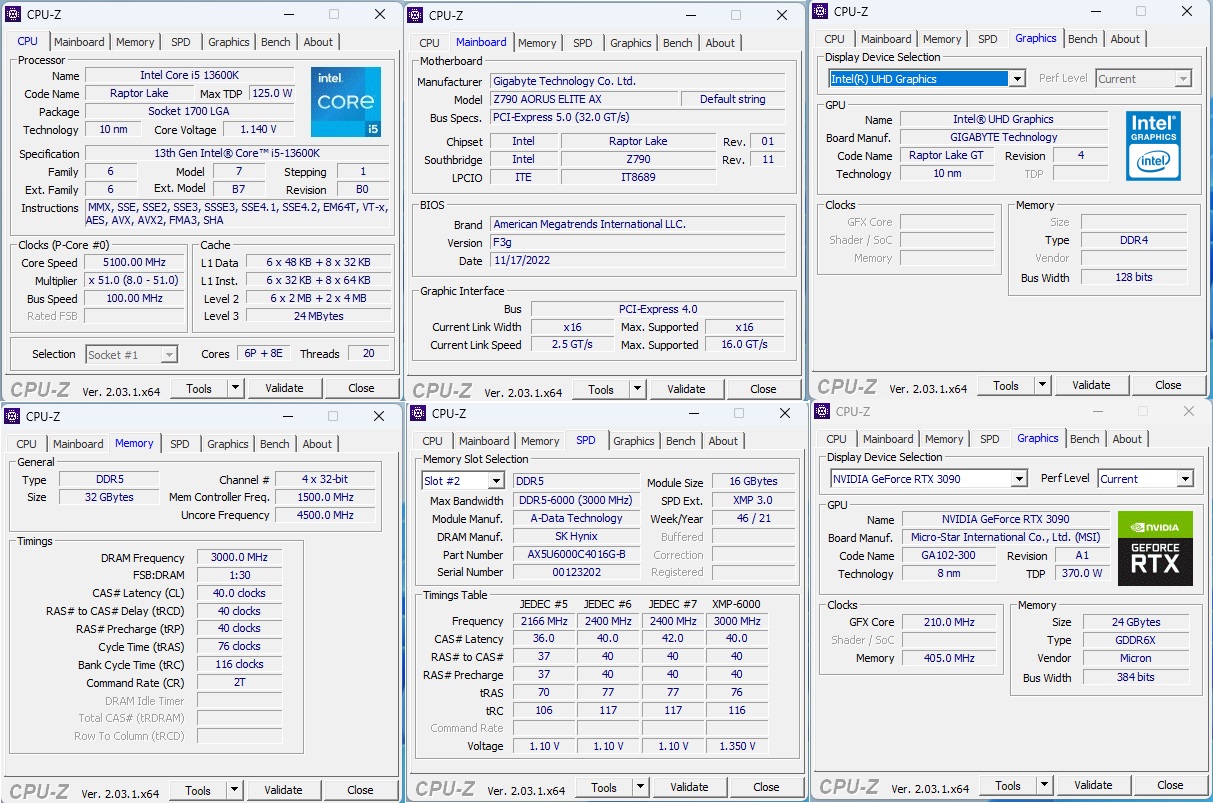
The above picture shows the CPU-Z run from the system. Our sample was boosted to 5.4GHz out of the box.
Testing
Following is the configuration of the test benches that have been used for this content.
| Platform | Intel Z790 | AMD X670E | Intel Z690 | Intel Z390 | Intel Z390 | Intel Z370 | Intel Z490 | AMD X470 | AMD X570 |
|---|---|---|---|---|---|---|---|---|---|
| CPU | i5-13600K | Ryzen 7 7700X | i7 12700k | i5 9600k | i9 9900k | i7 8700k | i7 10700k | Ryzen 7 2700X | AMD Ryzen 7 3700X |
| Mobo | Z790 AORUS ELITE AX | X670E AORUS MASTER | Z690 AERO G | Strix Z390-E | Strix Z390-E | Ultra Durable Z370-HD3 | MAG Z490 TOMAHAWK | Strix X470-F Gaming | X570 Aorus Pro |
| RAM | 32GB @ 6000MHz | 32GB @ 6000MHz | 32GB @ 6000MHz | 16GB @ 3000MHz | 16GB @ 3000MHz | 16GB @ 3000MHz | 16GB @ 3000MHz | 16GB @ 3000MHz | 16GB @ 3000MHz |
| GPU | RTX 3090 | RTX 3090 | RTX 3090 | GTX 1080 | GTX 1080 | GTX 1080 | GTX 1080 | GTX 1080 | GTX 1080 |
| AIO | AlphaCool Custom Loop | DeepCool LS720 | DeepCool LS720 | Asus Ryujin 360 | EK-AIO 240 D-RGB | Asus Ryujin 360 | EK-AIO 240 D-RGB | Asus Ryujin 360 | Asus Ryujin 360 |
Special Note To Thank Our Sponsors: AMD, ASUS, GIGABYTE, MSI, Sabrent, DeepCool, be quiet!, and ANTEC.
Methodology
The following was ensured for each test:
- Each test is done on the Auto and Stock settings.
- Default tweaking/performance enhancement options are disabled in the BIOS.
- XMP is loaded for each test. DRAM timings and Voltage are set manually.
- All other voltages are left at Auto.
- The pump and fans of the cooling solution are set to run at 100% during the testing.
- Games are benched on the stock clocks.
- The overclocking results of the processor under discussion are shown.
- The Graphics card is not overclocked.
- The motherboards’ BIOS is updated to their latest.
- Nvidia’s driver 517.48 is used.
- HWinfo64 is used to monitor the sensors.
- Each game was tested on maxed settings using the built-in benchmark utility where available, and the MSI After Burner was used to record the FPS from the actual gameplay.
Let’s start with the results. The testing was done on Microsoft Windows 11 x64 version 22H2.
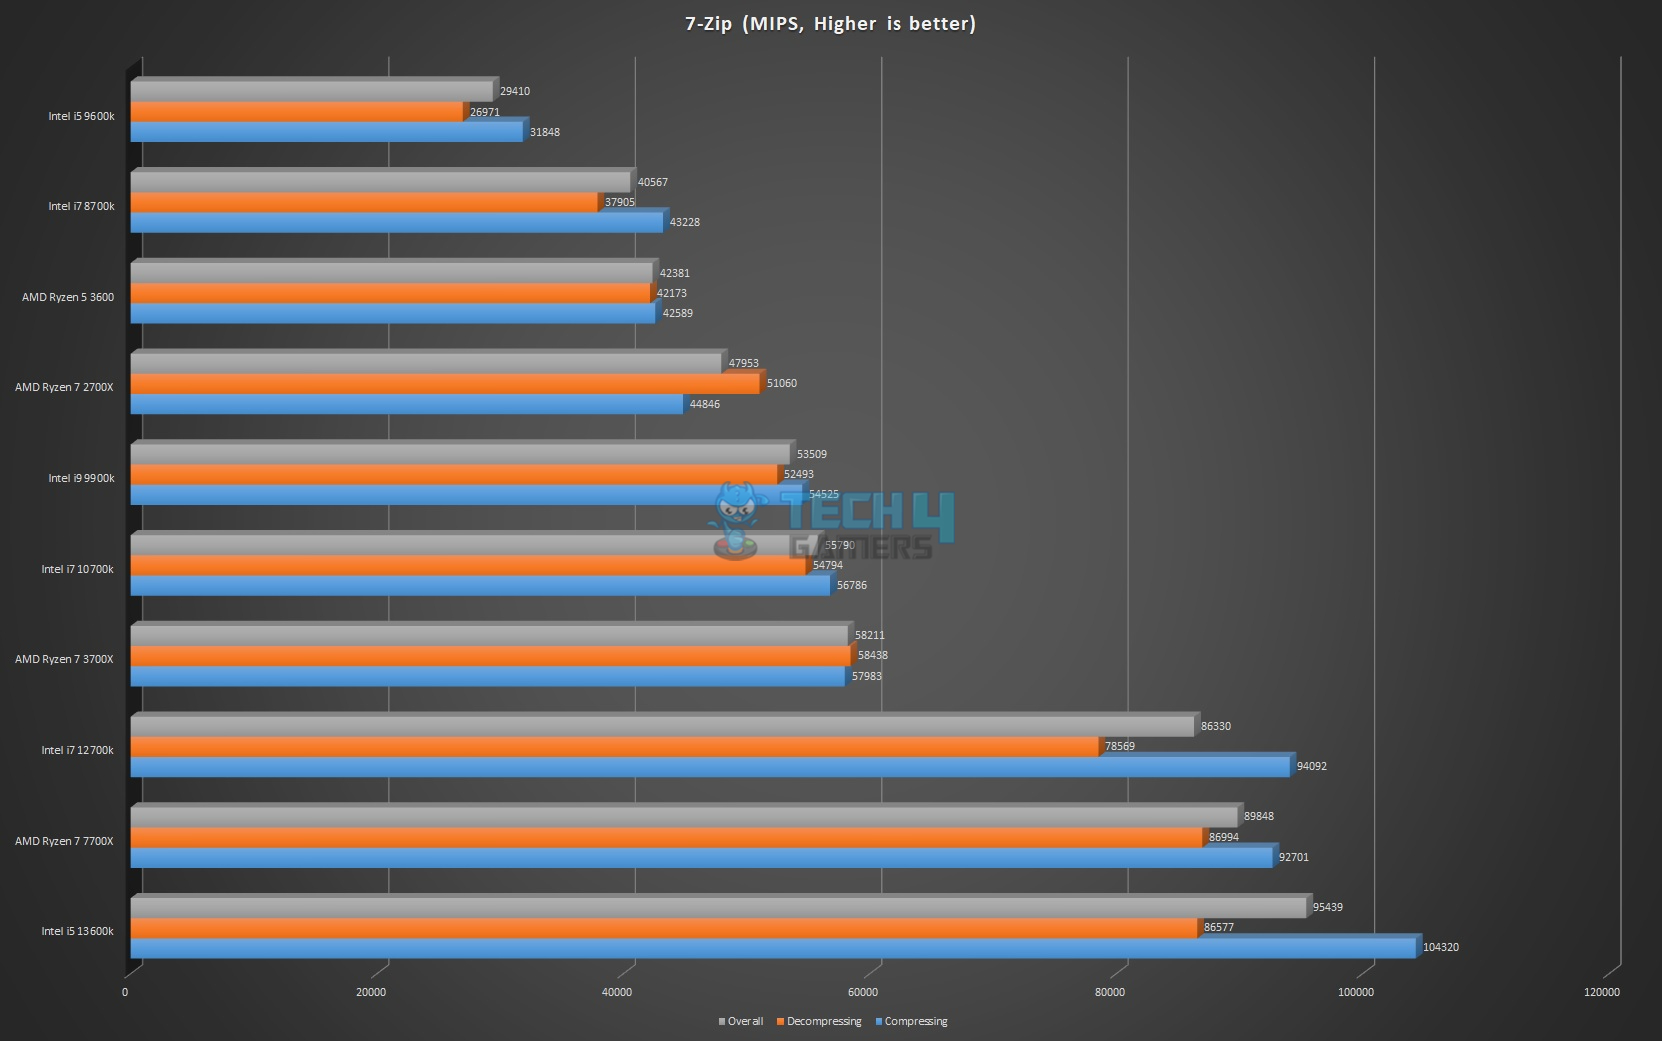
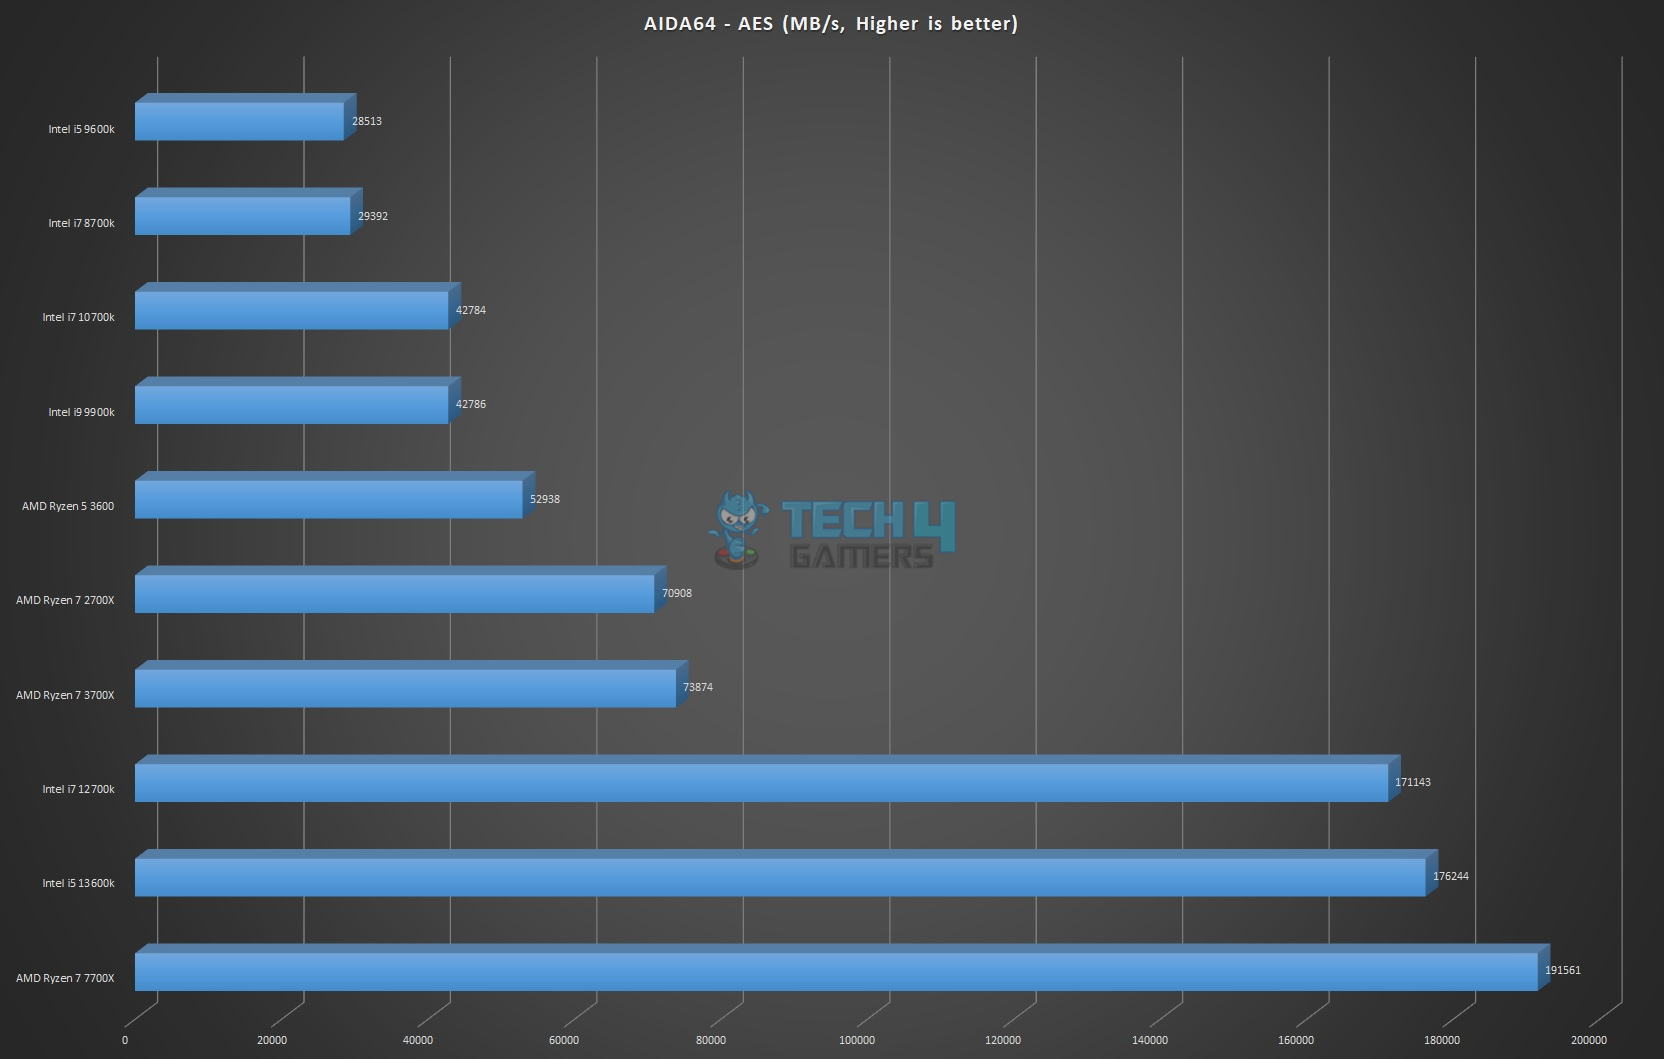
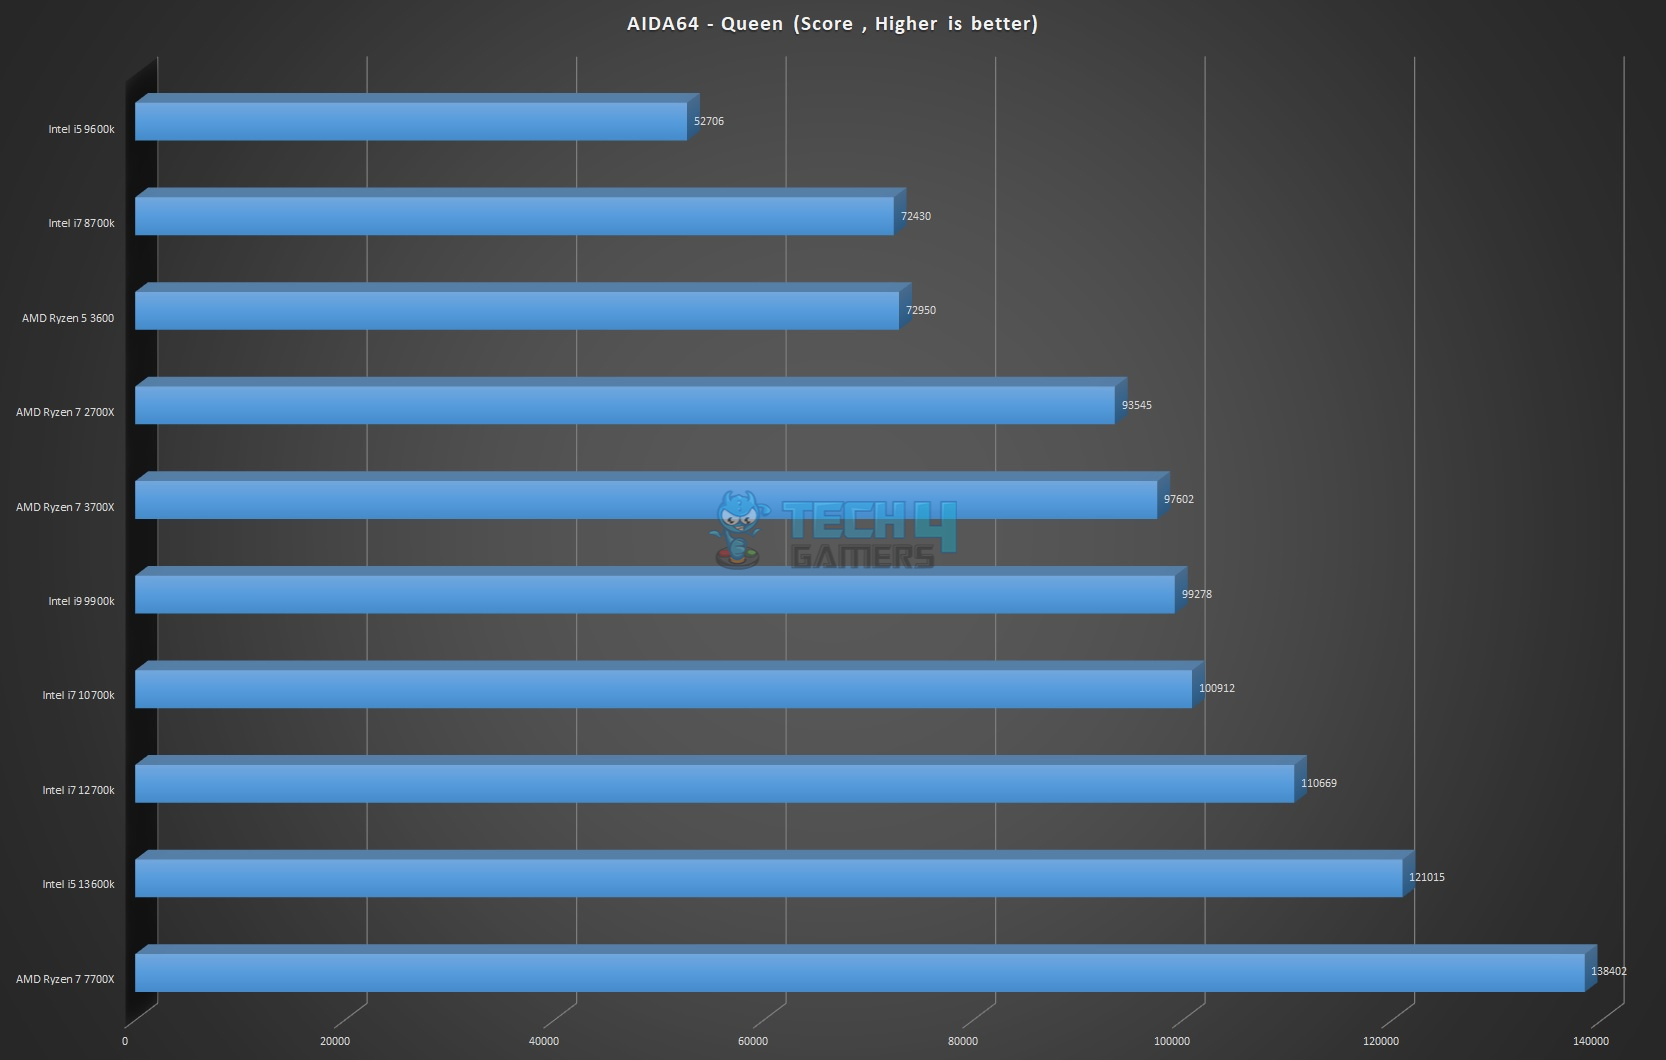
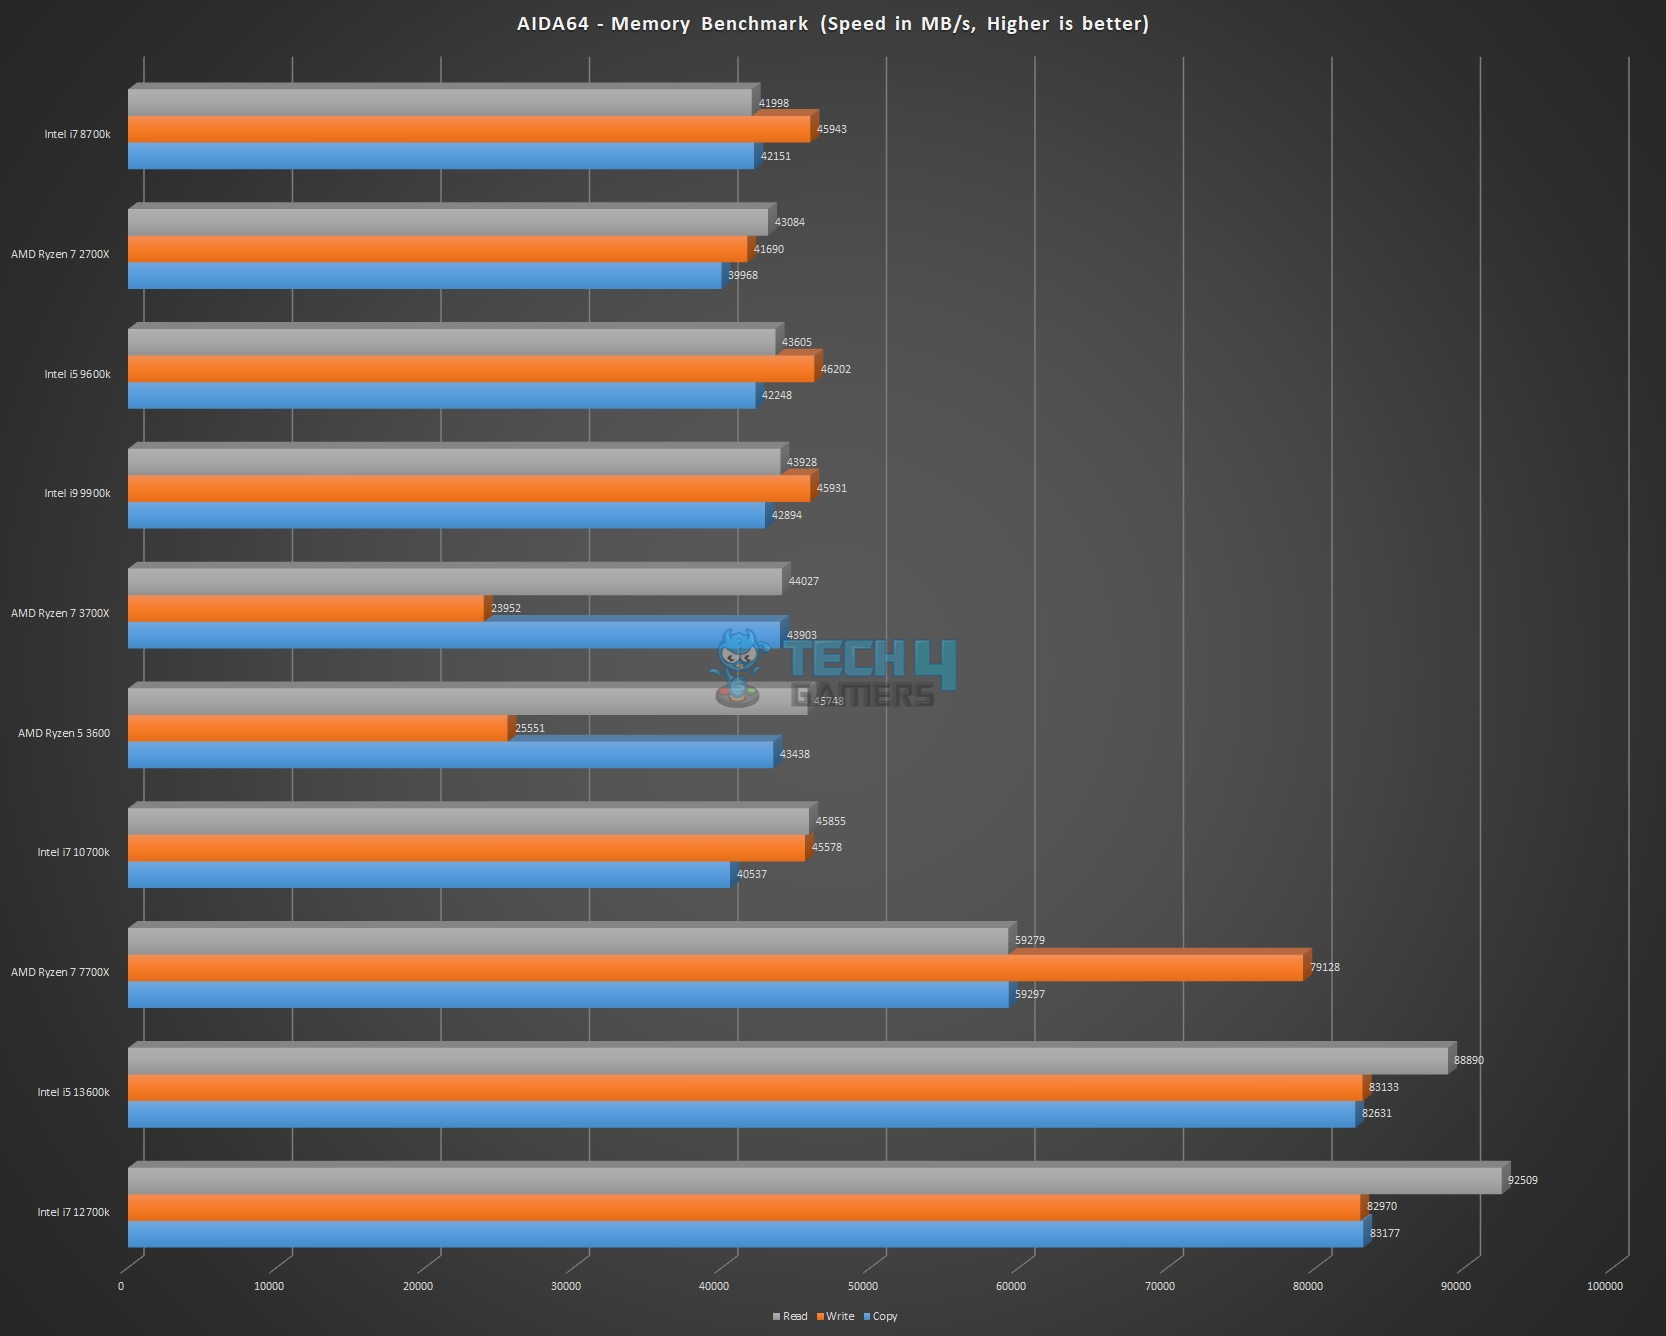
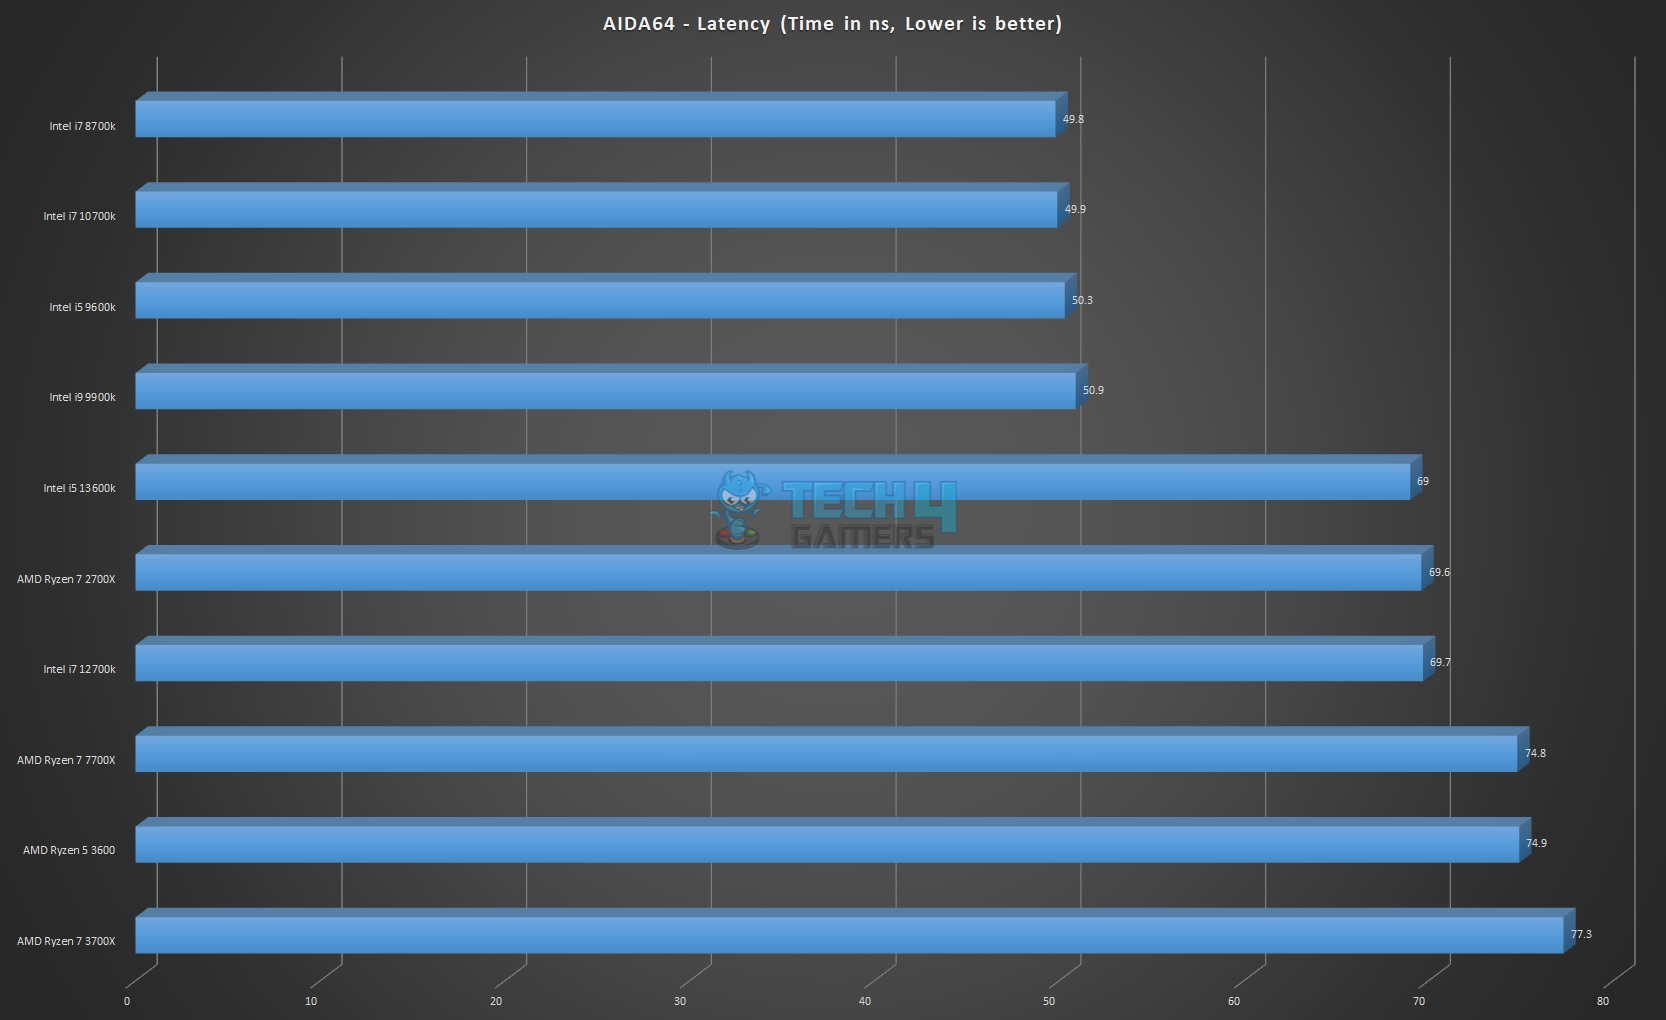
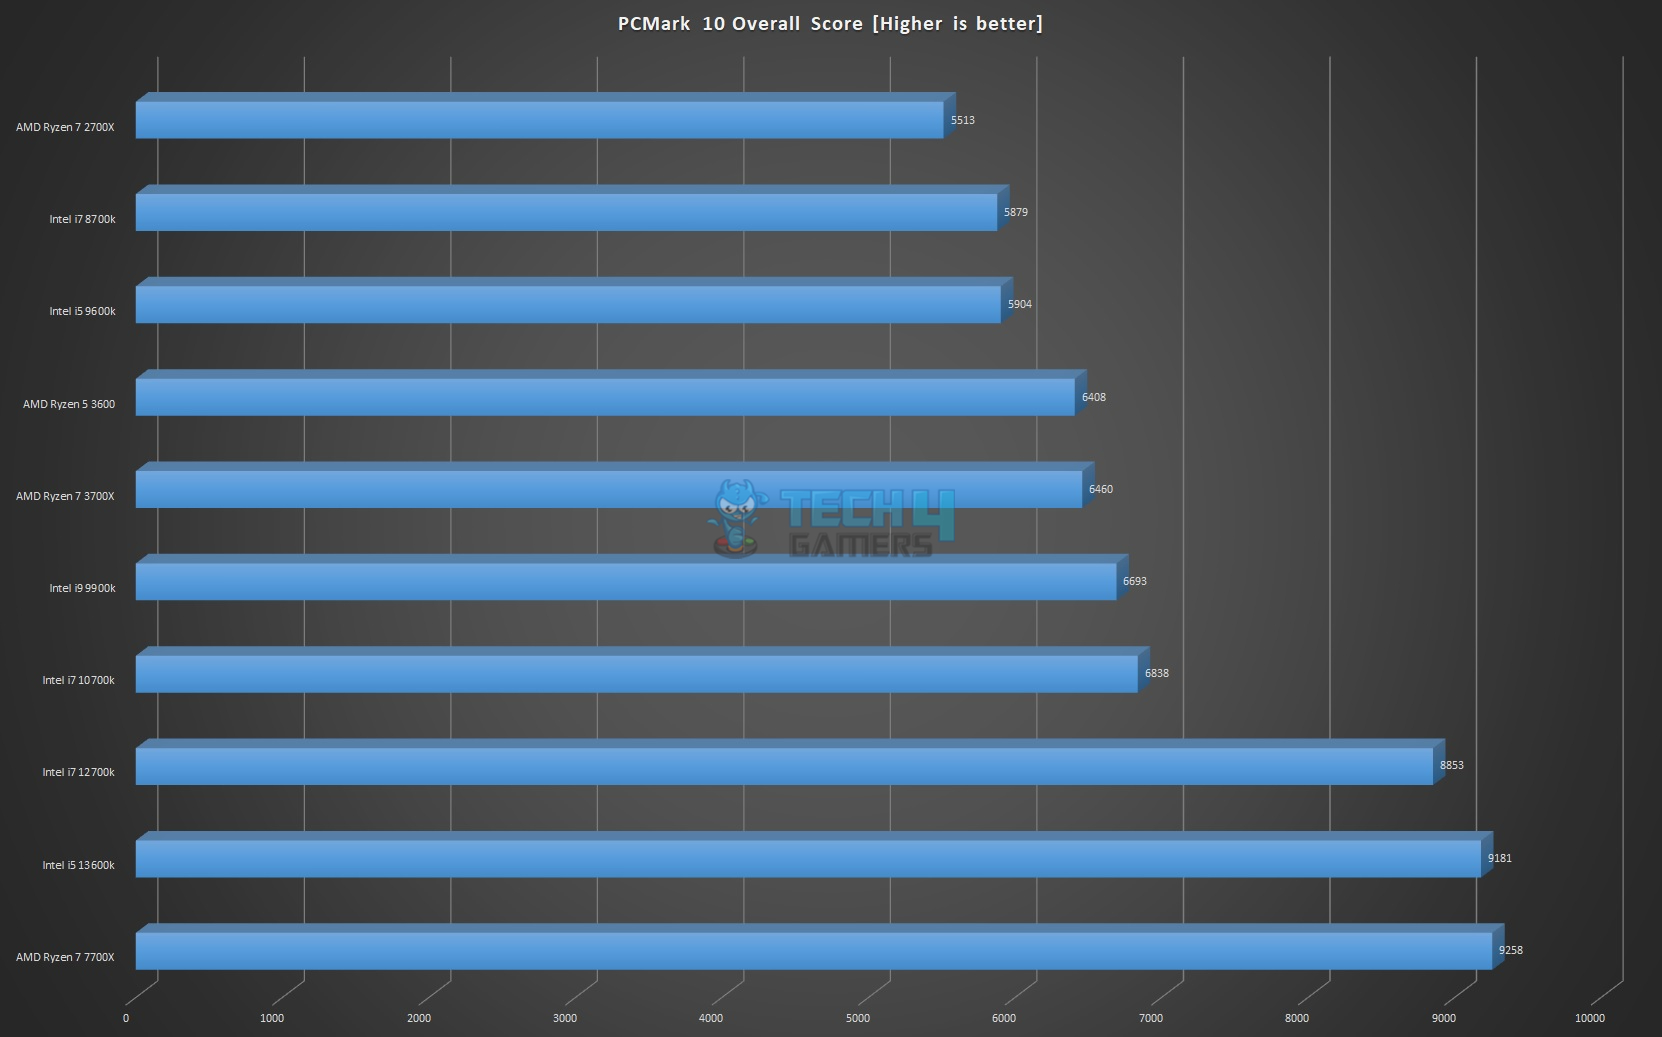
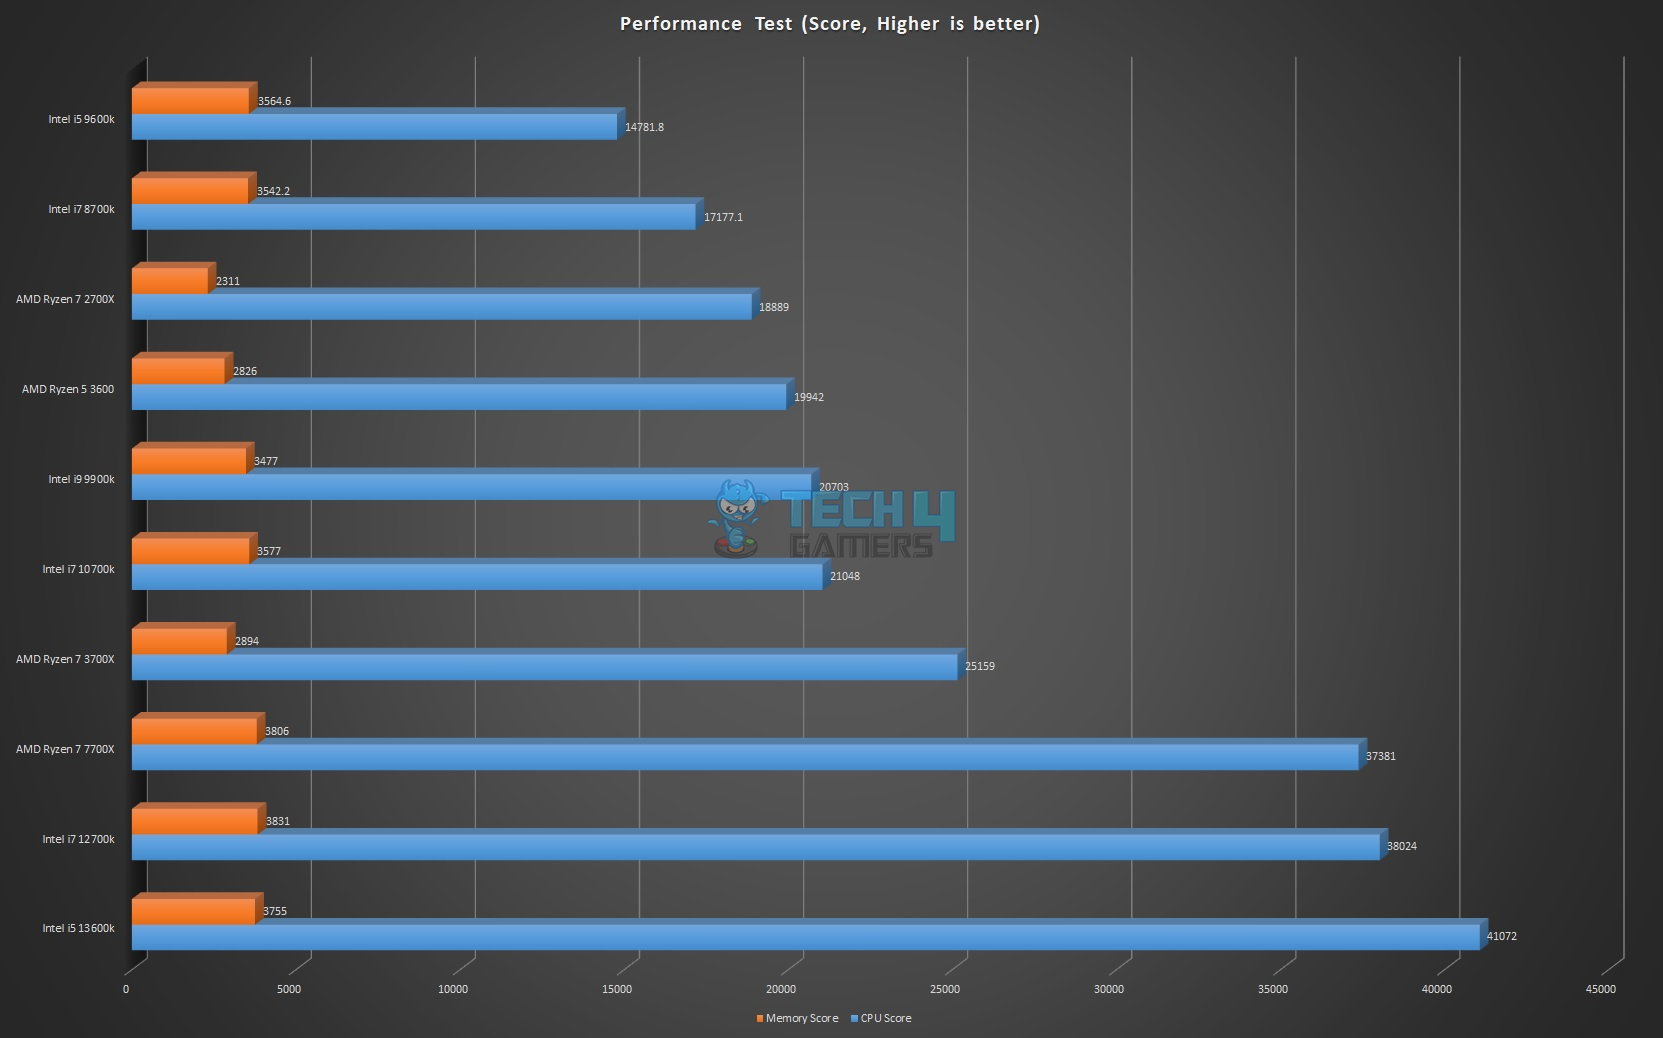
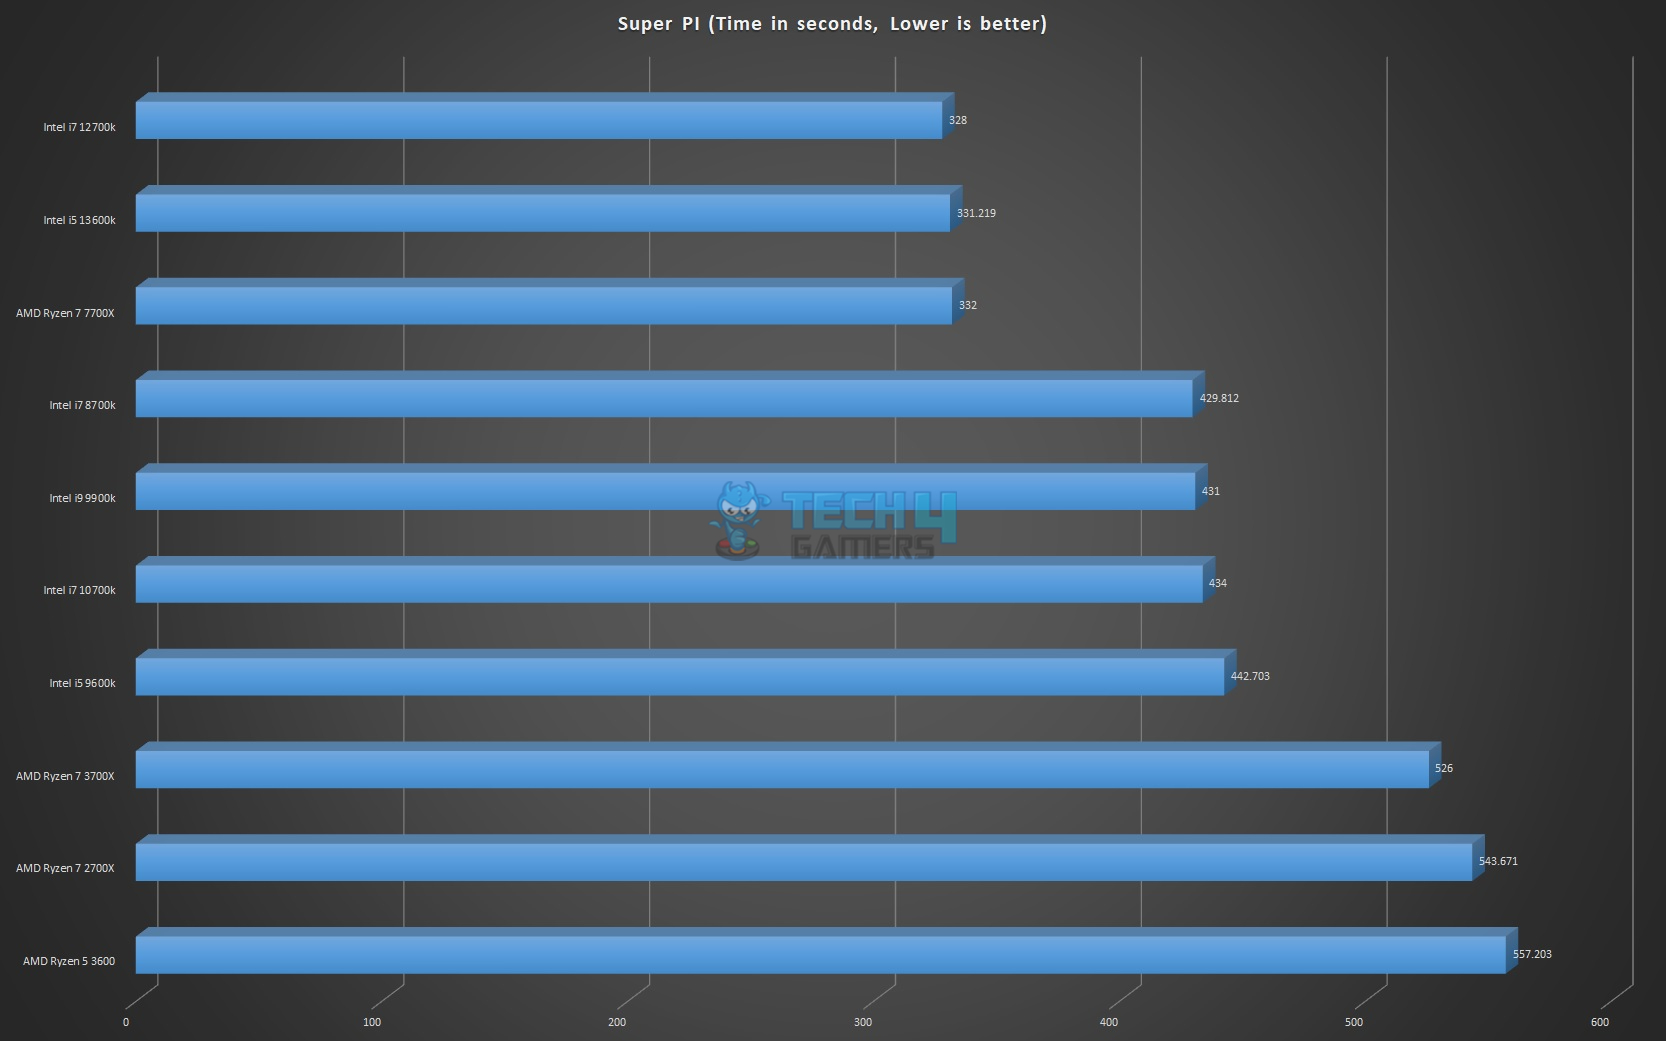
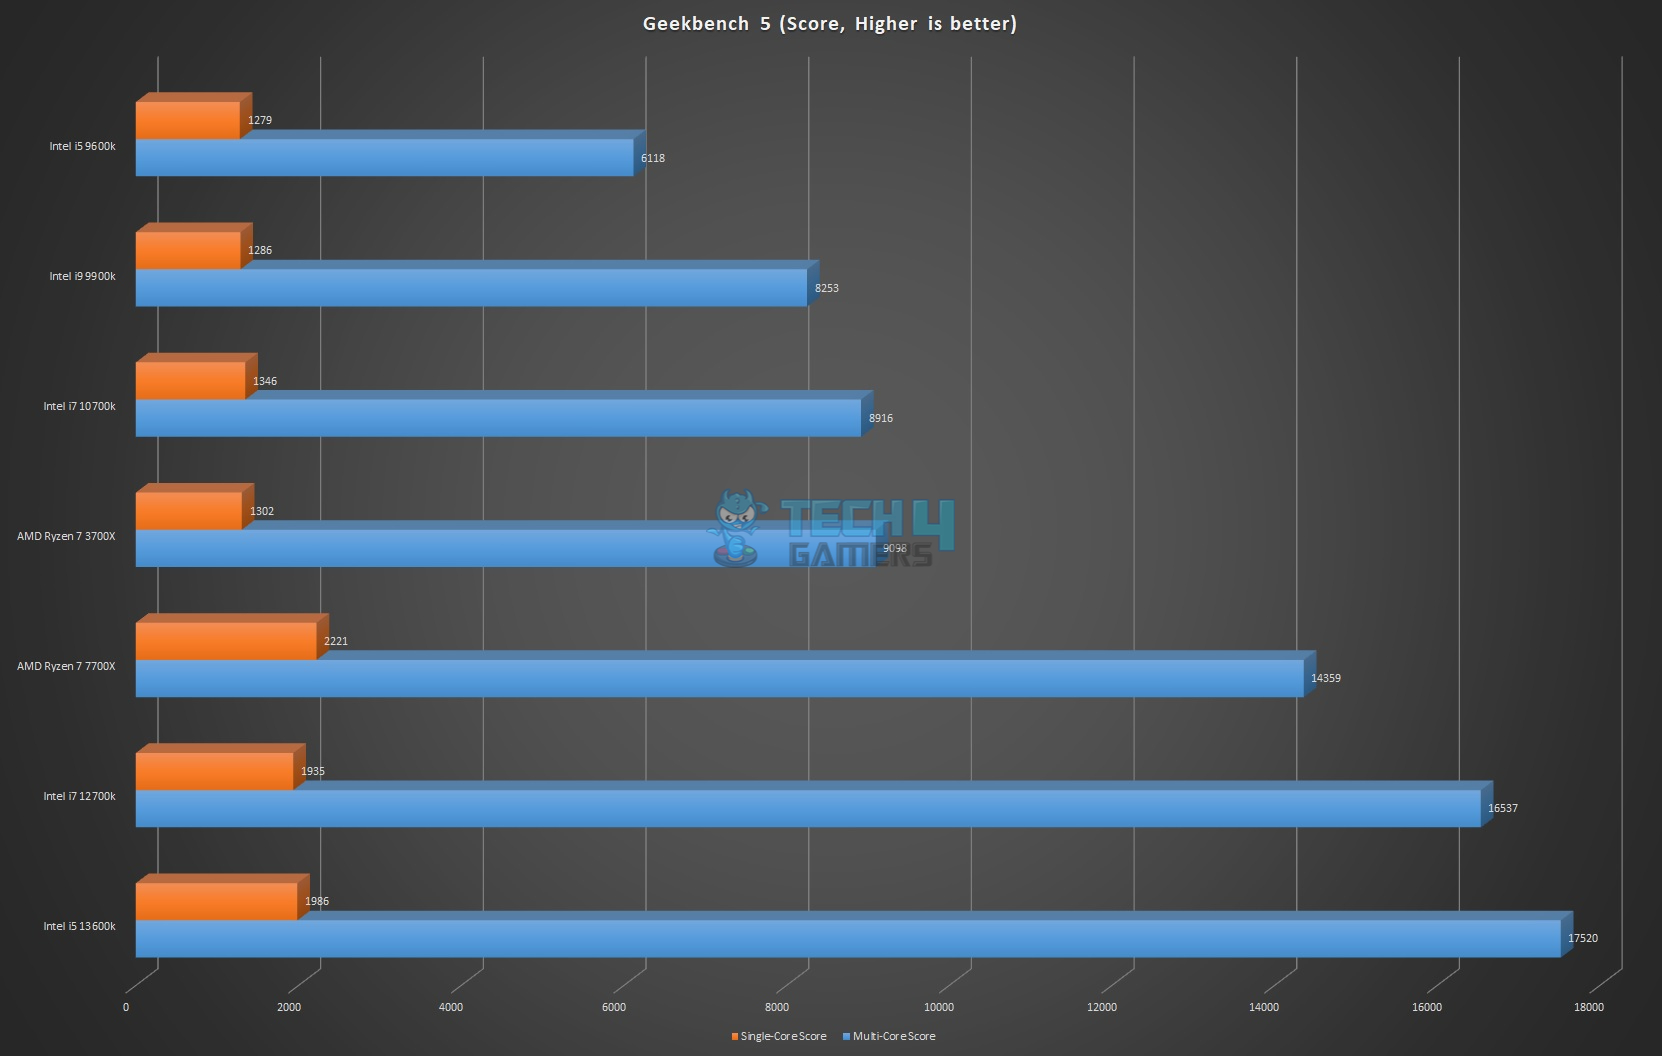
General Tests
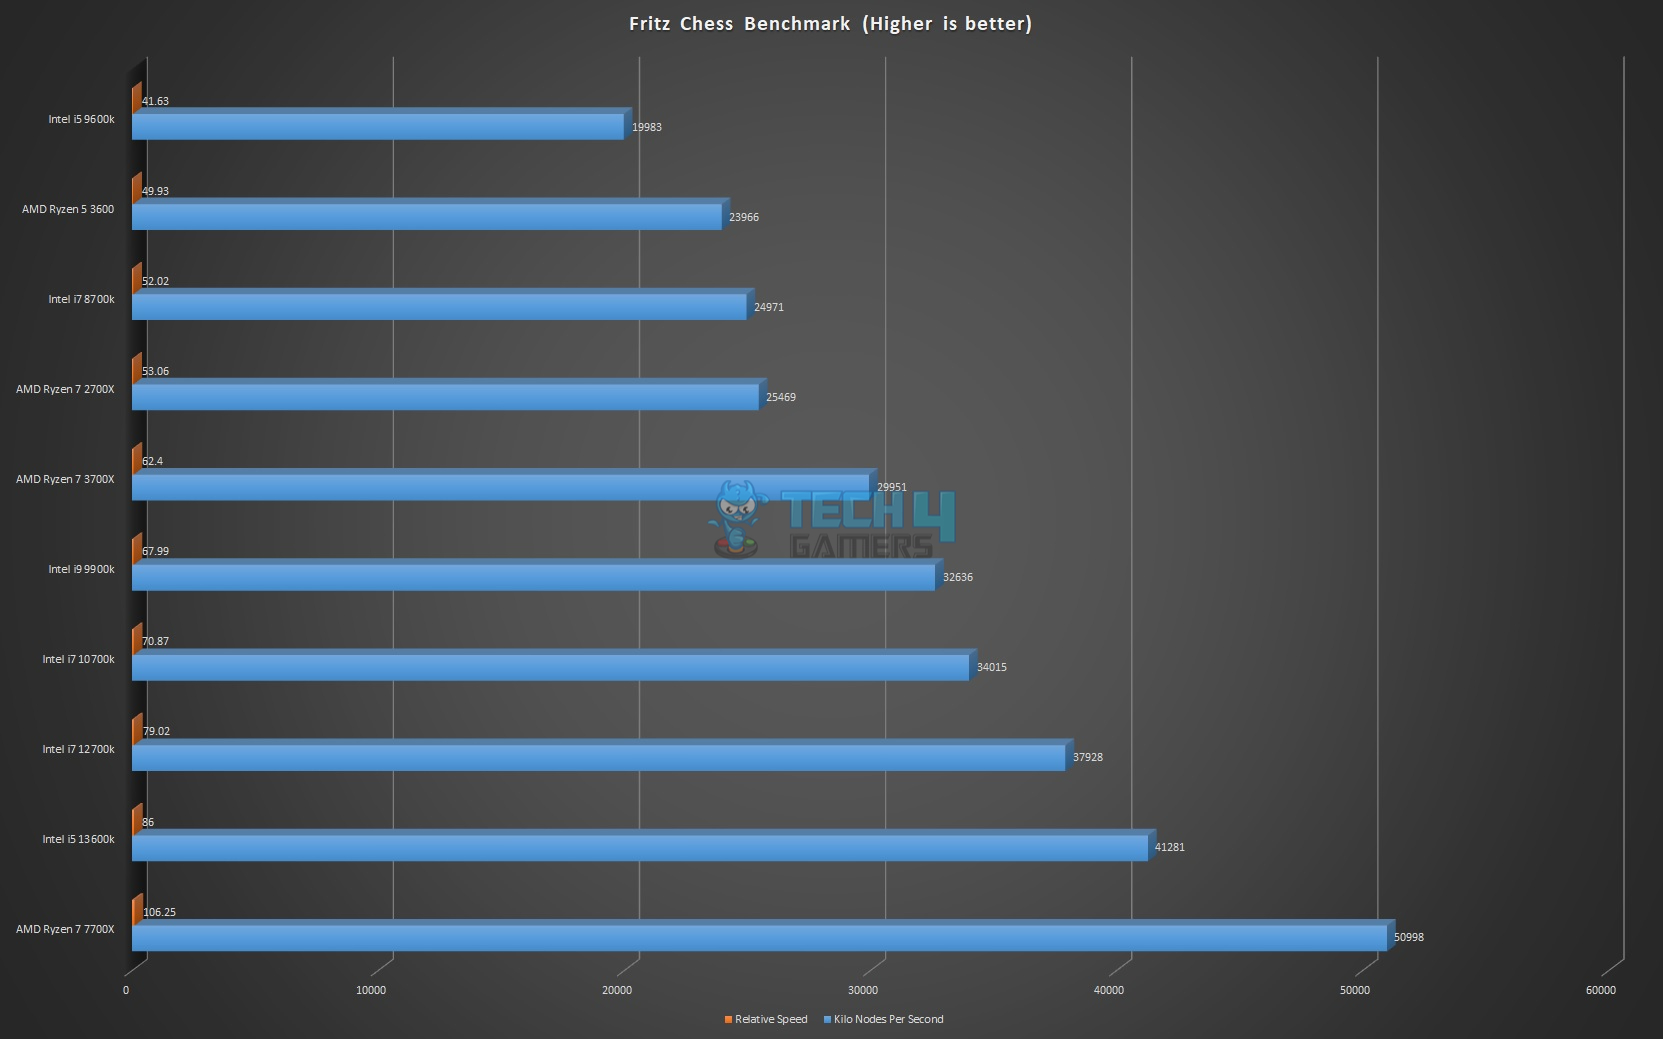
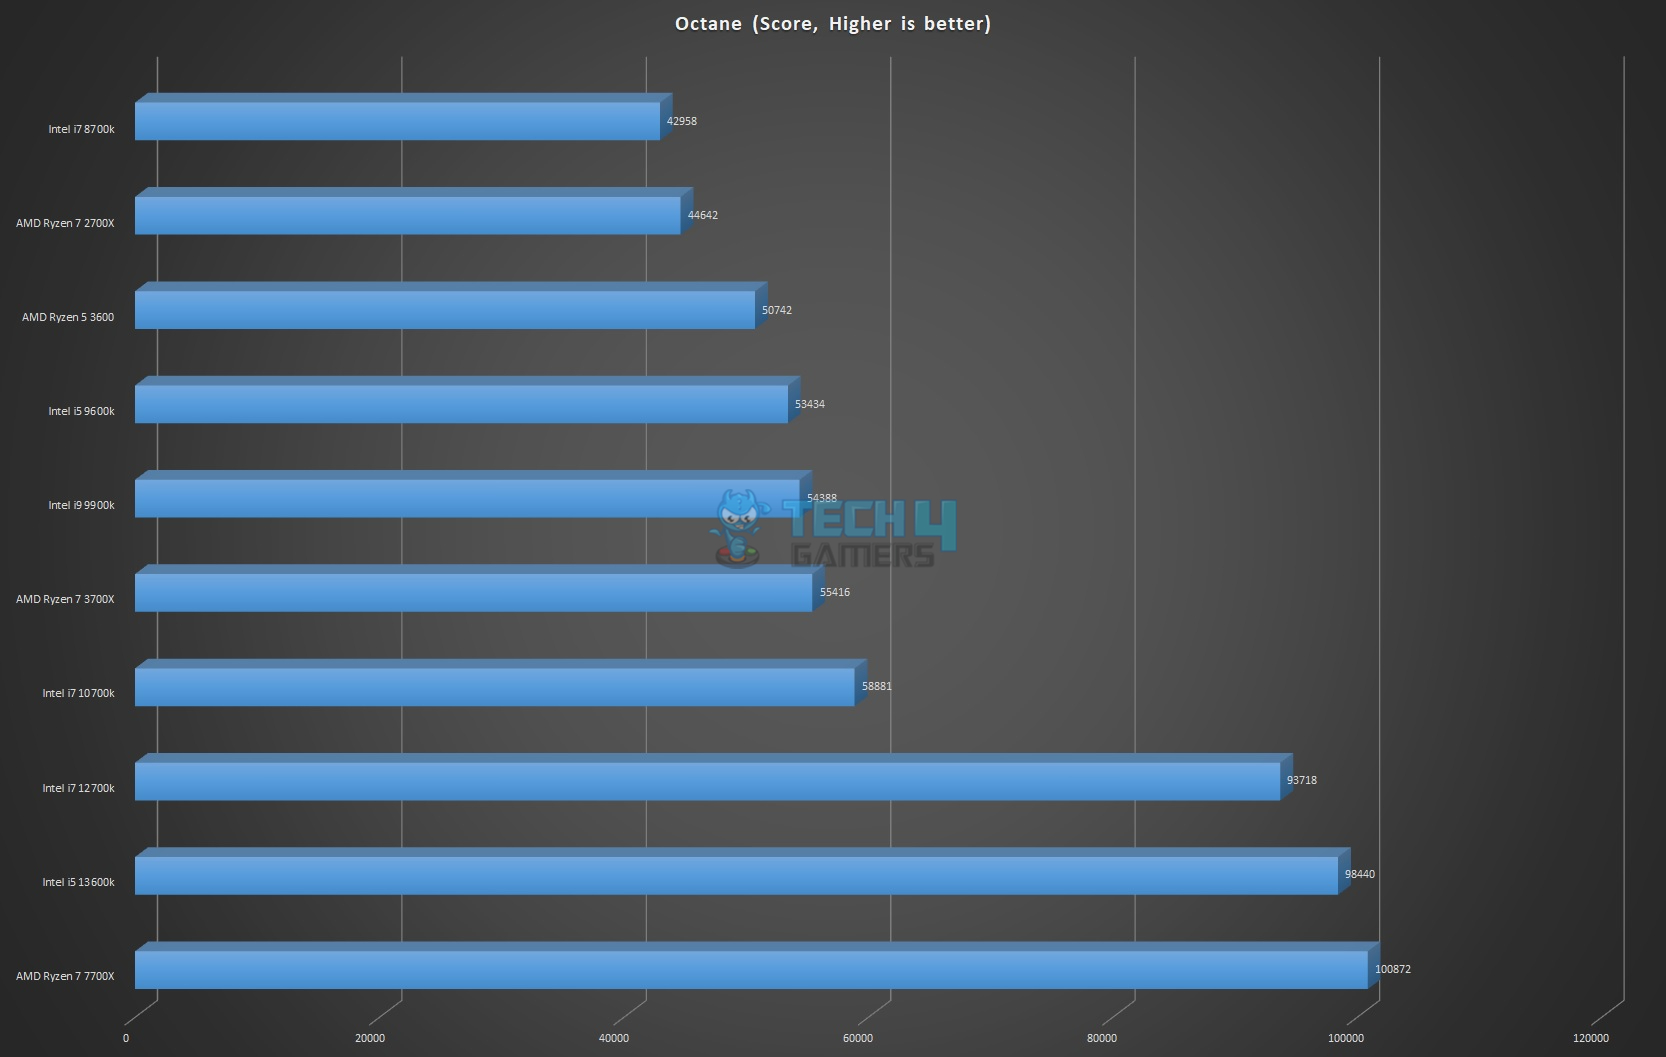
Let’s start with some general tests.
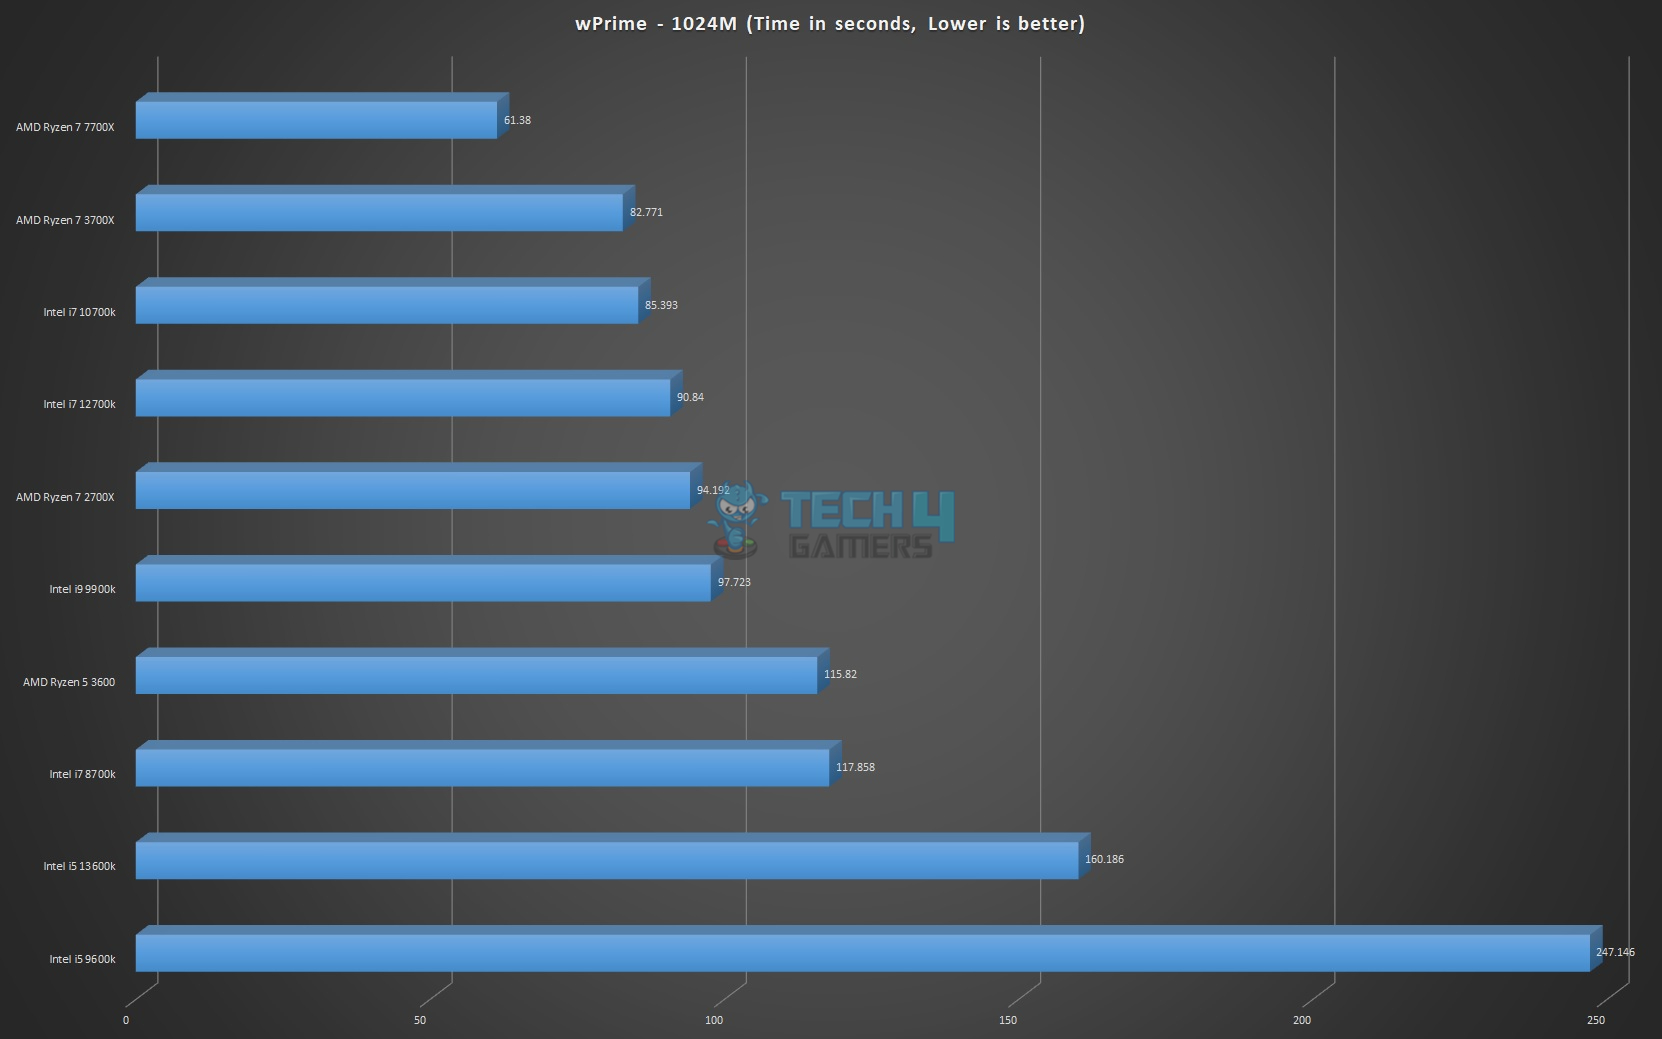
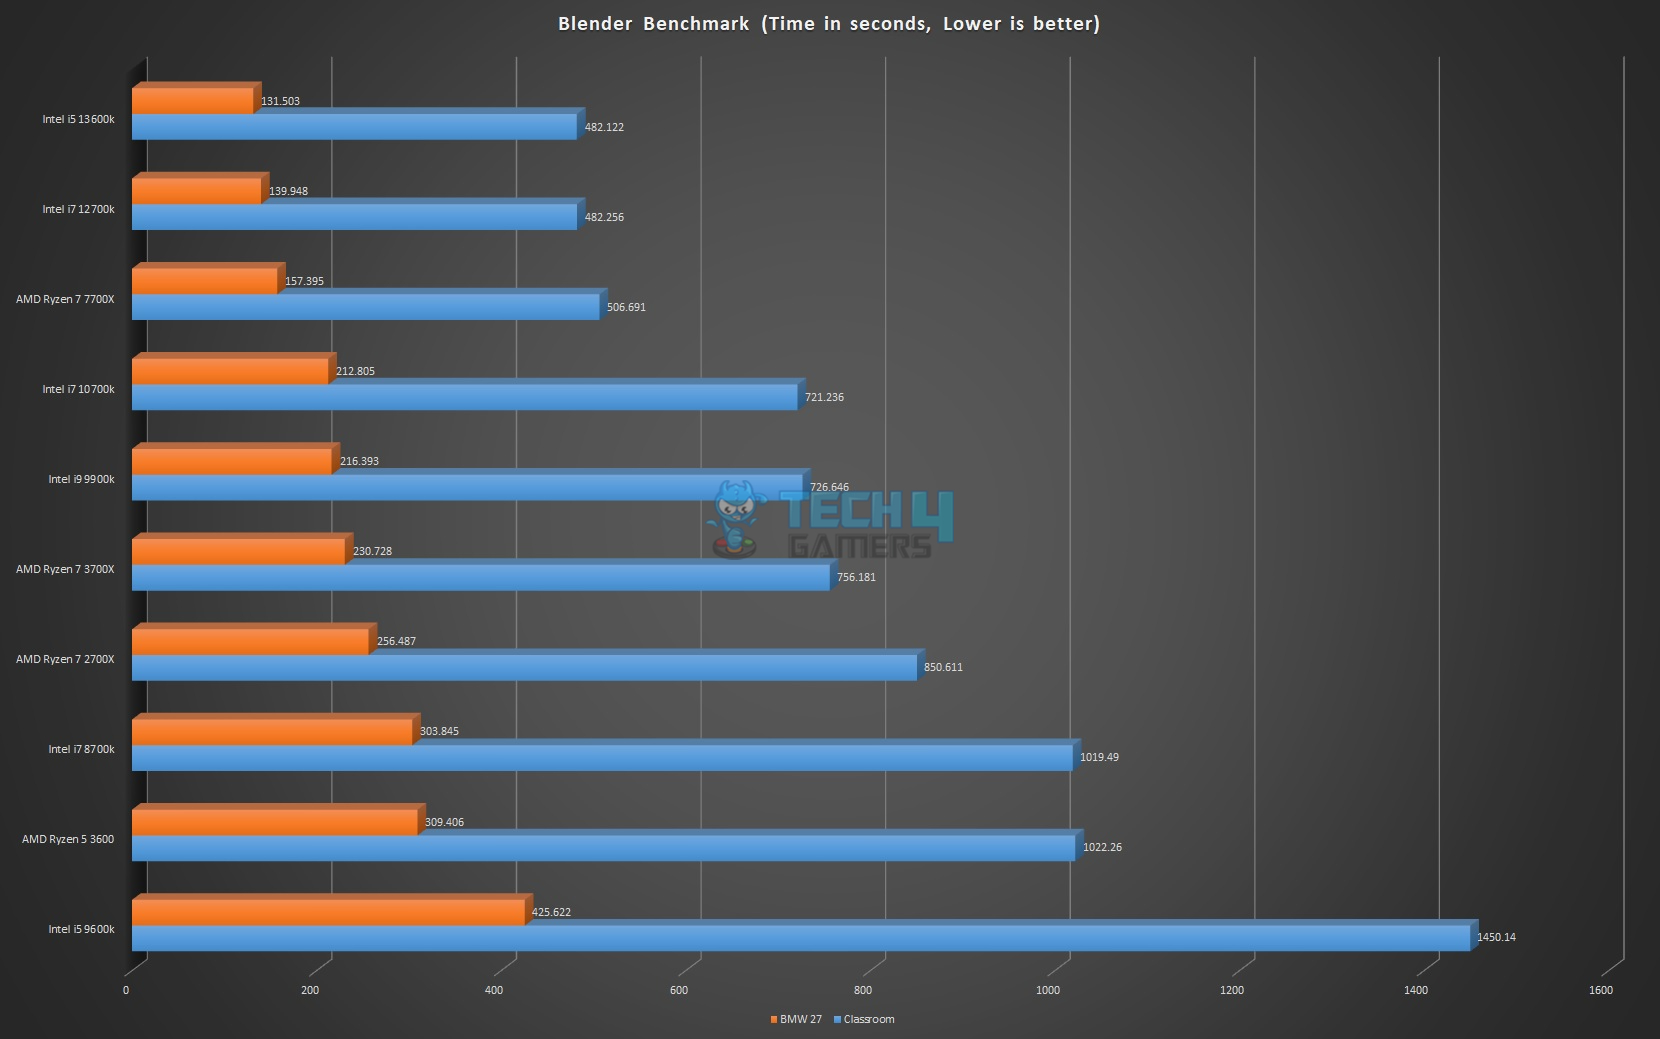
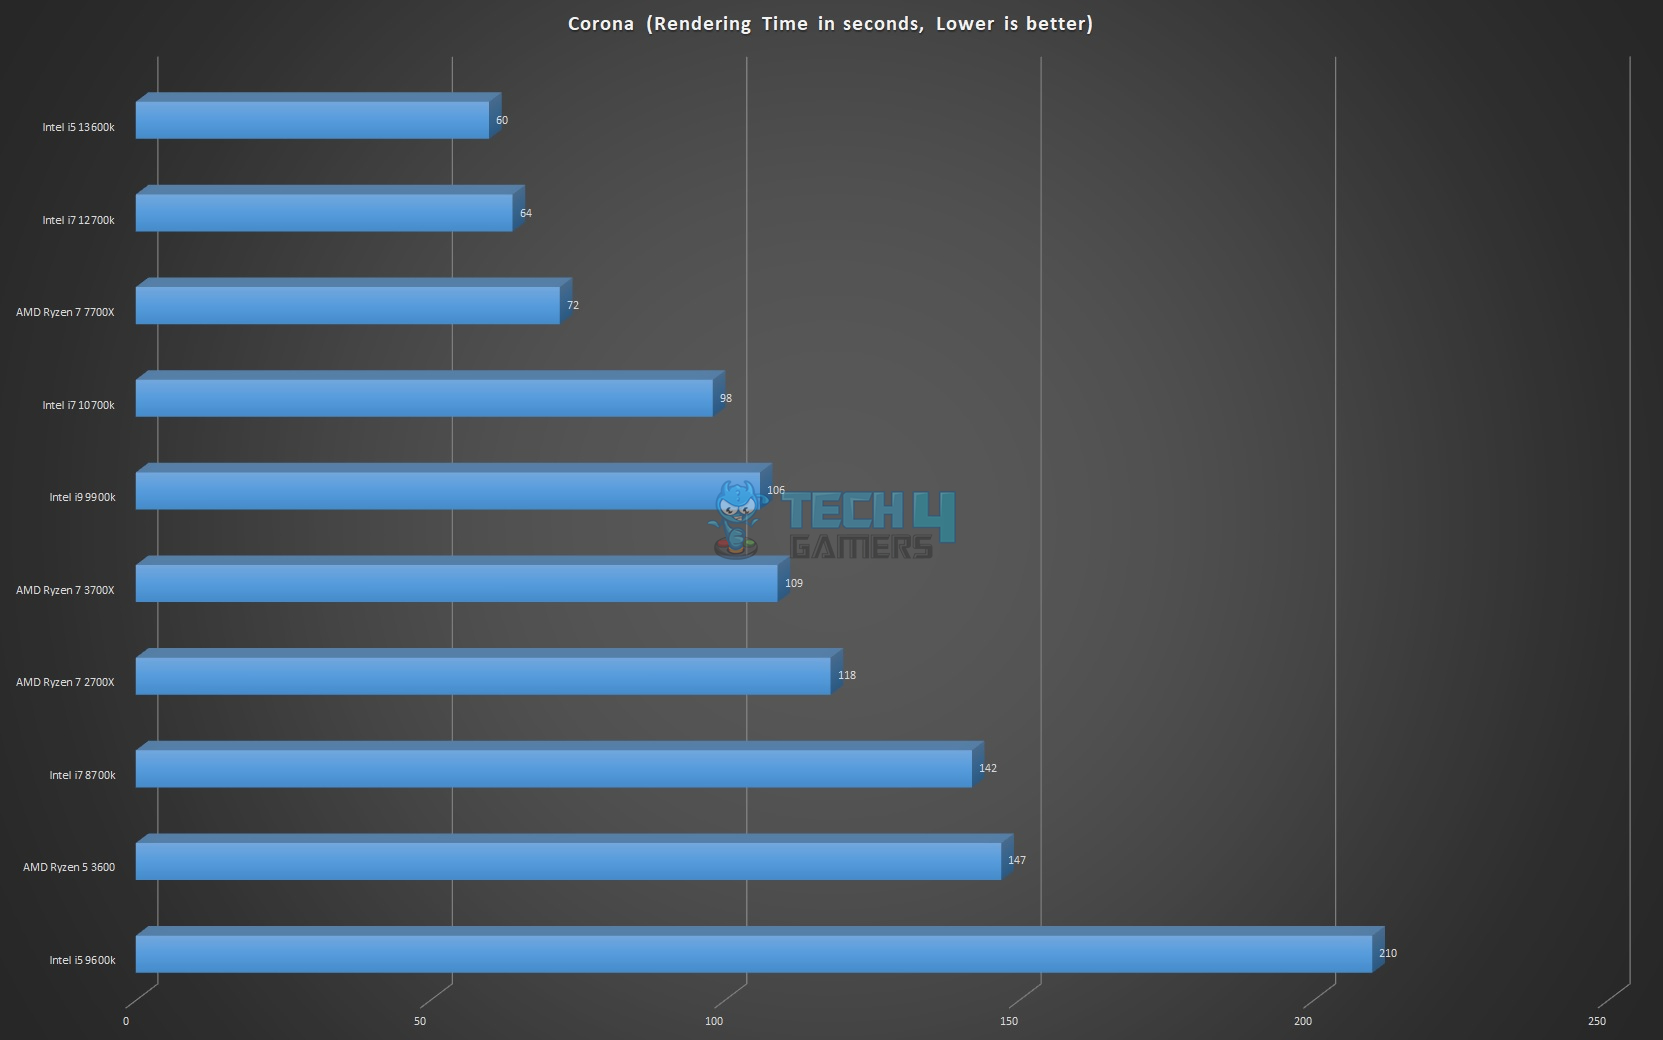
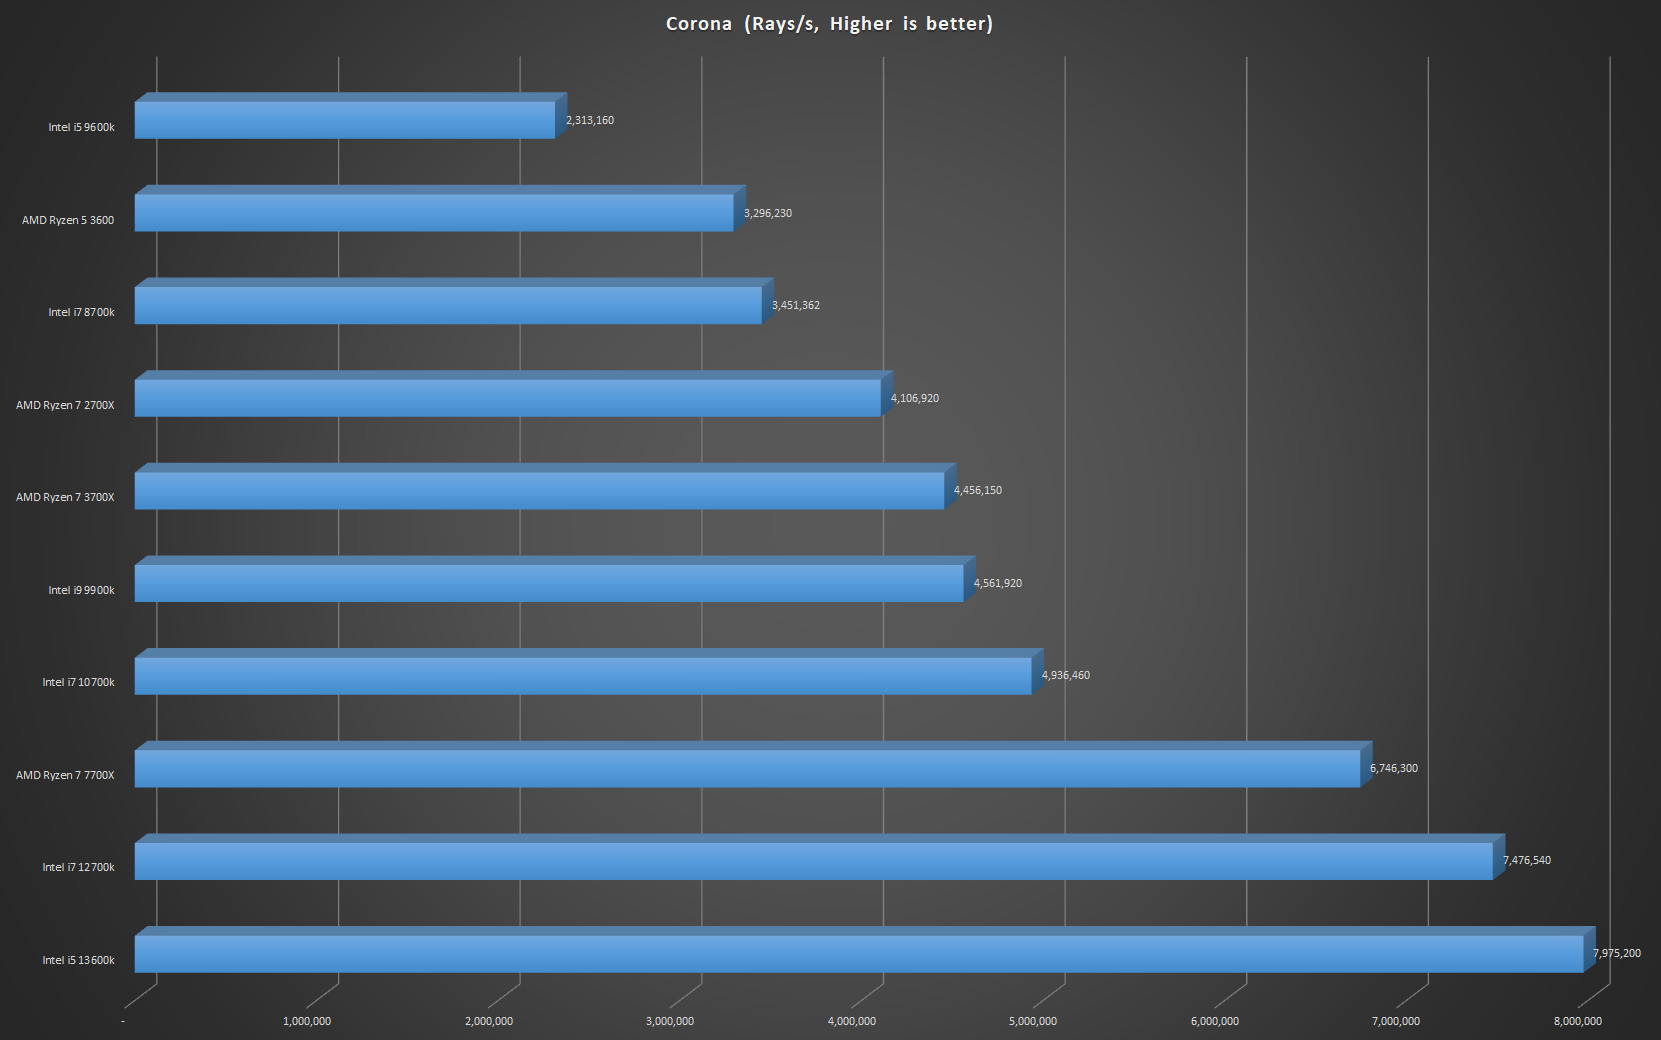
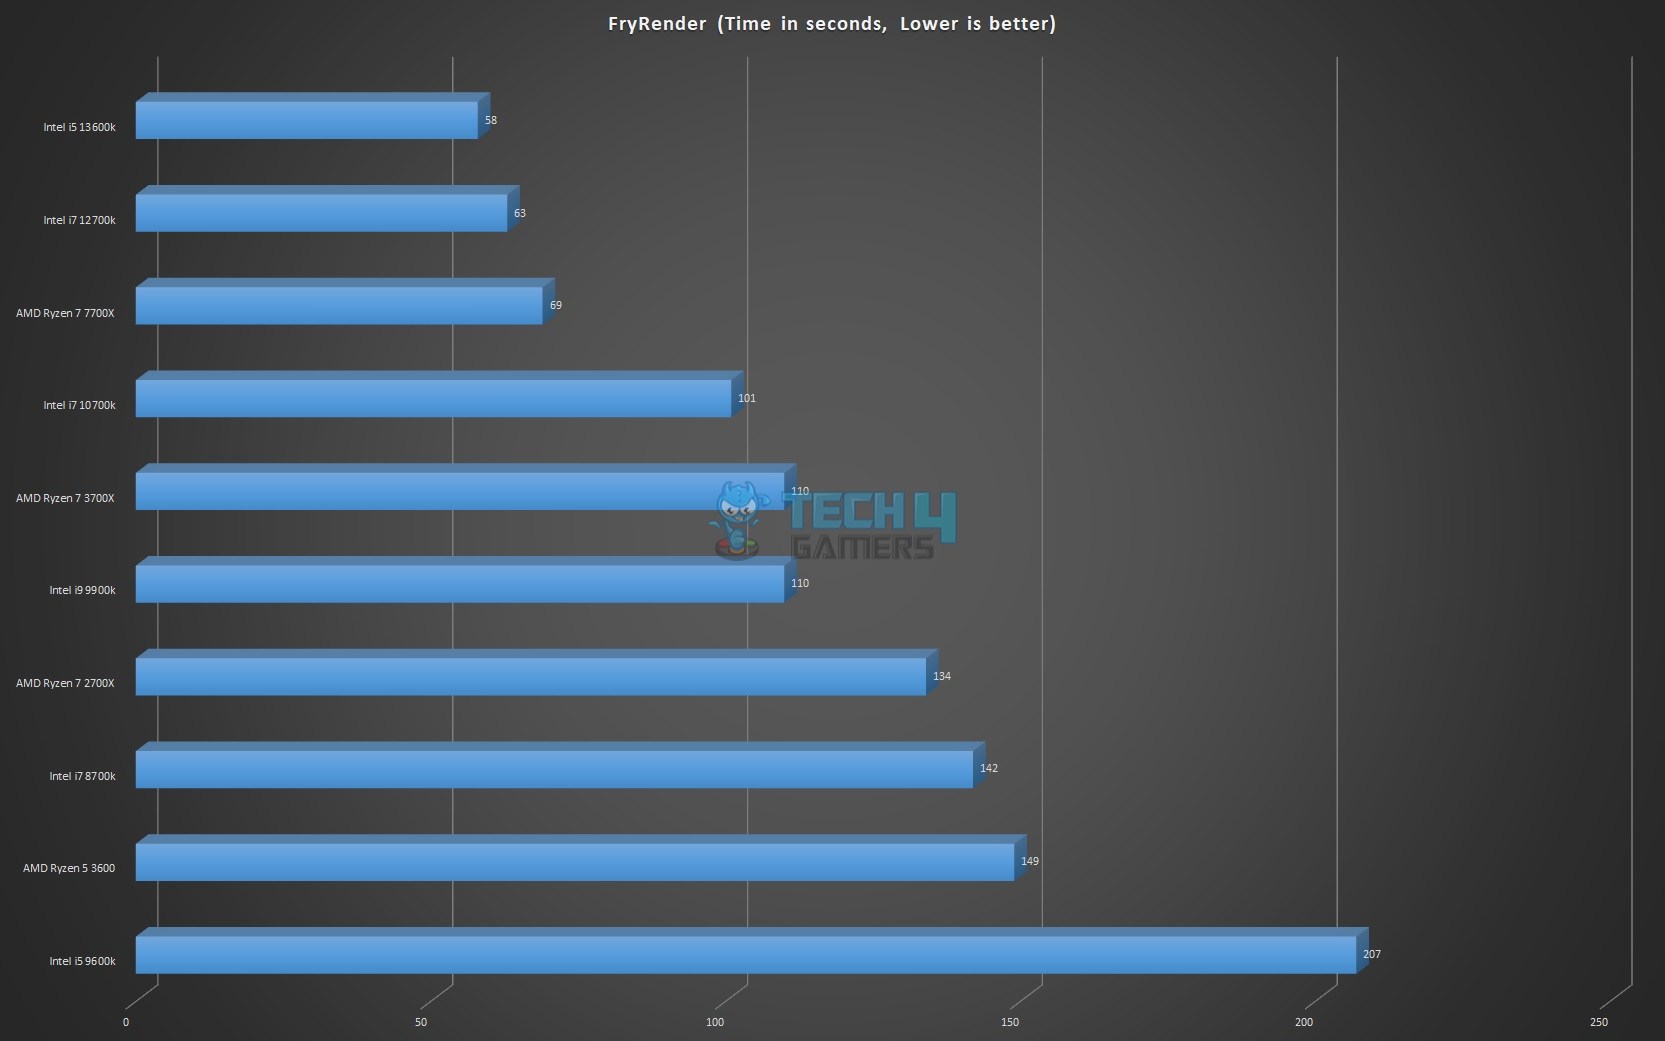
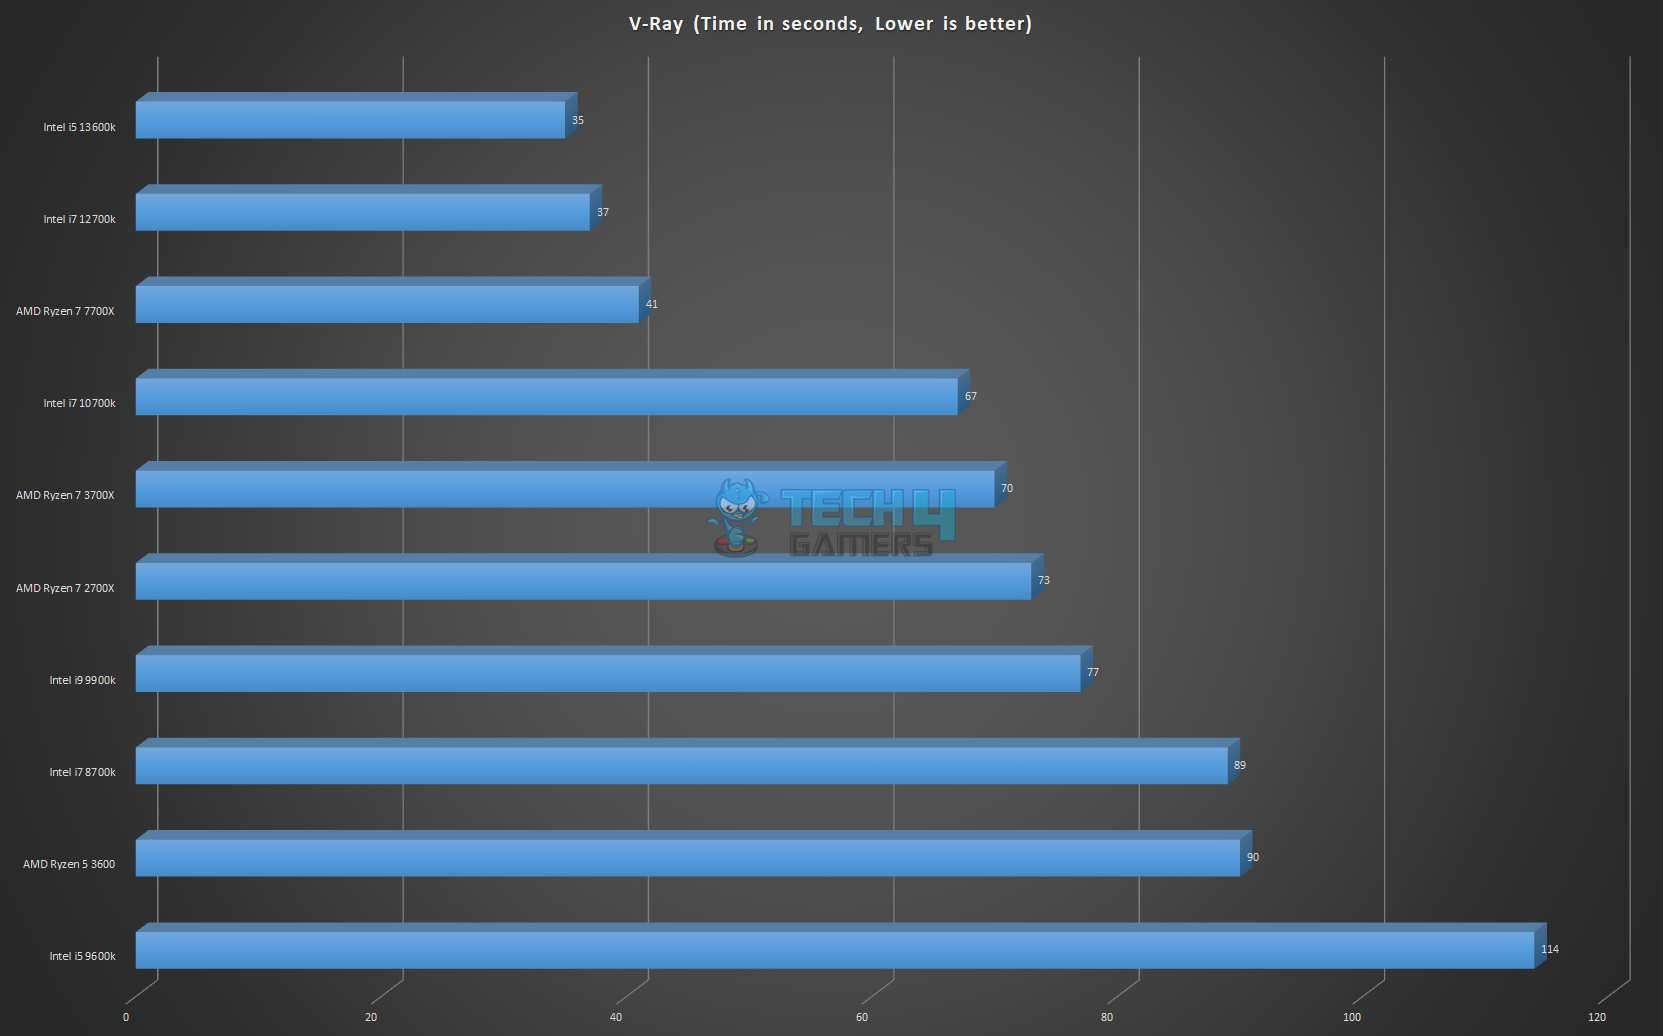
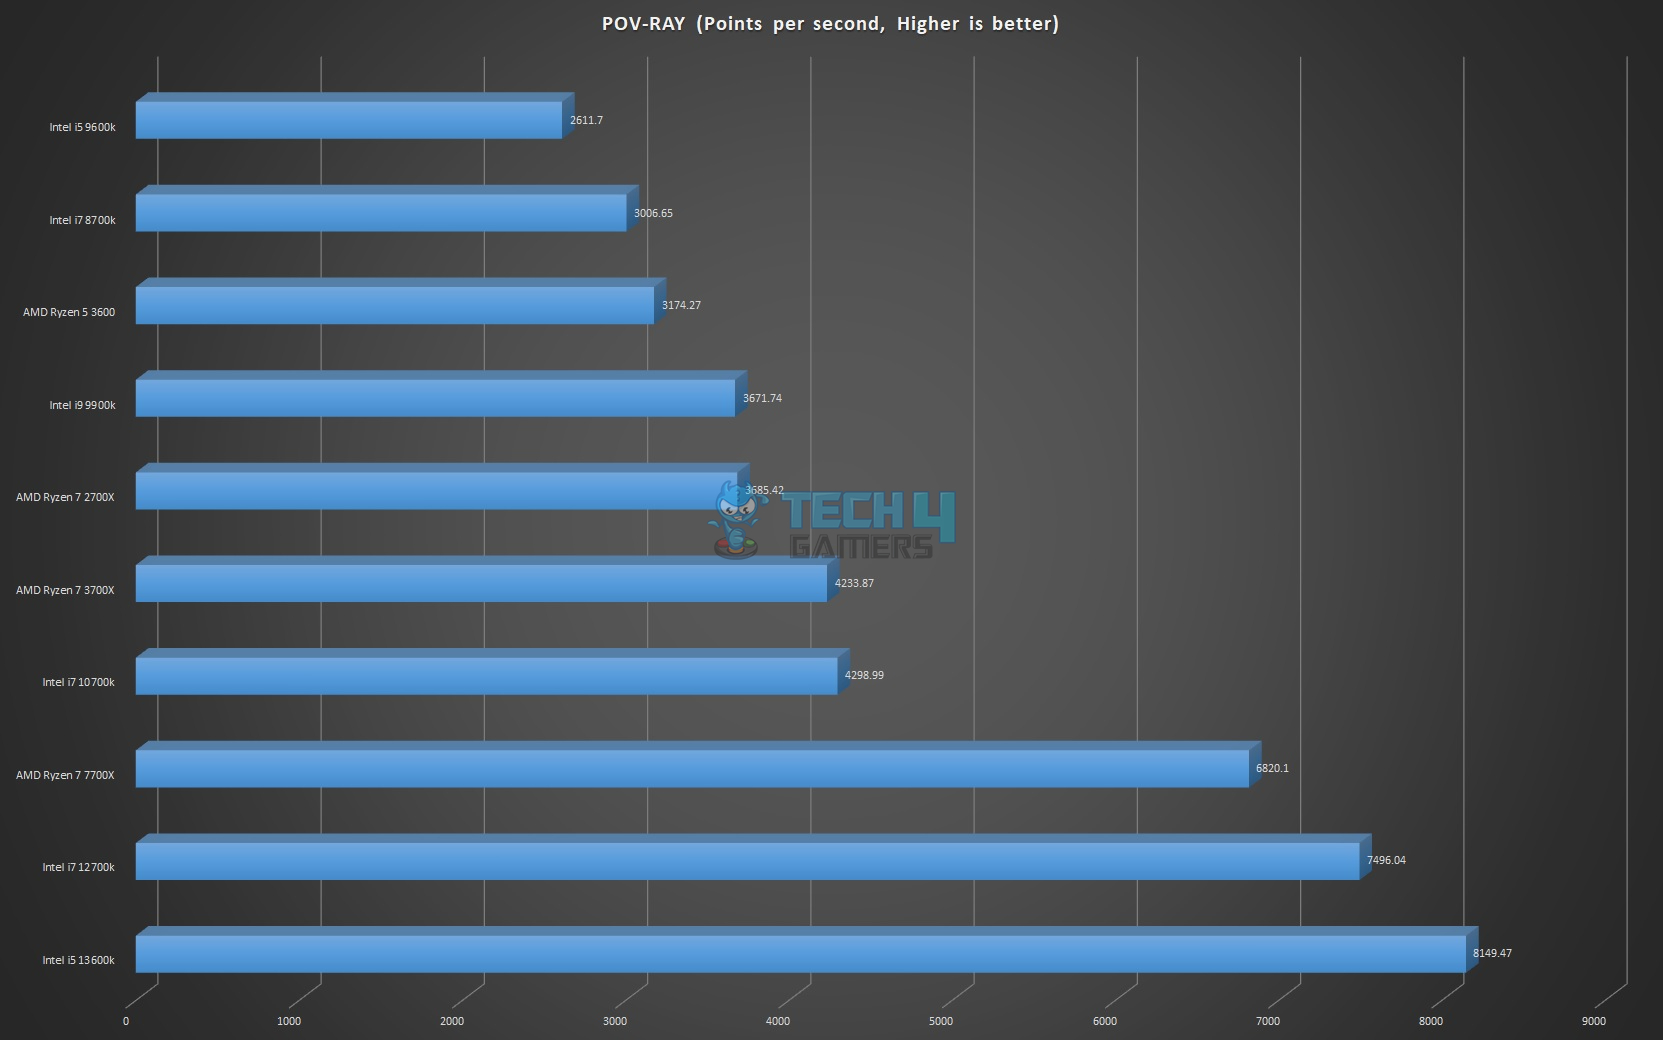
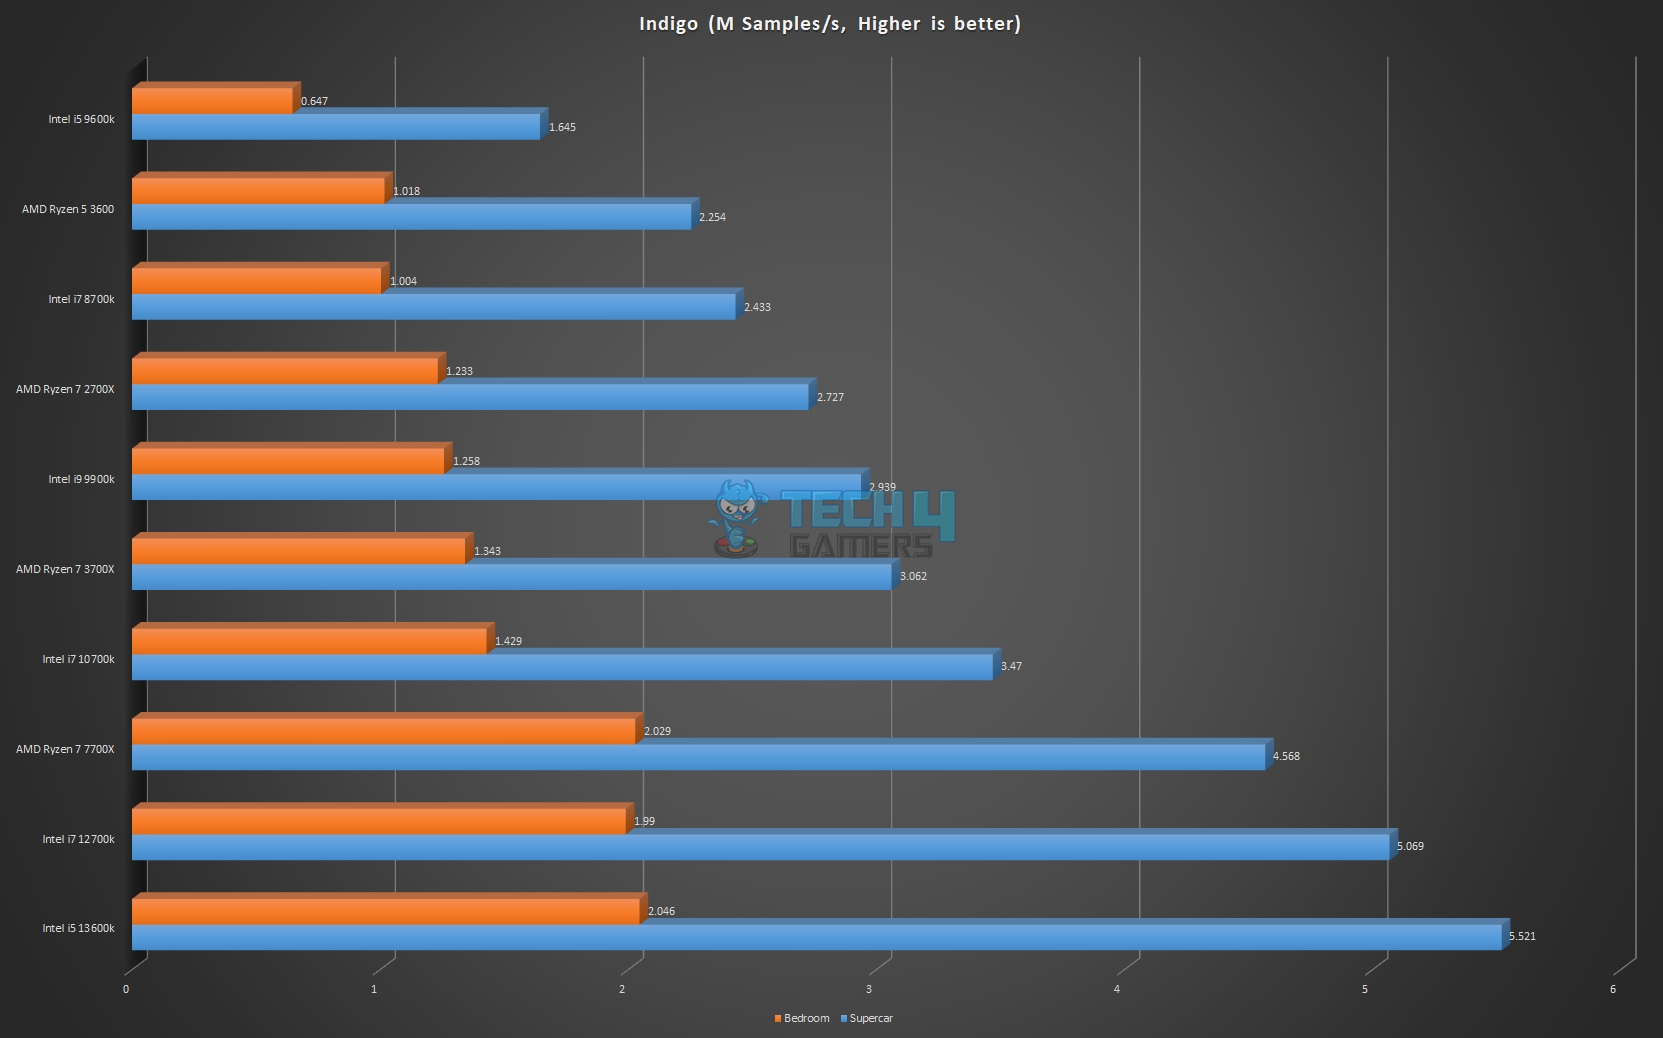
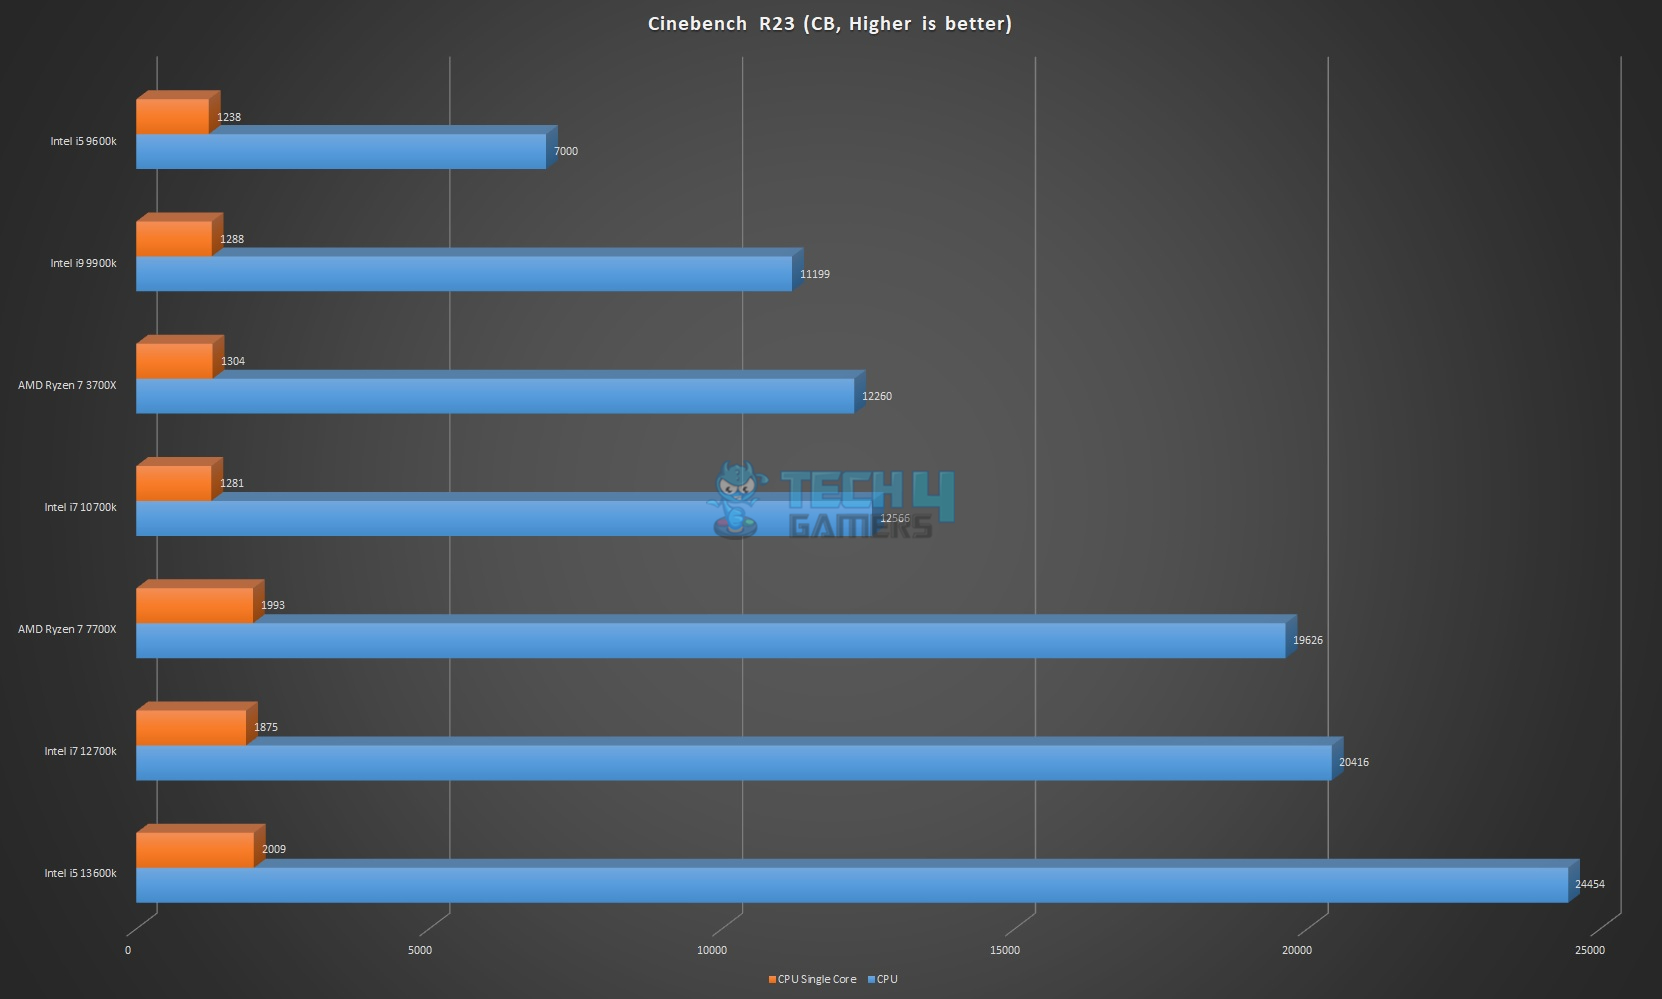
Rendering Tests
We have run multiple rendering tests for evaluation. The results of these tests are mostly the rendering time and frames per second unless stated otherwise. Lower time and higher FPS are what we are looking for.
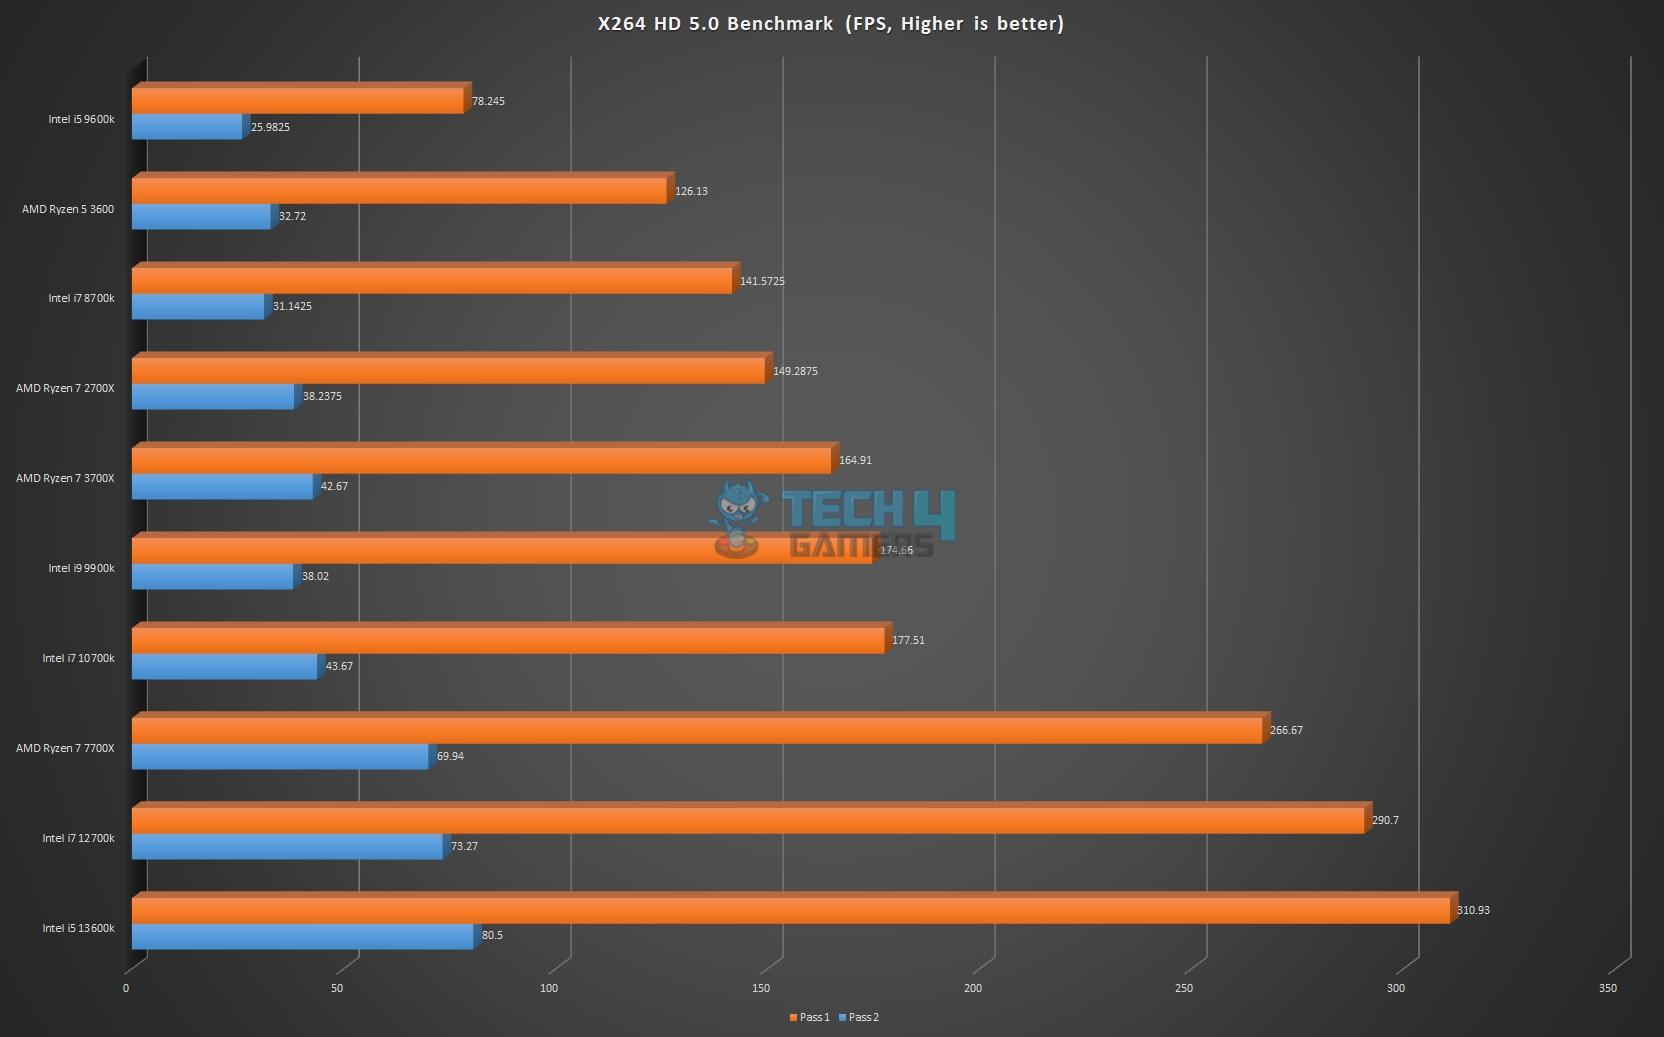
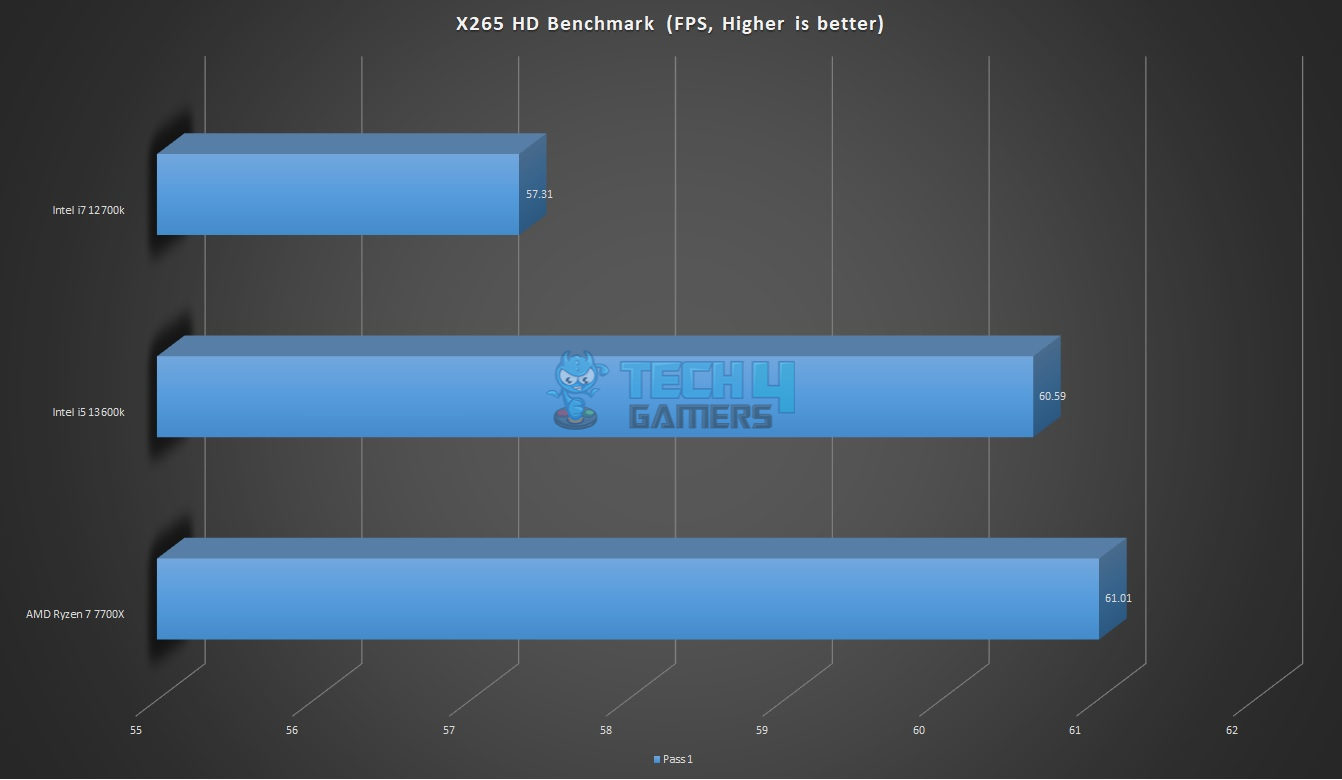
Transcoding
We have used X264 HD and X265 HD Benchmarks to measure the transcoding performance of the CPU.
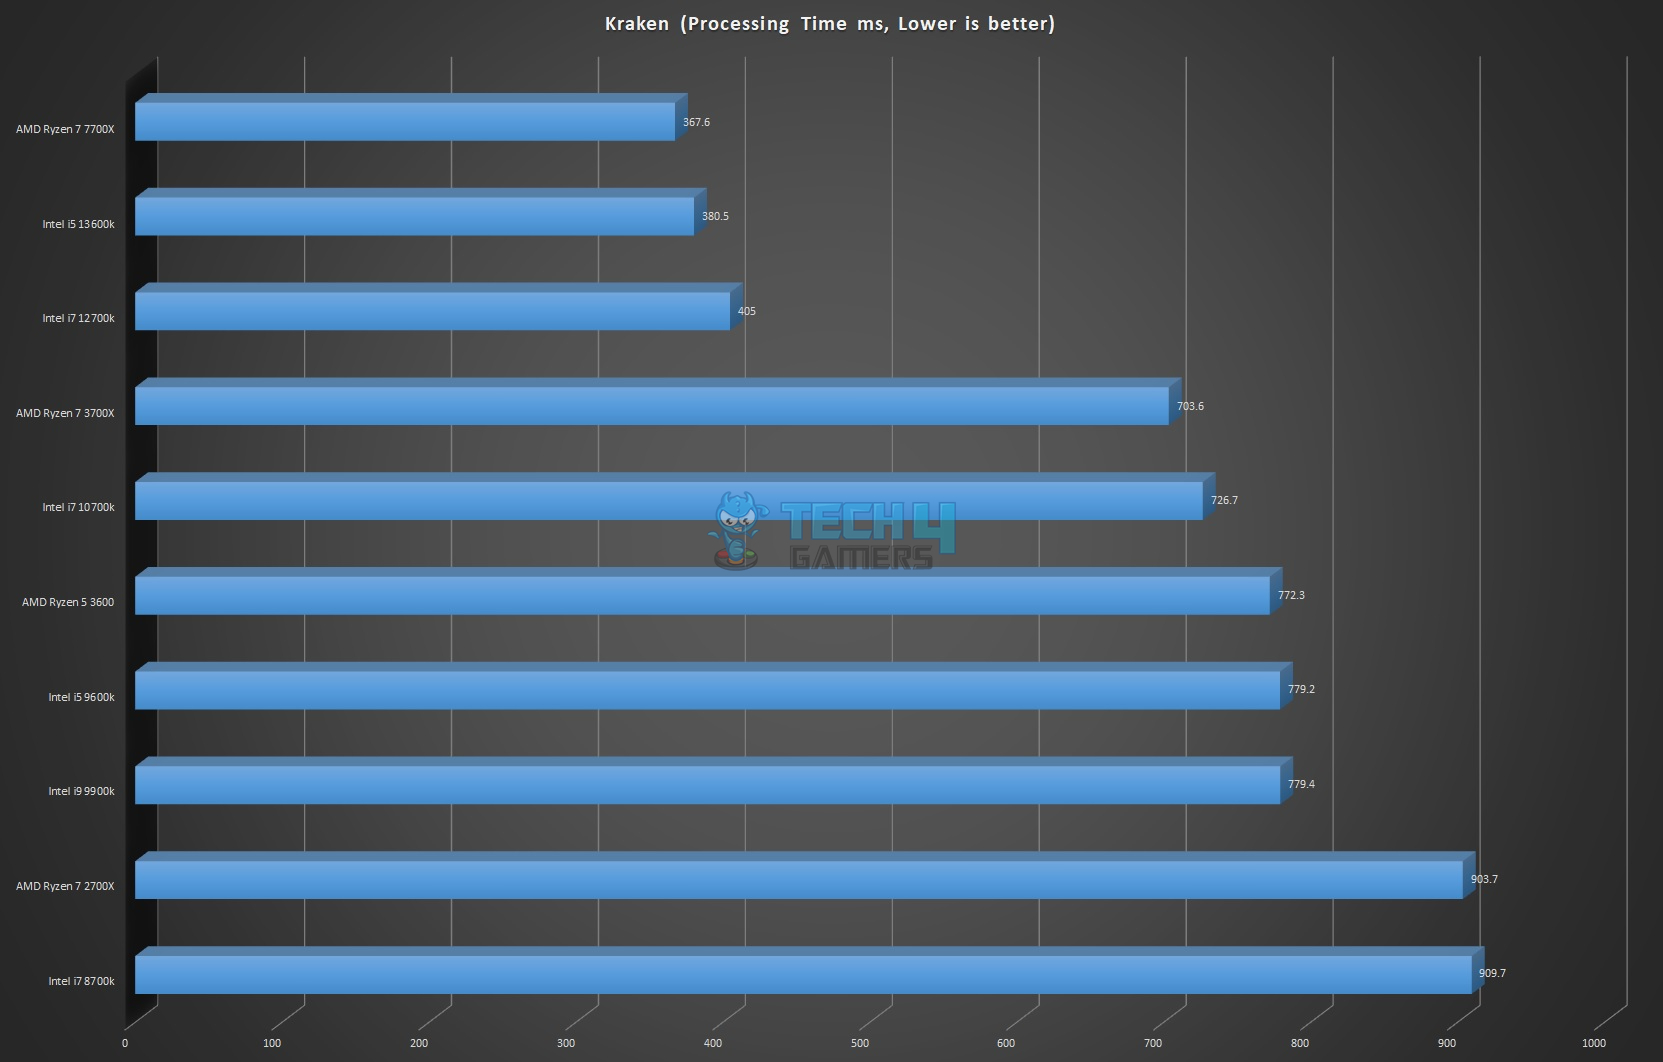
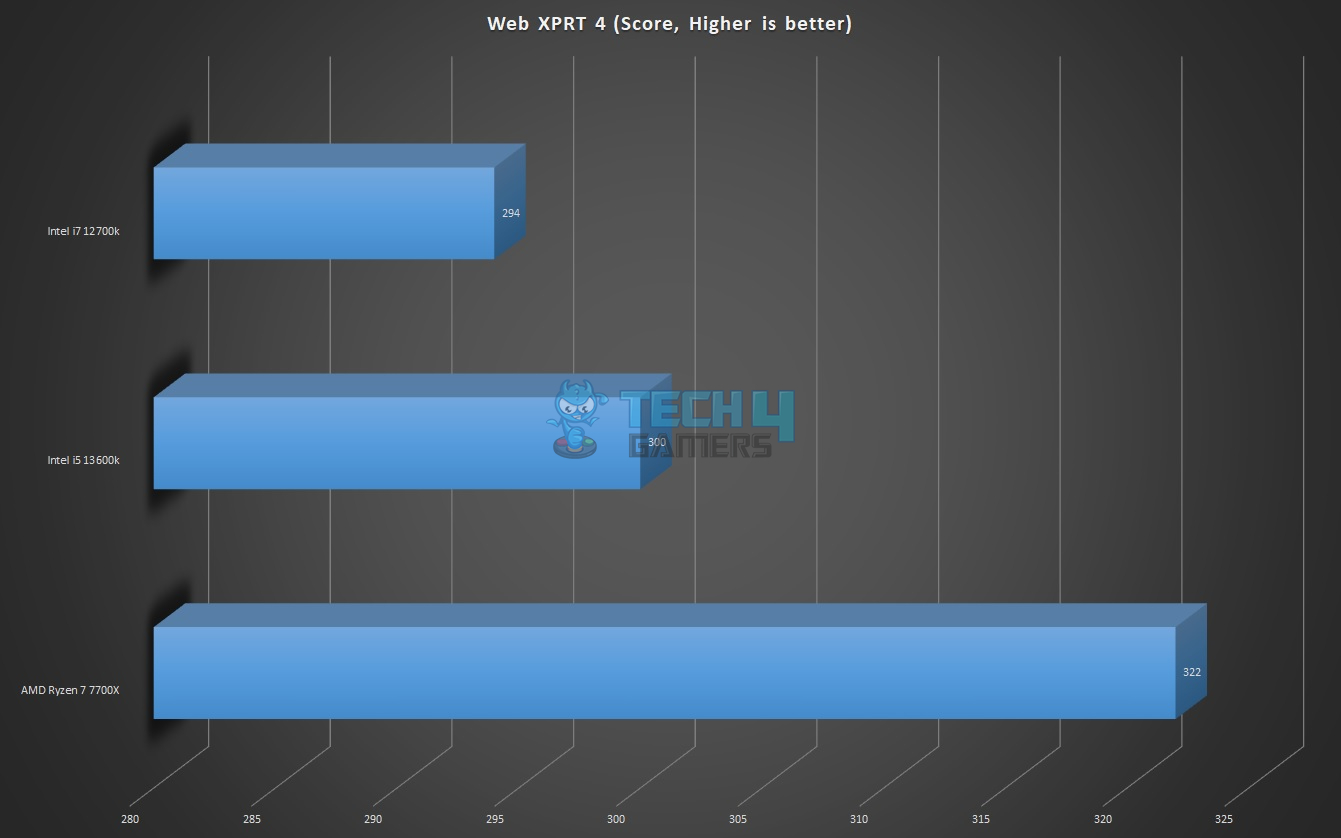
Web-based Benchmarks
Just to give an idea of how the CPUs impact general web browsing, we ran a few benchmarks.
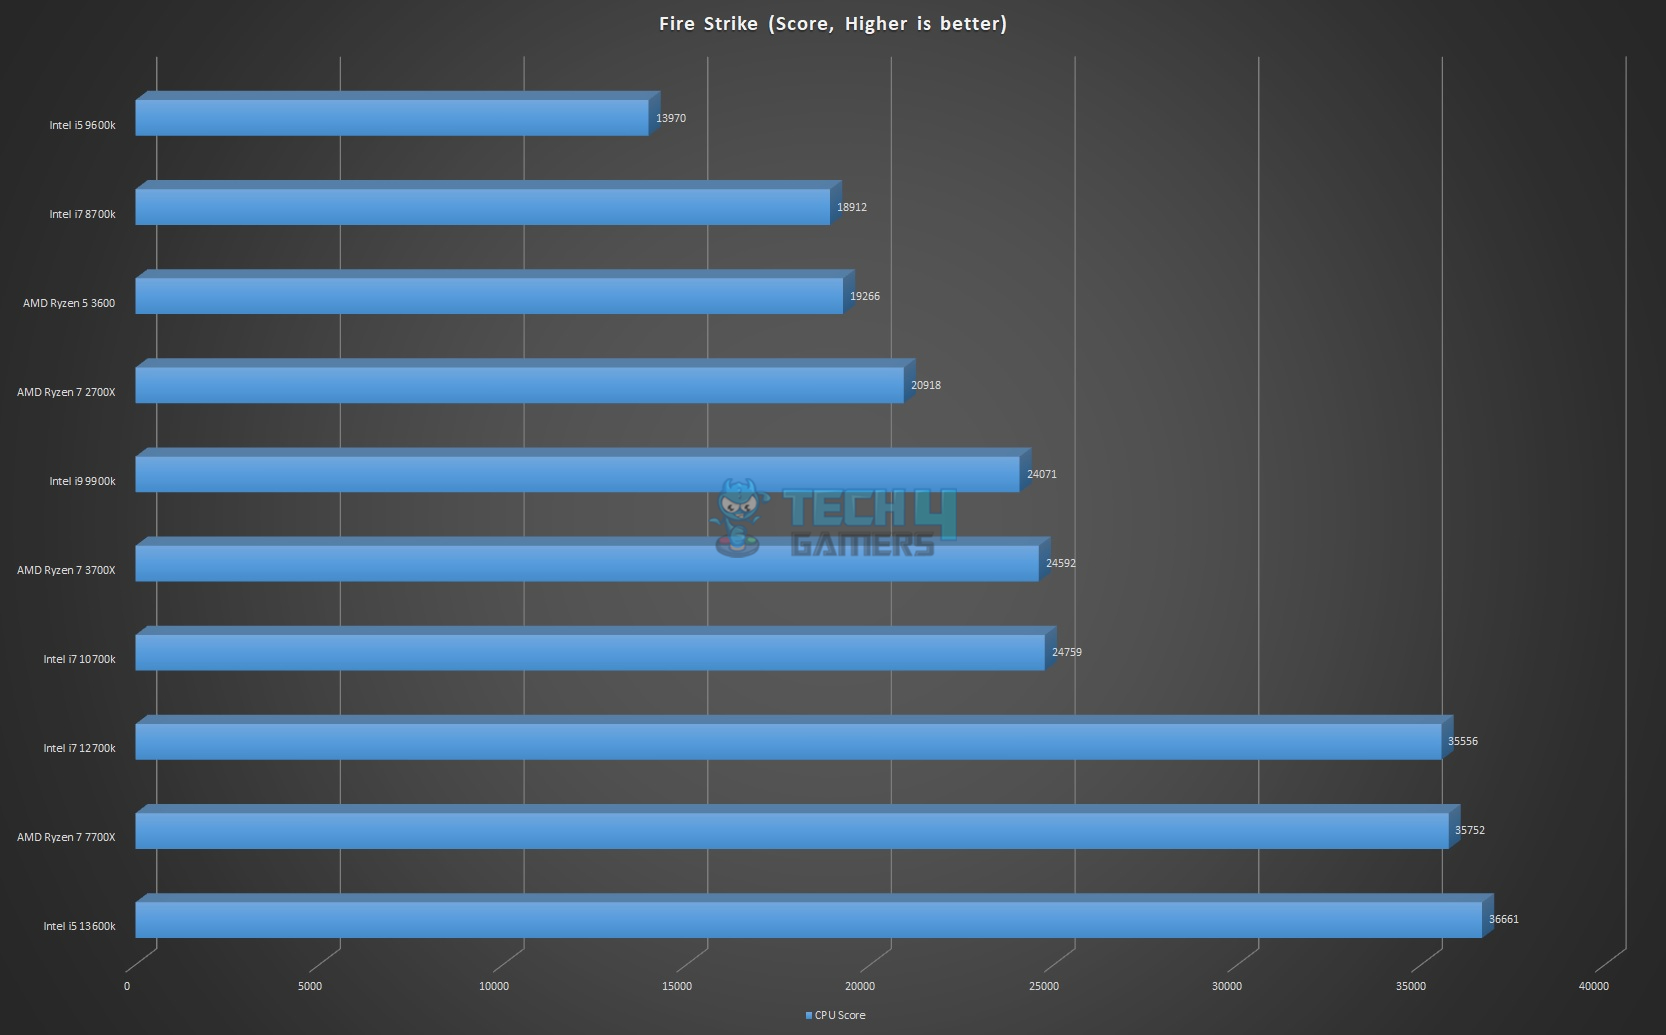
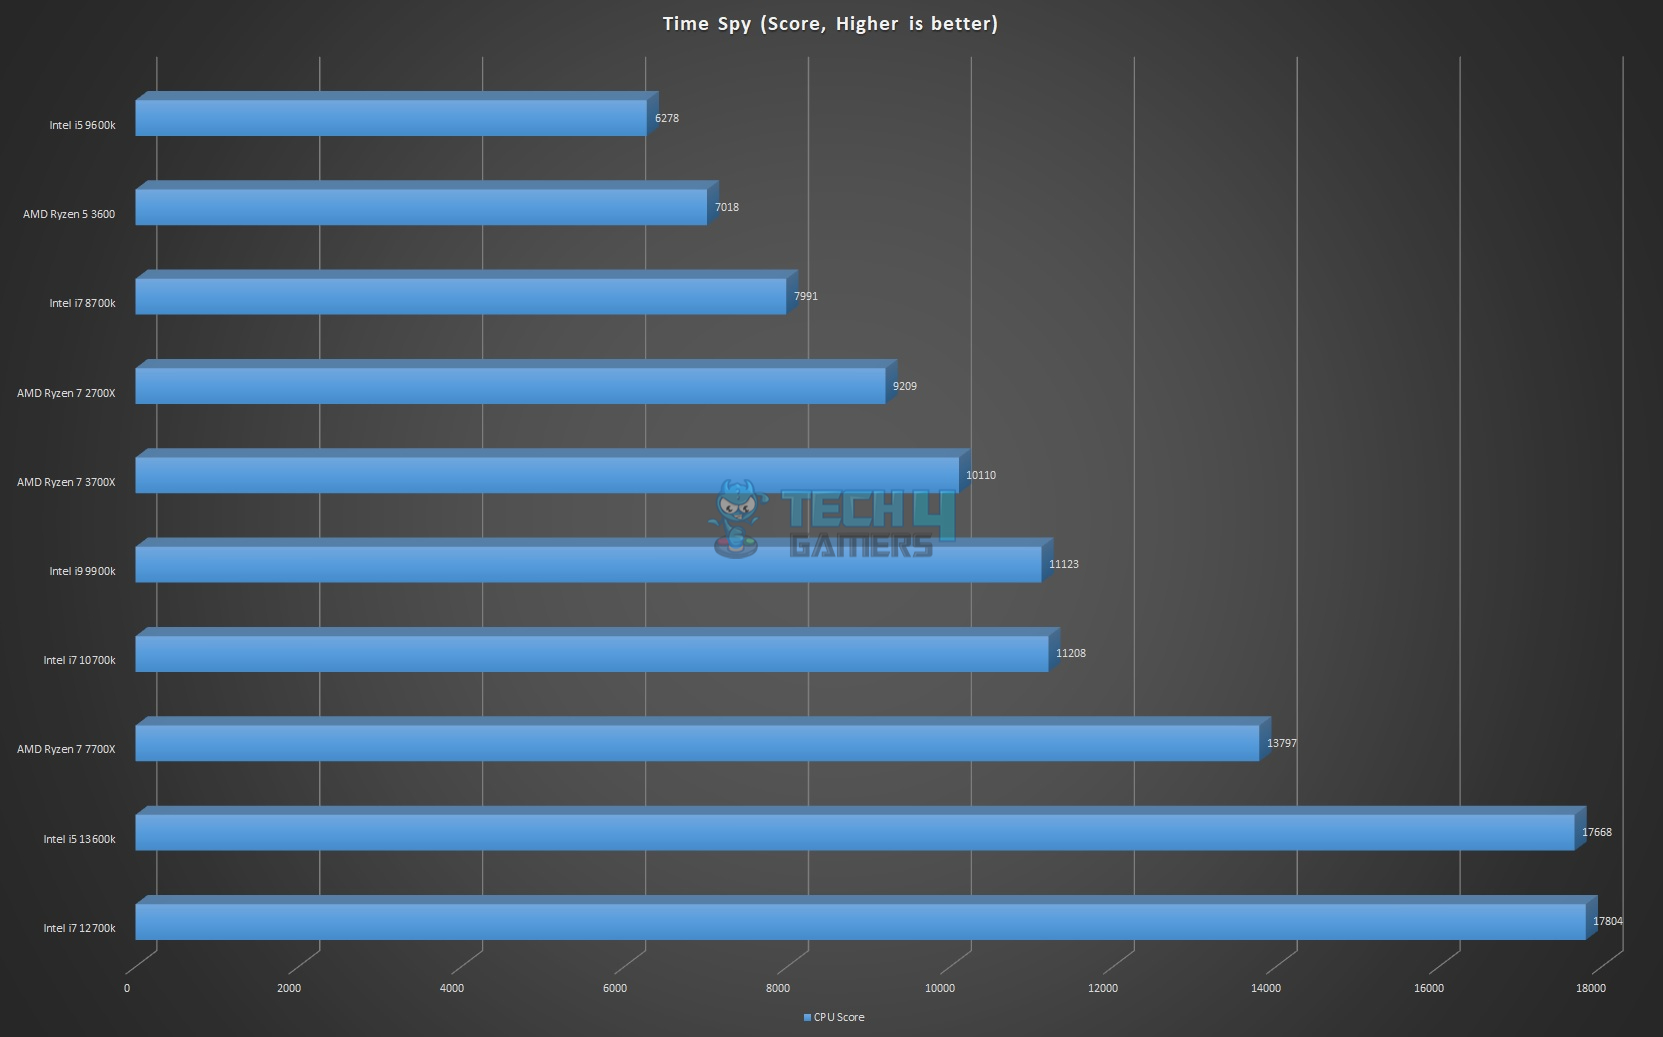
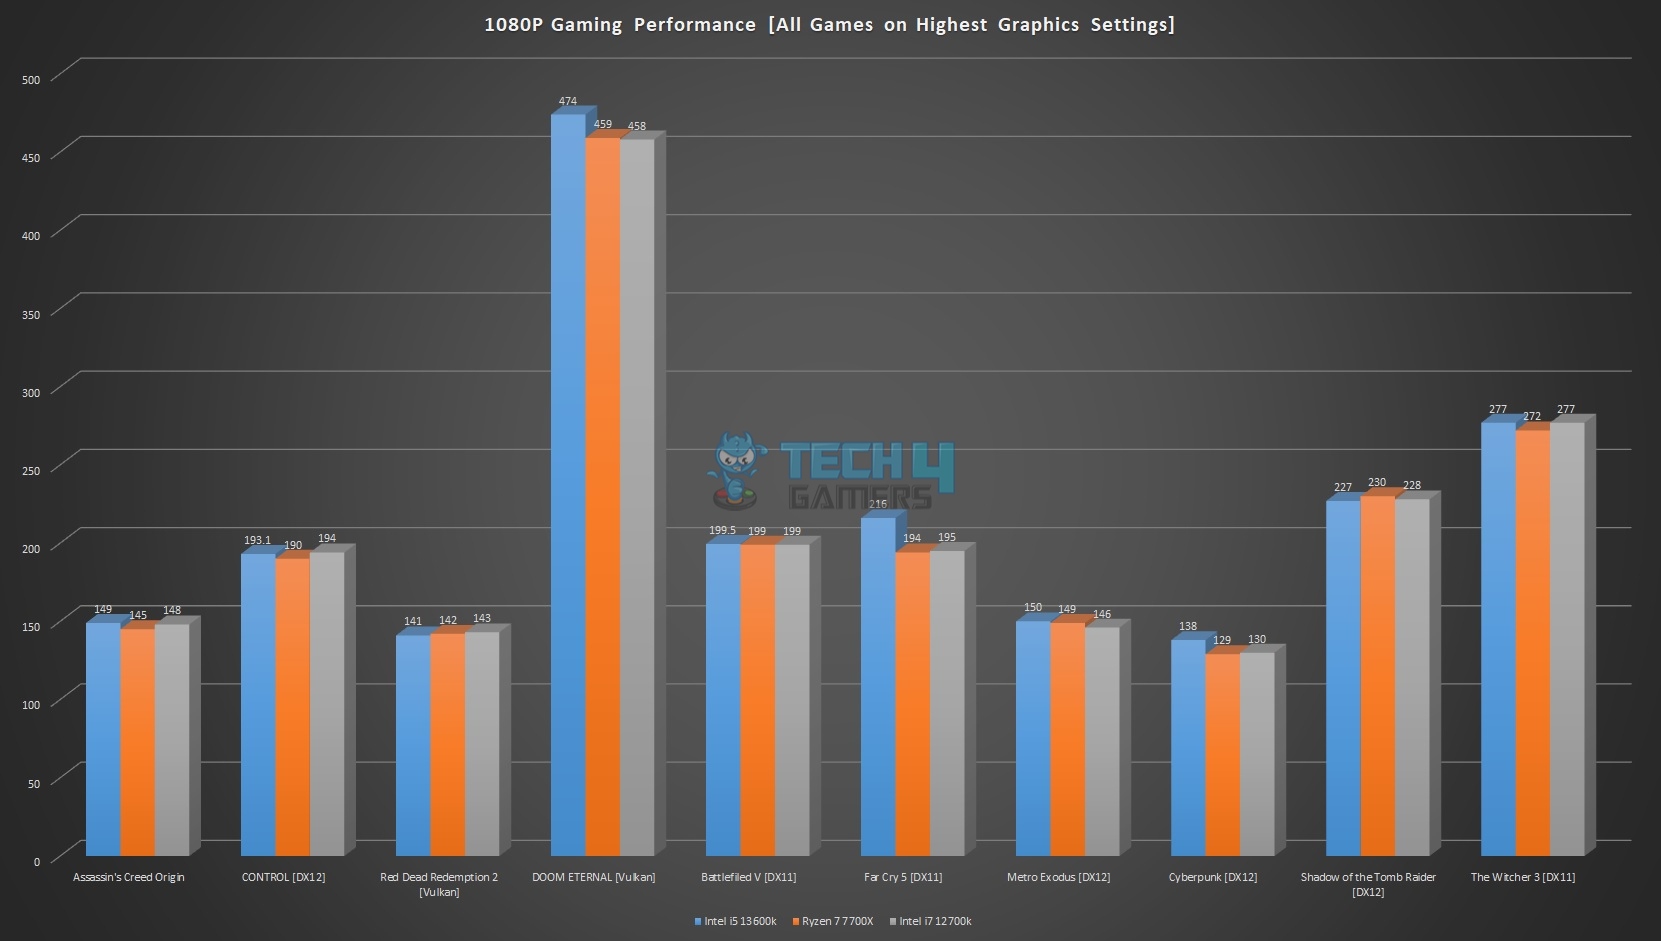
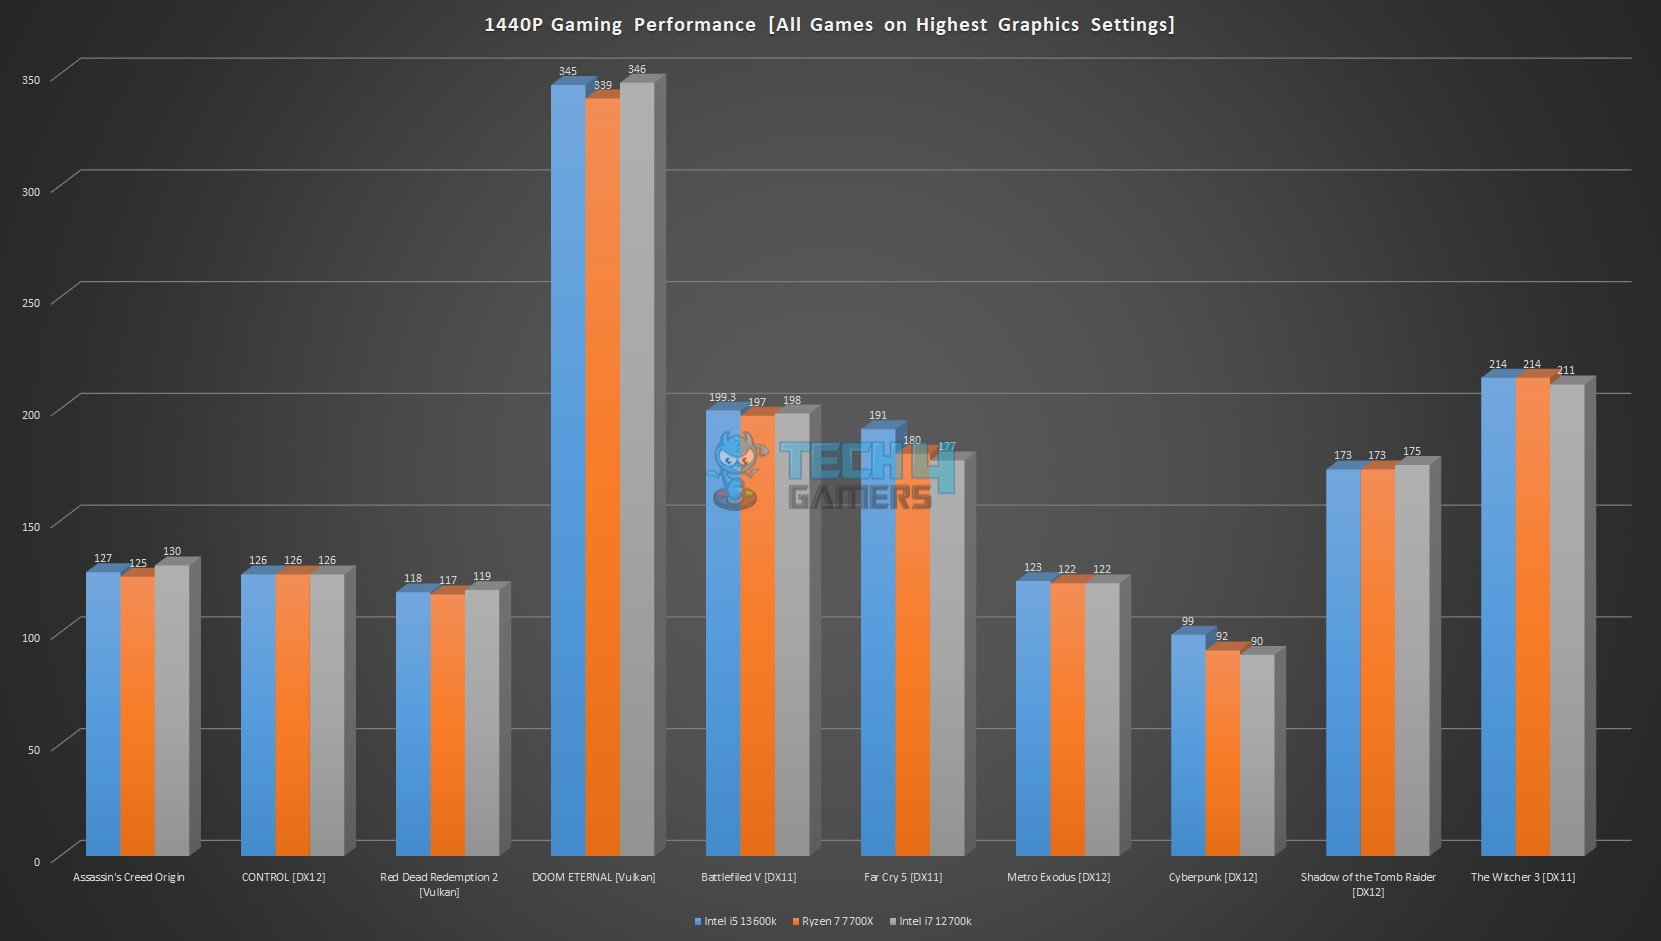
Gaming Benchmarks
Let’s start with the synthetic benchmarks. For this purpose, We have used 3DMark Fire Strike and Time Spy benchmarks.
Frequency
The Intel i5-13600K features a base clock of 3.50GHz for P-Cores and 2.60GHz for E-Cores. Its turbo frequency reaches 5.1GHz for P-Cores and 3.9GHz for E-Cores, with variability based on load and other factors. For example, the thermal headroom, power limit, cooling solution, thermal paste application, how good a motherboard is, etc.
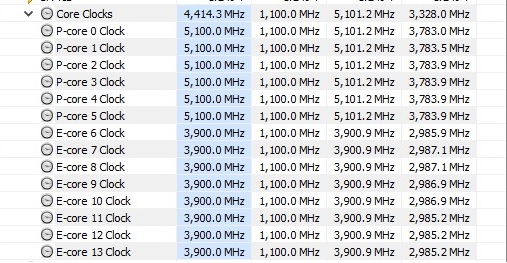
Our unit was boosting to 5.1GHz (P-Cores) and (3.9GHz E-Cores) out of the box. This is not it. The CPU actually maintained these clocks under multi-core and single-core loads using Blender, and Cinebench R23 runs.
Thermals And Power
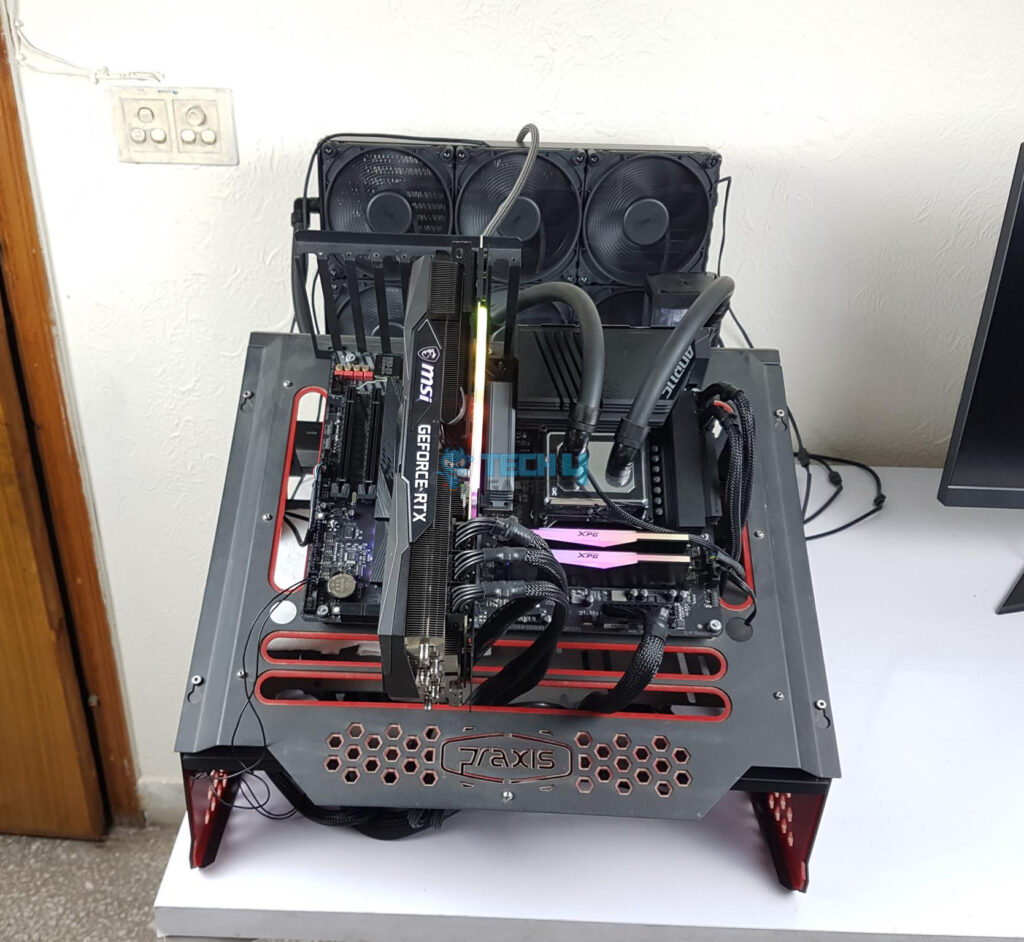
We have tested the Intel i5-13600K on the GIGABYTE Z790 AORUS ELITE AX motherboard with the latest BIOS update. This is not a high-end motherboard, but it still packs enough juice for the i5 and i7 CPUs. From the cooling perspective, we have set up a custom loop on the test bench when the CPU arrives for testing. The setup consists of:
- AlphaCool Eisblock XPX AURORA PRO Digital RGB – Full Brass
- AlphaCool Eisbecher AURORA with Apex VPP Pump
- AlphaCool NexXxos XT45 Full Copper SuperNova 1260mm Radiator
- AlphaCool Black Tube 16/10mm
- AlphaCool Straight Compression Fittings 16/10
- AlphaCool 45/90° Rotary Adapters
- AlphaCool Quick-Disconnect Fittings
- AlphaCool Clear Coolant
- 9x be quiet! Silent Wings 4 140mm PWM High-Speed Fans
The thermal paste used is AlphaCool SubZero, with a thermal conductivity rating of 16W-mK. In that, we have covered three aspects:
- Adequate Motherboard
- Powerful Cooling
- A high-grade thermal paste
We left the system idle for like 30 minutes and used HWInfo64 to monitor the thermals and power usage.
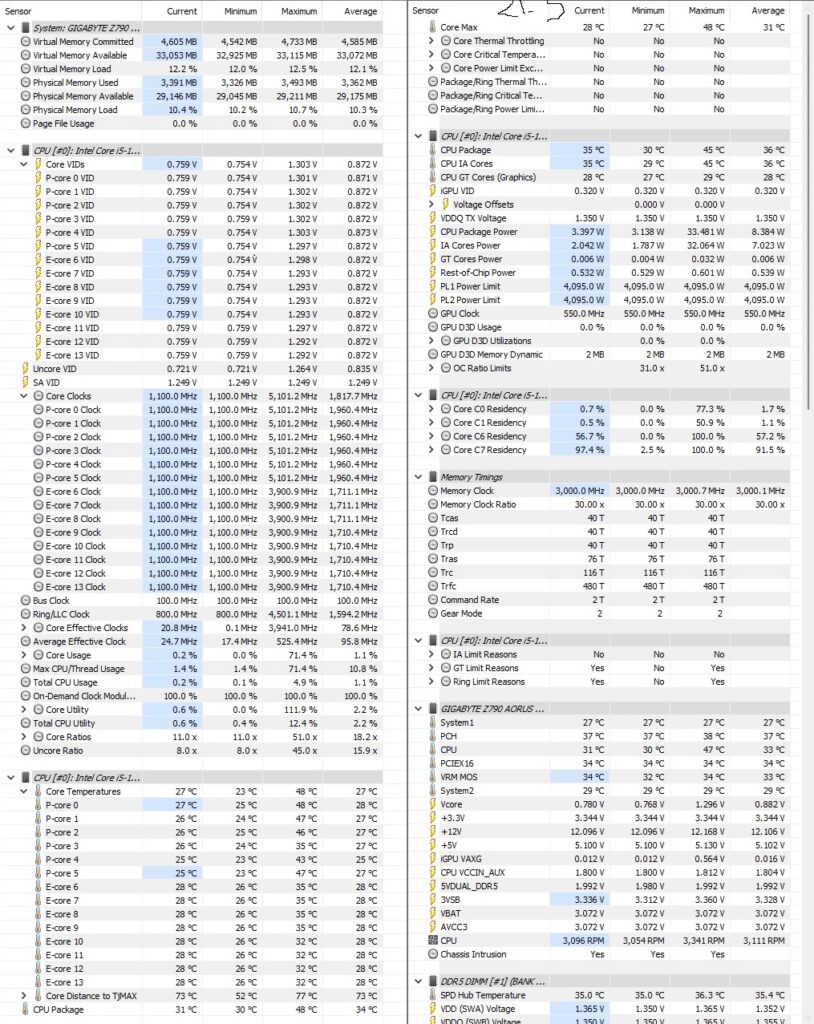
As can be seen in the above picture, the minimum package temperature was 30°C at an ambient of 21.5°C, and the package power was 3.397W. The minimum frequency was 0.80GHz on any core during idling. The overall stats are good. Please keep in mind that this is a hybrid architecture. If you take the Core Temperature sensor into consideration, then the idling is at 23°C.
Next, we run a Cinebench R23 30-minute run on the CPU and monitor the stats using the HWInfo64.
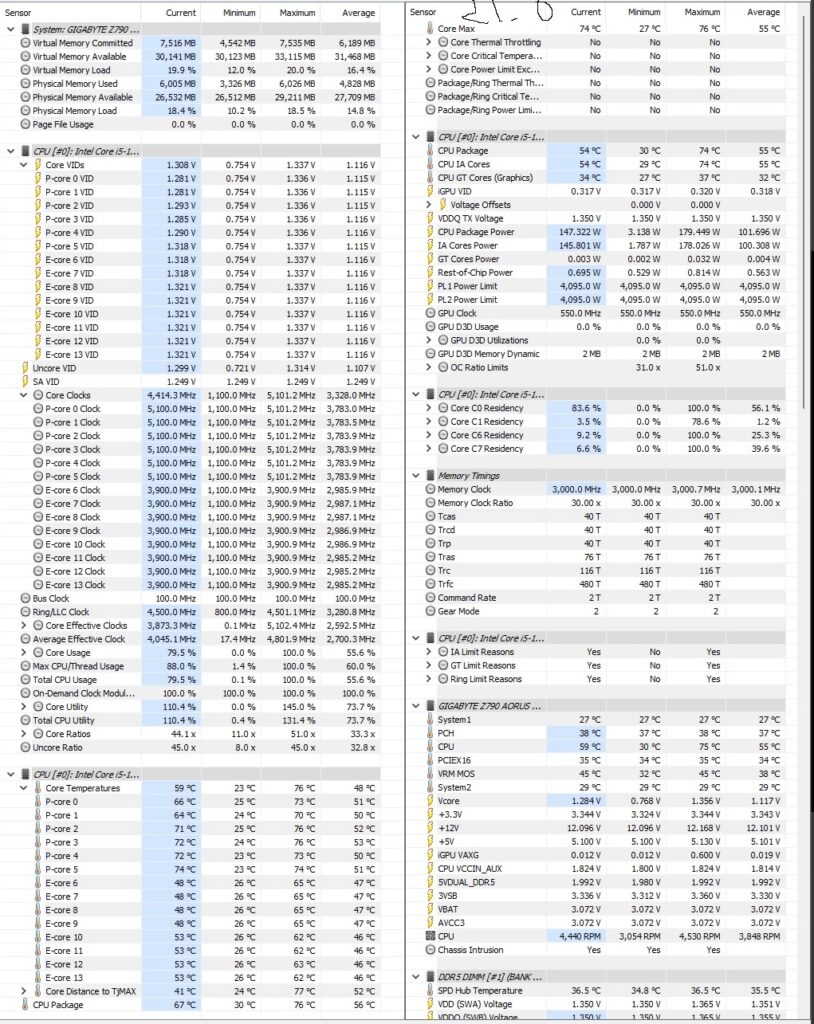
The temperature under load was 76°C. The power draw on the CPU package was 179.449W. This is within the stated 181W for turbo frequency operation. All P-Cores were operating at 5.1GHz continuously, and all E-Cores were at 3.9GHz continuously. This is an impressive performance.
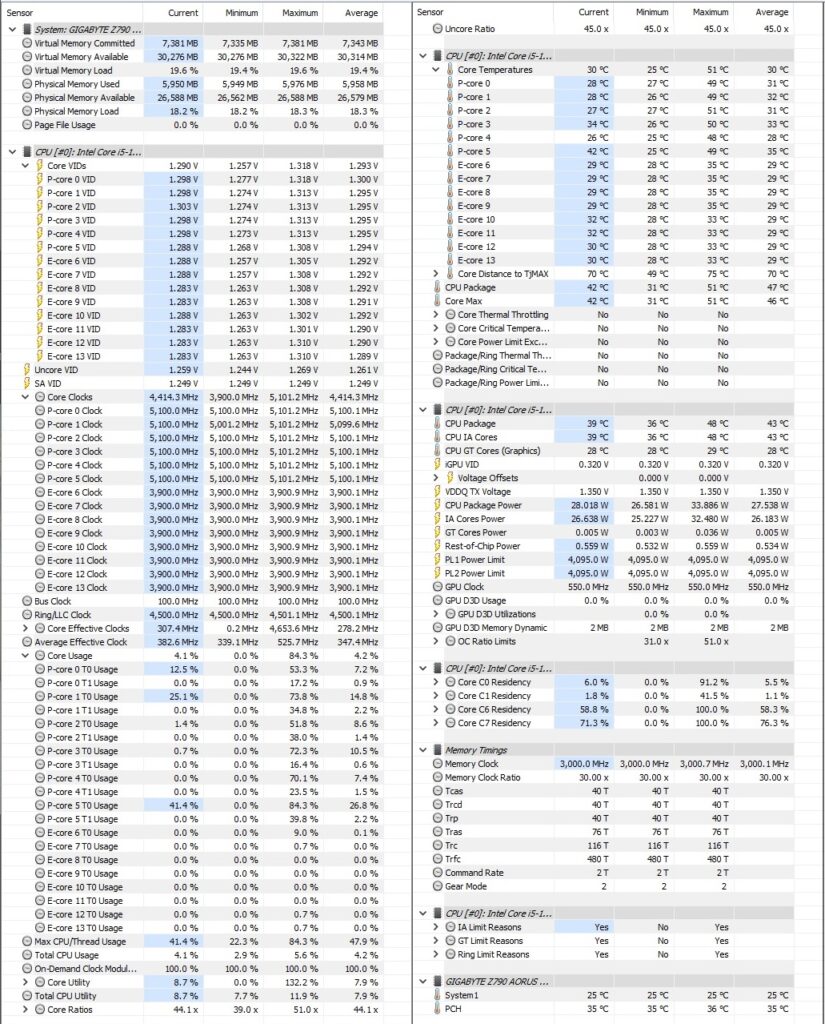
We also monitored the power usage on the single-core load using Cinebench R23. The CPU was drawing roughly 33.886W, which is very good when compared to the Intel i7 12700k and AMD Ryzen 7 7700X. Please note that single-core load does not use E-Cores on the Intel hybrid architecture (in Windows 11).
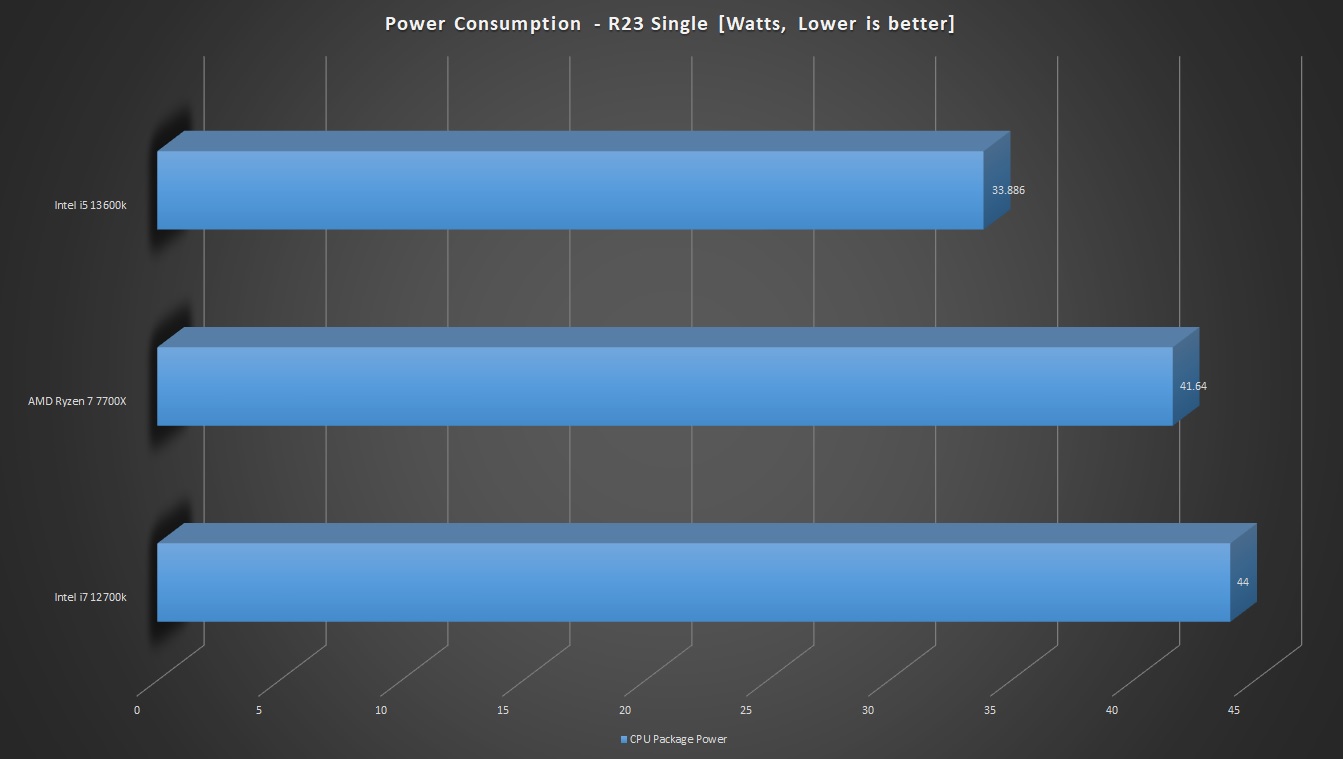
The above graph shows the power consumption on the single-threaded load from the Cinebench R23.
Contribution from E-Cores
We received an interesting query what is the contribution of E-Cores to the total performance? We decided to disable the E-Cores and run the Cinebench R23 to check the performance hit, if any. Here is the result:
| Setting | VCore (V) | Package Power (W) | Package Temperature (°C) | Cinebench R23 Multi-Core Score | Cinebench R23 Single-Core Score |
| Stock [With P-Cores and E-Cores] | 1.308 | 179.449 | 76 | 24454 | 2009 |
| E-Cores Disabled | 1.236 | 138.309 | 69 | 16126 | 1993 |
We observed approximately 34% performance hit in the multi-core load and 0.8% performance hit in the single-core load. The single-core difference is highly marginal and can be ignored as such, but the 34% hit with disabled E-Cores is making a good point on how much these cores contribute.
Overclocking
We started with P-Cores at 5.2GHz and E-Cores at 4.0GHz. For each change, we have tested the Cinebench R23 to see if there is any performance hit or gain. This was then tested further using games and other loads for stability. We settled at P-Cores at 5.6GHz and E-Cores at 4.4GHz. This is a good overclock on this CPU. The Vcore was set at approximately 1.330V.
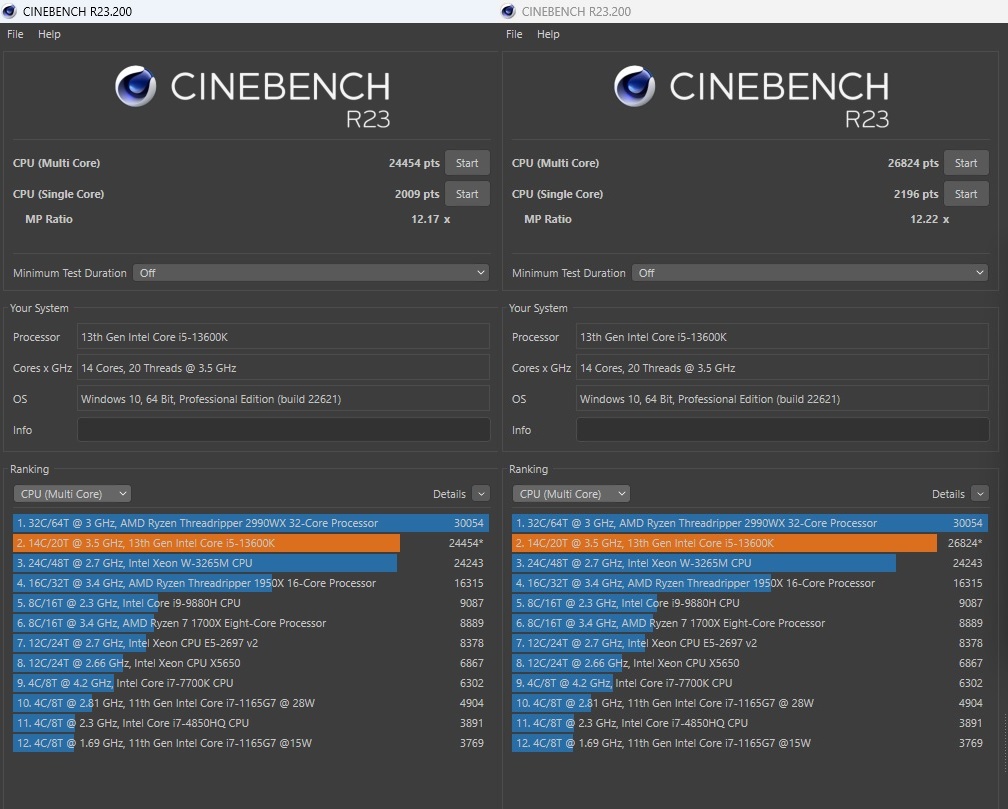
The above picture shows the performance gain from these overclocks in the Cinebench R23. We saw a performance gain of approximately 9.69%.
The CPU was drawing 192W package power approximately, and the temperature was 81°C. Please remember we are using a custom loop setup with a massive-size radiator. The results with the regular AIO or air cooler would be different, and you might actually go into thermal throttling with this overclock on a regular cooler. Any attempt to further increase the clocks was met with failures. Seems like we hit the silicon limit!
Should You Buy It?
We conducted multiple tests on the Core i5-13600K. The results have given us a fairly good idea about the processor’s use case.
Buy It If:
✅You are building a mid-range system: The core i5-13600K supersedes its predecessor when it comes to performance, making it a suitable processor to pair with high-end graphics cards such as the RTX 4070 Ti, 4080, and even the 4090.
✅You want a CPU for competitive titles: In our tests, the core i5-13600K performed well in single-core tasks while also keeping up in multi-threaded scenarios, making it perfect for competitive titles.
✅You want a cost-effective processor: Unlike the higher-end processors from Intel, the core i5-13600K is reasonably priced.
✅You want support for DDR4 and DDR5 memory: The Core i5-13600K supports both DDR4 and DDR5 memory kits.
Don’t Buy It If:
❌You want an efficient processor: During our tests, the i5-13600K remained efficient under single-threaded tasks; however, it proved to be slightly more power-hungry in multi-threaded scenarios, with its consumption spiking up to 180W.
My Thoughts
I tested the Core i5-13600K, Core i7-12700K, and Ryzen 7 7700X for energy efficiency. The Core i5-13600K outperformed the others with a score of 59.29, but in multi-threaded scenarios, both Intel CPUs consumed more power. The Core i5-13600K scored 136.27 in energy efficiency, the Core i7-12700K scored 115.56, and the Ryzen 7 7700X scored 143.40, surprising me as the Ryzen was more energy-efficient.
Gaming performance varied, with the Core i5-13600K excelling in some titles. Thermals were better, but using an AIO is still recommended. I managed to overclock it to 5.6GHz on P-Cores and 4.4GHz on E-Cores, with temperatures reaching 81°C in my DIY setup.
Intel’s advantage is platform compatibility; 13th gen CPUs work on the 12th gen platform with a BIOS update, saving users money. You can also use DDR4 RAM on the new 700 series platform, which supports both DDR5 and DDR4. The Core i5-13600K offers great performance at a competitive price, making it a cost-effective choice.
Awards Received By Core i5-13600K
Here are the Tech4Gamers awards received by the i5-13600K after thorough testing.
- Best Overall CPU For Gaming
- Best Budget CPU For Video Editing
- Best CPU for Streaming 1080p
- Best Budget CPU for RTX 4090
- Best Budget CPU for RTX 4080
- Best Intel CPU for RTX 4060
- Best Intel CPU for RTX 4060 Ti
- Best Overall Gaming CPU For RTX 4070 Ti
- Best Intel CPU For RX 7700 XT
- Best Overall Gaming CPU For RX 7800 XT
- Best Budget CPU For RX 7900 XTX & RX 7900 XT
Recent Updates
- October 21, 2023: Few text changes to improve readability. Also added image galleries.
- December 17, 2023: Few text changes to improve readability.
Thank you! Please share your positive feedback. 🔋
How could we improve this post? Please Help us. 😔
[Hardware Reviewer & Editor]
Meet Nauman Siddique, a highly experienced computer science graduate with more than 15 years of knowledge in technology. Nauman is an expert in the field known for his deep understanding of computer hardware.
As a tech tester, insightful reviewer, and skilled hardware editor, Nauman carefully breaks down important parts like motherboards, graphics cards, processors, PC cases, CPU coolers, and more.
- 15+ years of PC Building Experience
- 10+ years of first-hand knowledge of technology
- 7+ years of doing in-depth testing of PC Hardware
- A motivated individual with a keen interest in tech testing from multiple angles.
- I majored in Computer Science with a Masters in Marketing
- Previously worked at eXputer, EnosTech, and Appuals.
- Completed Course in Computer Systems Specialization From Illinois Tech
Get In Touch: nauman@tech4gamers.com