


AMD Radeon RX 7900 GRE Rated: 9.0/10 Nvidia GeForce RTX 3080 10GB Rated: 8.9/10
Pros And Cons
| GPU | Pros | Cons |
|---|---|---|
| Radeon RX 7900 GRE | ✅ Better performance than the RTX 3080 10GB ✅ Comparatively Power Efficient | ❌ Limited availability ❌ Higher price than the RTX 3080 10GB |
| Nvidia RTX 3080 10GB | ✅ Effective Ray Tracing performance ✅ GPU performance is good for 1080p & 1440p | ❌ Much higher power consumption |
- The RX 7900 GRE was about 6.3% faster than the RTX 3080 in our gaming tests at 4k, with the settings dialed up to the max.
- The RTX 3080 drew around 100 watts more power than the RX 7900 GRE whilst being less performant.
- The RX 7900 GRE is significantly more expensive, costs around $699, and has a lower supply than the more widely available RTX 3080 which costs $499 for renewed card.
- I recommend selecting the RTX 3080 10GB for its current affordability and easy availability and the RX 7900 GRE for superior performance and energy-saving capabilities.
Comparison Table
| Technical Specs | NVIDIA RTX 3080 10GB | AMD Radeon RX 7900 GRE |
|---|---|---|
| GPU Chip | GA102 | Navi 31 |
| Architecture | Ampere | RDNA 3.0 |
| Shading Units | 8960 Cuda Cores | 5120 Stream Processors |
| RT Cores | 70 | 80 |
| Memory Bus Width | 320bit | 256bit |
| Memory Bandwidth | 760GB/s | 576GB/s |
| TDP | 350W | 260W |
| Best Variants | Best RTX 3080 Graphics Cards | – |
Architectural Differences
- Process Size: The RX 7900 GRE utilizes more advanced 5nm processing nodes (as well as 6nm nodes thanks to its chiplet design), whereas the RTX 3080 uses an older 8nm manufacturing process.
- Clock Speed: The RX 7900 GRE boasts higher clock speeds, with a base clock of 1500MHz compared to the RTX 3080’s 1260MHz. Additionally, the RX 7900 GRE’s boost clock of 2245MHz far surpasses the RTX 3080’s 1710MHz.
- TDP: The RX 7900 GRE’s newer, more refined architecture allows it to get away with a TDP of only 260 watts, whereas the RTX 3080 has a heftier TDP of 350 watts.
- VRAM: The RX 7900 GRE also has substantially more VRAM than its competitor. It utilizes 16GB of GDDR6 memory, whereas the RTX 3080 uses 10GB of faster GDDR6X memory.
- Bus Width: One key aspect where the RX 7900 GRE gets beaten is in terms of its bus width, with the RTX 3080 supporting a wide 320-bit bus, whereas the RX 7900 GRE uses a narrower 256-bit bus.
- Other Features: Despite the RX 7900 GRE being a newer card, it offers almost no extra features compared to Nvidia’s card from last year. Both cards support equivalent ray-tracing chops, use their respective super scaling software (DLSS/FSR), and are slated to get support for AMD’s upcoming frame generation technology.
The RX 7900 GRE is a card that uses the RX 7900 moniker deceptively. It presents pretty cut-down specifications from the RX 7900 XT and the XTX without any tricks to help back performance up. The RTX 3080 does the same to a lower extent, using the same name with a 10GB and 12GB variant. This comparison of the RX 7900 GRE vs RTX 3080 10GB will highlight both cards’ strong and weak points.
Gaming Benchmarks
Sometimes, it’s better to just see the performance of computer hardware instead of comparing every detail on a spec sheet, so we chose to test these cards in real-world gaming scenarios to gauge the performance difference of the RX 7900 GRE vs RTX 3080.
Test Bench
- OS: Windows 10 Pro
- CPU: Intel Core i7 13700k
- Motherboard: MSI Z790 Tomahawk Max WiFi Motherboard
- CPU Cooler: MSI MAG CORELIQUID E360 CPU Liquid Cooler
- SSD: XPG GAMMIX S70 BLADE 2TB NVMe SSD
- Memory: Kingston Fury Renegade RGB DDR5 32GB 7200MHz
- Power Supply: ENERMAX REVOLUTION D.F. X 1050W
The Last Of Us Part 1
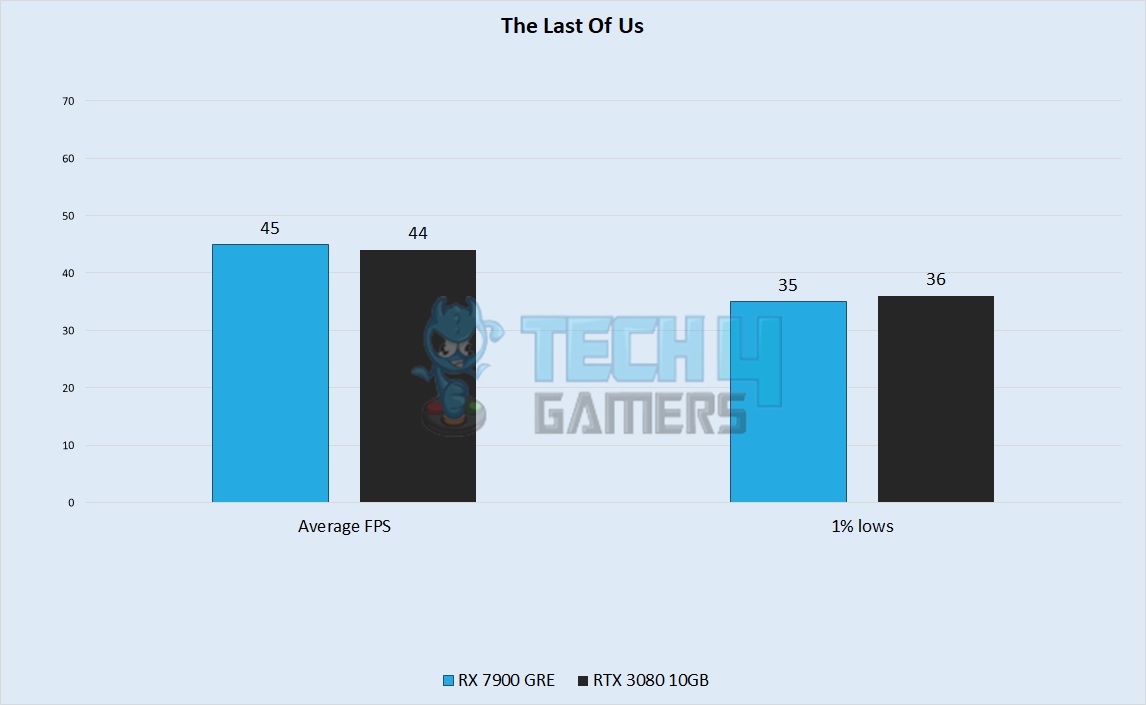
- The performance of both cards in The Last Of Us Part 1 was quite the same in our game benchmark. The RX 7900 GRE managed an average of 45 FPS. In contrast, the RTX 3080 had an average framerate of 44 FPS.
- 1% lows also shared the frame of difference that the averages saw, with the RX 7900 GRE fumbling its way down to 35 FPS when the graphics became intense, whereas the RTX 3080 got 1% lows of 36 FPS.
Resident Evil 4
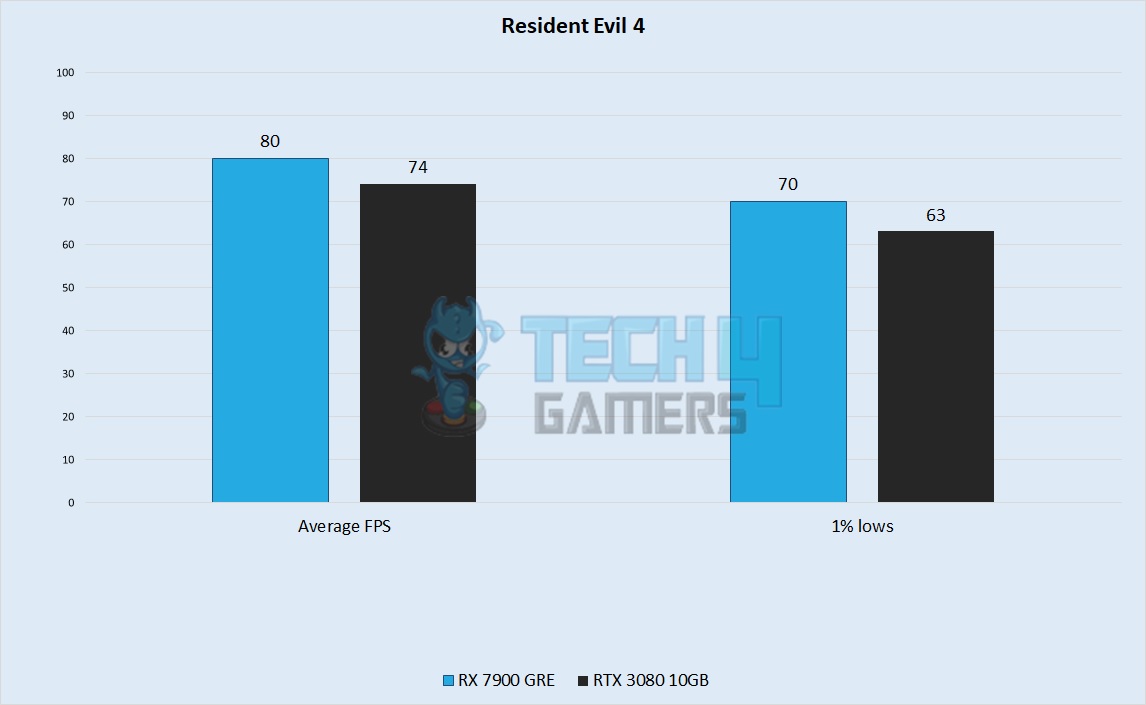
- The RX 7900 GRE enjoyed a substantial advantage over the RTX in our test run of this game, with its average touching 80 FPS, whereas the RTX 3080 had an average performance of 74 FPS.
- The RX 7900 GRE also boasted higher 1% lows than its competitor, getting minimums of around 70 FPS in graphically intense scenes, whereas the RTX got minimums of about 63 FPS, leading to stuttery gameplay.
Forza Horizon 5
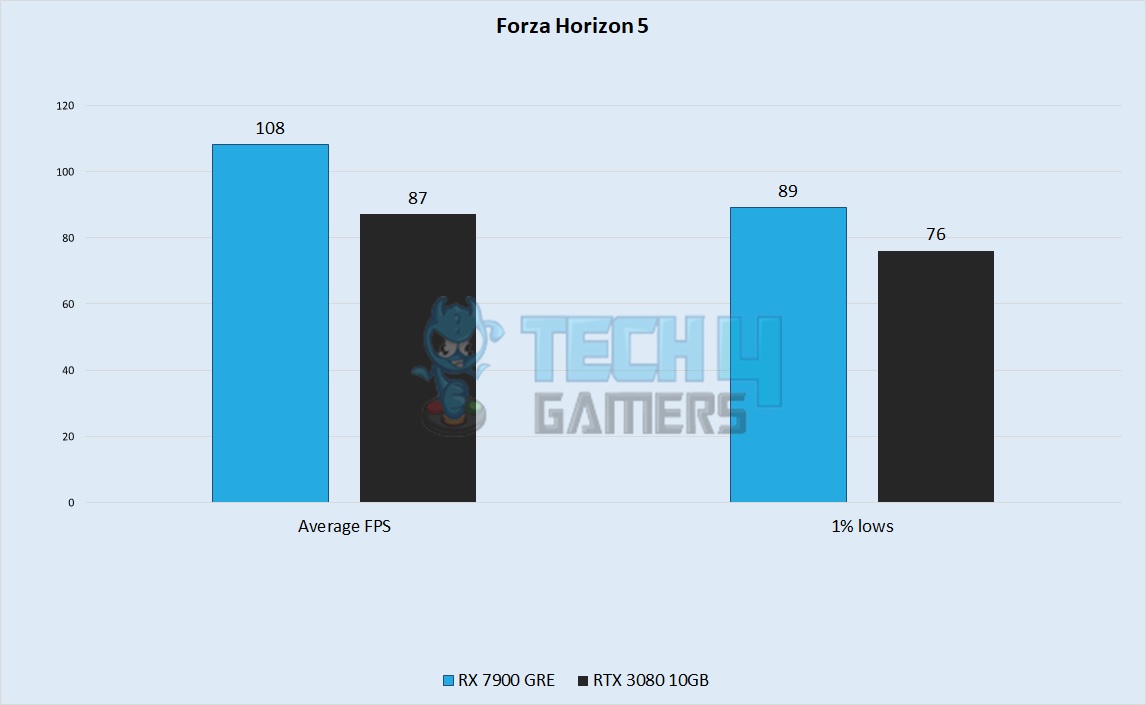
- The growth in the performance gap between these cards widened with Forza Horizon 5, with the RTX 3080 getting around 87 FPS on average, whereas the RX 7900 GRE flew by the RTX with an average of about 108 FPS.
- 1% lows on the RTX 3080 also plummeted substantially compared to the RX 7900 GRE, with the former getting a minimum framerate of around 76 FPS, whereas the latter got a minimum of 89 FPS.
Hogwarts Legacy
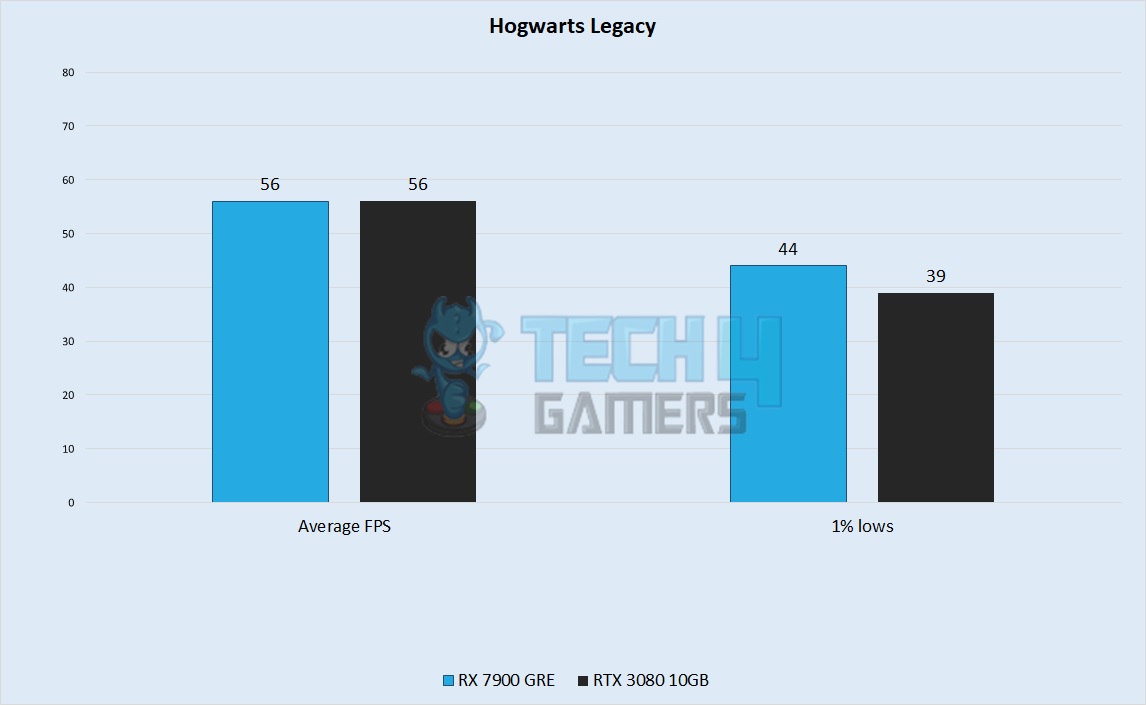
- The performance of both cards equalized once again in Hogwarts Legacy. The RTX 3080 10GB and the RX 7900 GRE both had an average framerate of 56 FPS in our test of this game.
- The RTX card felt more stuttery because its 1% lows hung around 39 FPS, whereas the RX 7900 GRE had smoother lows around the 44 FPS mark.
Fortnite
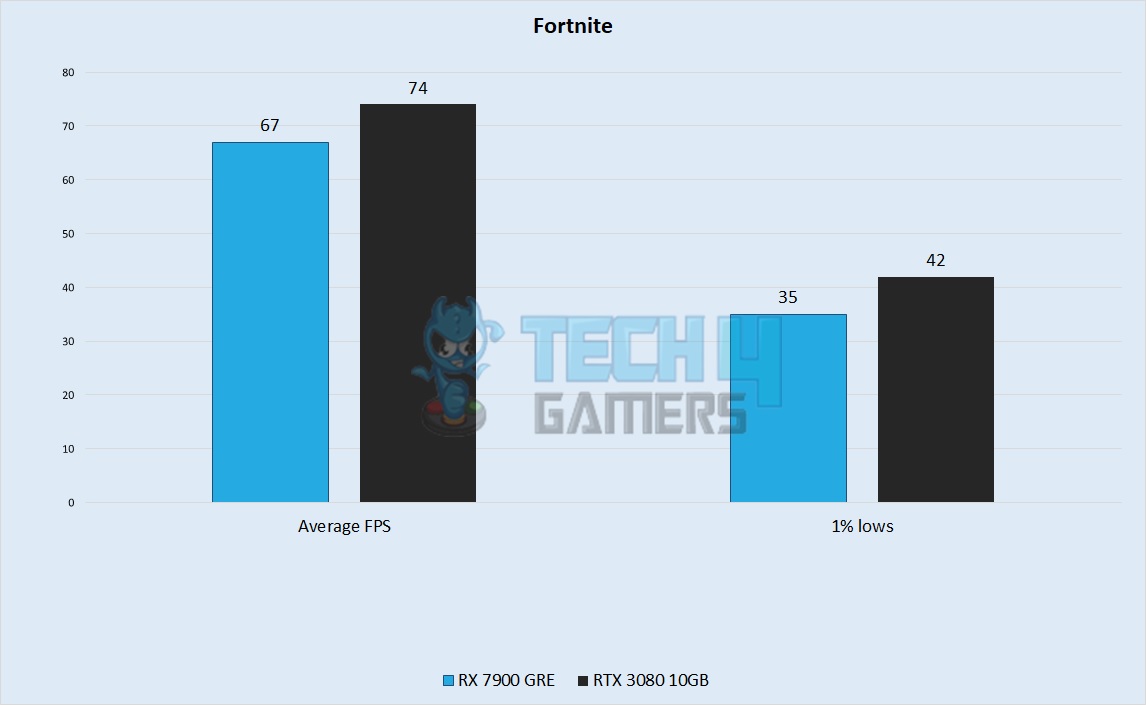
- The RX 7900 GRE managed an average framerate of only 67 FPS on Ultra settings at 4k, whereas the RTX 3080 had an impressive 74 FPS average.
- At the low 1% performance, the RTX 3080 handled a frame rate of 42 FPS, whereas the GRE had a framerate of around 35 FPS.
A Plague Tale: Requiem
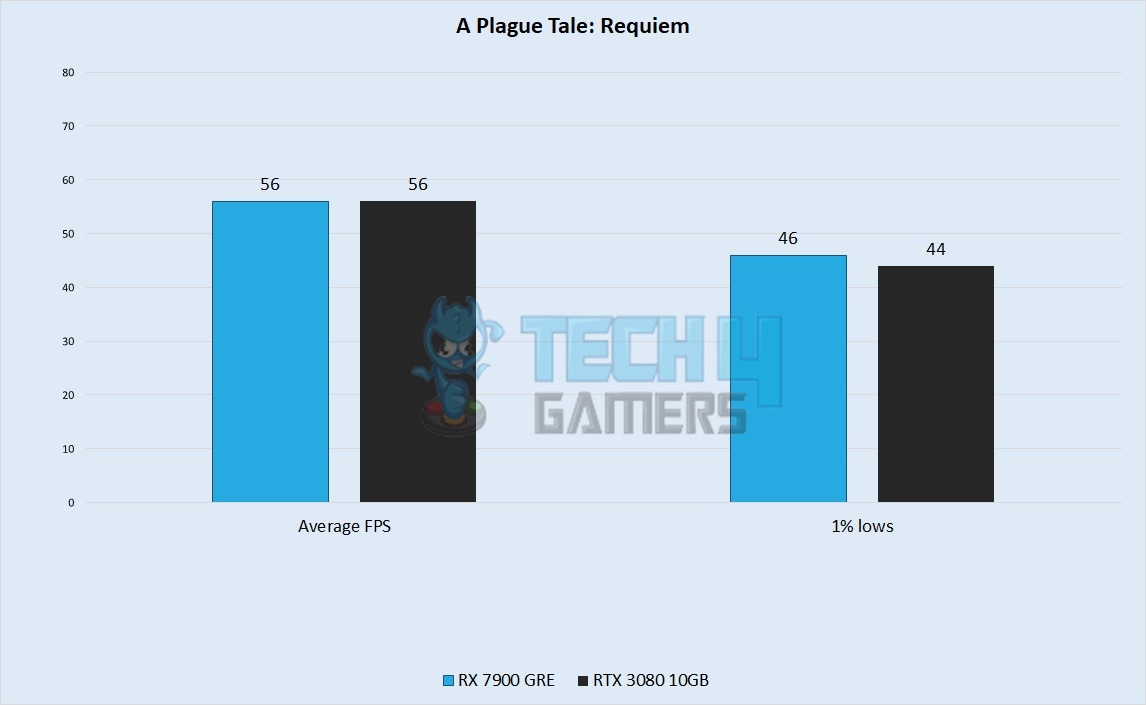
- This game brought the two cards back to equilibrium, with both cards averaging a framerate of around 56 FPS in this unoptimized title.
- Coming to the low 1% frame rate, the RX 7900 GRE stuttered down to 46 FPS, whereas the RTX 3080 had a framerate of around 44 FPS.
Overall Gaming Performance
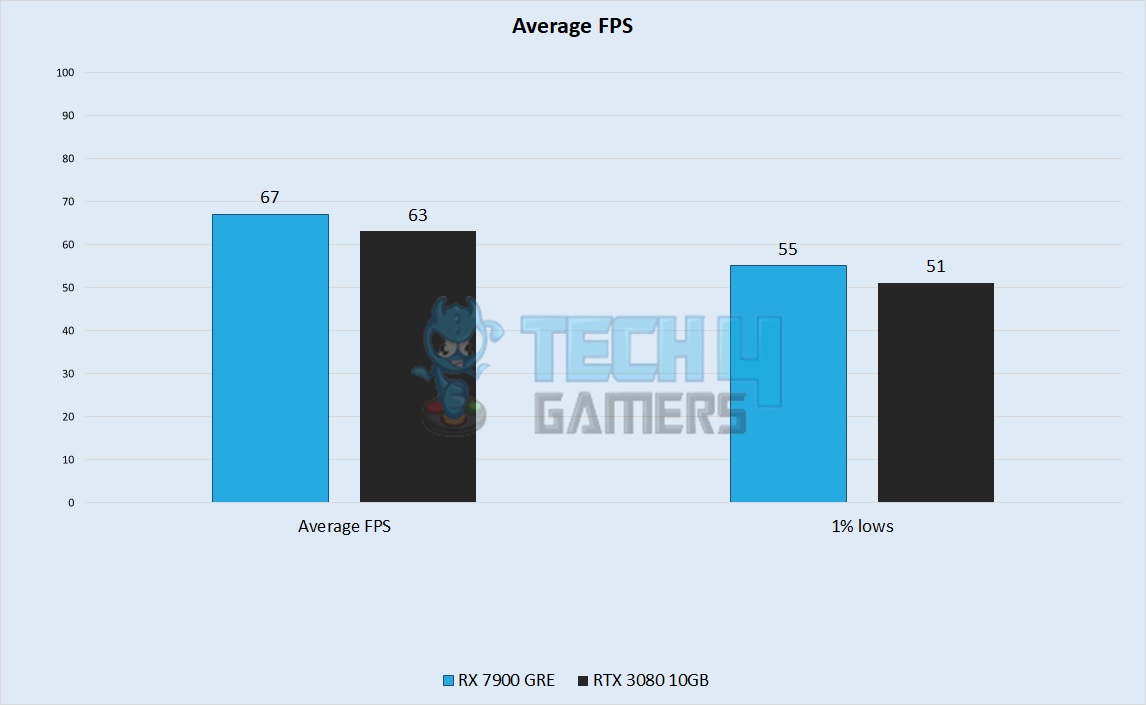
Analyzing the outcomes of the gaming sessions, our tests revealed that the RTX 3080 10GB maintained an average frame rate of approximately 63 FPS, while the RX 7900 GRE provided a greater average of 51 FPS. Thus, the RX 7900 GRE renders about 6.3% better performance in 4K games.
Considering the results of the low 1% performance, the RX 7900 GRE turned a frame rate of 55 FPS, while the RTX 3080 10GB mustered 51 FPS. So, the RX 7900 GRE performance is about 7.8% more effective than the rival in worst performance scenarios.
Winner: AMD Radeon RX 7900 GRE
Power Consumption
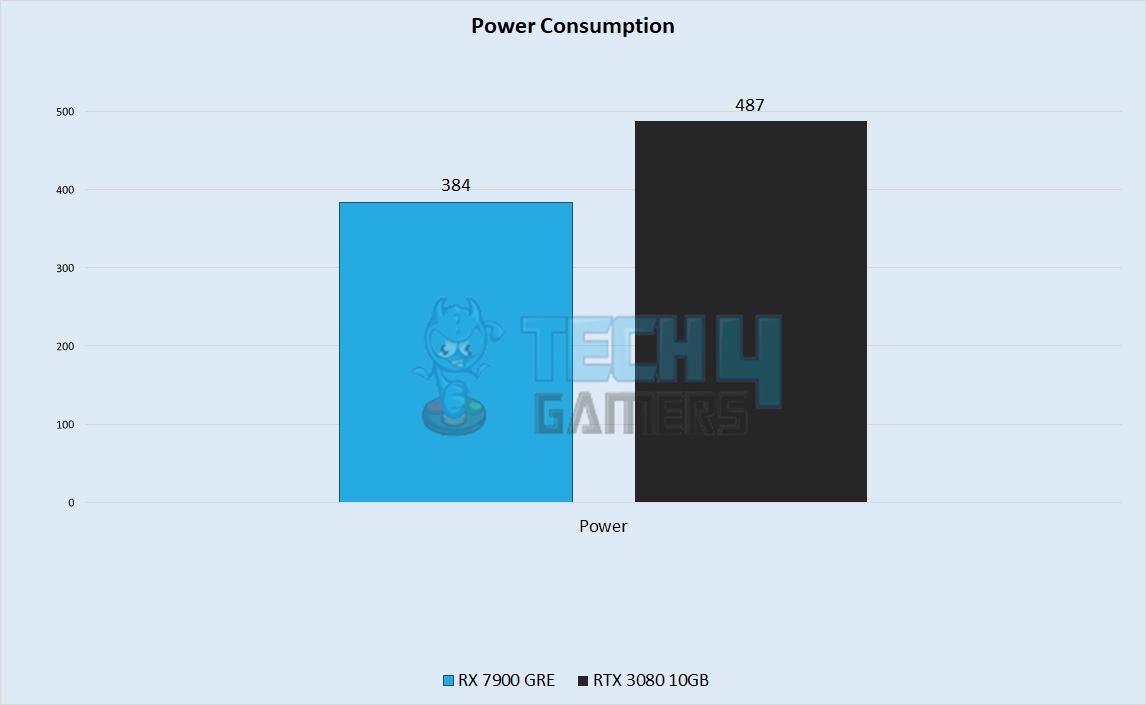
With the implementation of our RX 7900 GRE, our test setup maintained an average power draw of 384 watts. However, upon substituting it with the RTX 3080 10GB, the power usage surged to 487 watts, marking an increase of nearly 100 watts compared to the RX 7900 GRE. Thus, we can say that the RX 7900 GRE is about 27% more power efficient than the RTX 3080 10GB.
Winner: AMD Radeon RX 7900 GRE
Price And Availability
| GPU | Launch MSRP | Current Price |
|---|---|---|
| AMD Radeon RX 7900 GRE | 💲649 | 💲749 |
| Nvidia GeForce RTX 3080 10GB | 💲699 | 💲499 (Refurbished), 💲899 (New) |
| Difference | 7.7% | 20% |
There is no point in buying a brand new RTX 3080 10GB today. The refurbished RTX 3080 10GB can be had for around $499 on Newegg, whereas used retailers like eBay can get you an even lower price. In contrast, the RX 7900 GRE launched for $649 is not available in markets. It may only be available in China.
Final Verdict – What Do We Recommend?
Radeon RX 7900 GRE: The RX 7900 GRE has a performance advantage over the RTX 3080. It is also more power efficient because of its latest architecture. However, it is currently not available in markets except China.
GeForce RTX 3080 10GB: The RTX 3080 10GB is among the most powerful graphics cards of Nvidia’s last generation. Its ray tracing performance is brilliant. However, its power consumption is very high. But if you buy a refurbished RTX 3080 in a low price, it would be worth it for its performance.
If you’re willing to pay for a slightly faster, slightly newer graphics card, the RX 7900 GRE is a good option if it’s available near you. For anyone looking for a good deal, though, the RTX 3080 is a great card for the price it’s selling for.
Frequently Asked Questions
The RTX 3080 was a 10GB card at launch, but Nvidia quietly launched the RTX 3080 12GB at the height of the GPU shortage.
Yes, the RTX 3080 10GB comes with 70 RT cores, whereas the RX 7900 GRE is equipped with 80 RT cores.
The RTX 3080 10GB is based on the Ampere architecture from Nvidia, whereas the RX 7900 GRE uses the latest RDNA 3.0 architecture from AMD.
More From RTX 3080
More From RX 7900 GRE
Thank you! Please share your positive feedback. 🔋
How could we improve this post? Please Help us. 😔
[Comparisons Expert]
Abdemanaf is a skilled creative writer who has been honing his craft since 2011. While initially working in different fields, he found a passion for technology and has been exploring the tech world since early 2015. Over the years, he has developed an in-depth knowledge of the latest tech trends and product offerings by various companies.
Abdemanaf’s writing reflects his analytical mindset and ability to think critically. He has a knack for breaking down complex technical information into easily digestible pieces, making his articles engaging and accessible to readers from all backgrounds. In February 2022, he joined Tech4Gamers as a blog and product comparison writer, where he has been able to hone his skills further.
As a writer, Abdemanaf is dedicated to staying up-to-date with the latest technological advancements and trends, enabling him to provide readers with the most relevant and accurate information. He is always eager to learn more and is constantly seeking new challenges to improve his skills.
Get In Touch: manaf@tech4gamers.com


