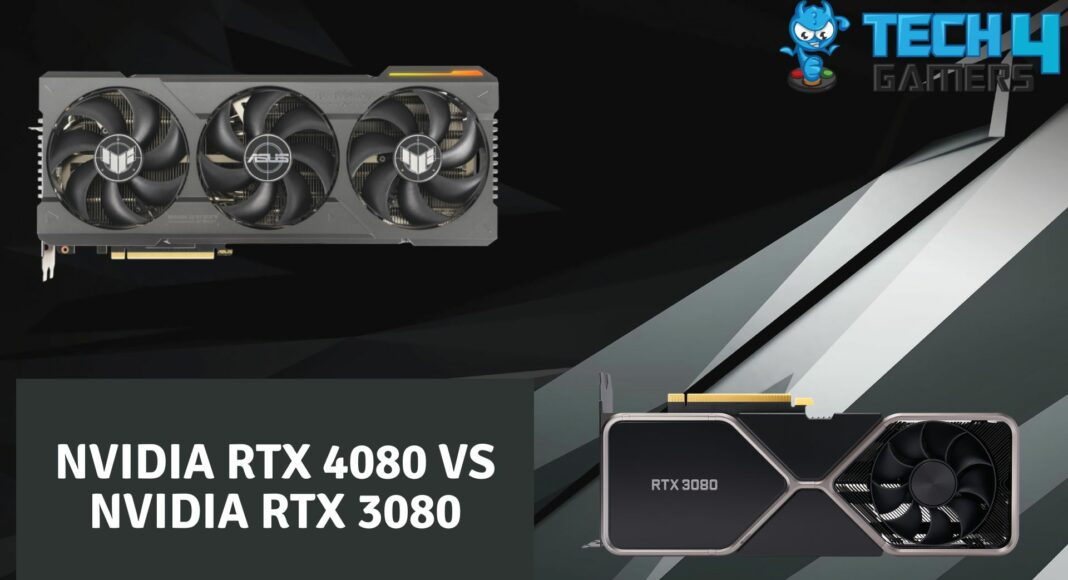
NVIDIA RTX 4080
Rated: 8.7/10
NVIDIA RTX 3080
Rated: 8.4/10
Pros And Cons
| GPU | Pros | Cons |
|---|---|---|
| NVIDIA RTX 4080 | ✅Superior gaming performance ✅Better efficiency | ❌Availability and Higher price |
| NVIDIA RTX 3080 | ✅Affordable option ✅Decent gaming performance | ❌Potential future limitations |
- RTX 4080 outperforms RTX 3080 by around 40% in FPS across various games, particularly noticeable at 4K settings.
- RTX 4080 demonstrates better efficiency, with lower temperatures and consuming approximately 4% less power on average compared to RTX 3080.
- RTX 4080 is priced significantly higher at $1,110, representing an increase of approximately 84% over the RTX 3080’s price of $450.
- Despite the cost, consider RTX 4080 for its substantial performance boost, especially if the budget allows and demanding gaming needs warrant the investment.
Comparison Table
| Technical Specs | NVIDIA RTX 4080 | NVIDIA RTX 3080 |
|---|---|---|
| GPU | AD103-300 | GA102-200 |
| GPU Cores | 9728 | 8704 |
| TDP | 320 W | 320 W and 350 W |
| RT Cores | 76 | 68 |
| Best Variants | BEST RTX 4080 Cards | BEST RTX 3080 Cards |
Architectural Differences
- Architecture: RTX 4080 adopts the Ada Lovelace architecture, while RTX 3080 utilizes Ampere architecture.
- Process Size: RTX 4080 features a 4nm process node, whereas RTX 3080 employs an 8nm process node.
- VRAM: RTX 4080 features 16GB of GDDR6X memory with a bandwidth of 716.8 GB/s, while RTX 3080 offers 10GB of the same memory type with a bandwidth of 760.3 GB/s.
- Clock Speeds: RTX 4080 boasts a base clock of 2205 MHz and a boost clock of 2505 MHz, surpassing RTX 3080’s base clock of 1440 MHz and boost clock of 1710 MHz.
- Memory Size and Bandwidth: RTX 4080 offers 16GB of memory, while RTX 3080 has 10GB of memory.
You’ll probably notice that the NVIDIA RTX 4080 graphics card is better than the RTX 3080, but it might not be a big enough difference to sway your decision. Nowadays, most people care about getting good value for their money. That’s where this RTX 4080 Vs RTX 3080 comparison comes in to make your life easier.
Gaming Performance Benchmarks
If you are talking about NVIDIA, which is the company most well-known in the world for its graphics cards, and then you want to know the performance of its best GPUs, you have to make them go through some real testing. That’s where 4K gaming benchmarks come in.
- Operating System: Windows 11
- CPU: Intel Core i5-13600K
- Motherboard: MSI Z790 Tomahawk Max WiFi Motherboard
- RAM: XPG Lancer RGB 32GB 7200MHz DDR5 Ram
- SSD: Sabrent Rocket 4 Plus G 2TB NVMe SSD
- CPU Cooler: Deepcool Assassin II CPU Cooler
- Power Supply: ENERMAX REVOLUTION D.F. X 1050W
Forza Horizon 5

- In the Red Dead Redemption 2 benchmark, the RX 6700 XT achieved an average FPS of 78, while the RTX 3070 outperformed it with 89 FPS.
- When examining the 1% lows, the RTX 4080 demonstrated 115 FPS, whereas the RTX 3080 delivered 83 FPS, resulting in a 32 FPS advantage for the RTX 4080.
God of War

- In this gaming session of God of War, the RTX 4080 achieves an average FPS of 107, surpassing the RTX 3080’s 75 FPS by a significant margin of 42%.
- Here the RTX 4080 exhibited a 1% low of 98 FPS, showcasing a superior performance compared to the RTX 3080’s 70 FPS, with a difference of 28 FPS.
Grand Theft Auto V

Spider-Man

- Moving to Spider-Man, the RTX 4080 showcased 110 FPS on average, surpassing the RTX 3080’s performance of 78 FPS by 34%.
- When examining the 1% lows, the RTX 4080 demonstrated 102 FPS, whereas the RTX 3080 delivered 72 FPS.
Assassin’s Creed Valhalla

- Continuing with Assassin’s Creed Valhalla, the RTX 4080 displayed 98 average FPS, outperforming the RTX 3080’s 66 FPS, with a notable difference of 39%.
- Moreover, the RTX 4080 exhibited a 1% low of 88 FPS, showcasing a superior performance compared to the RTX 3080’s 56 FPS, with a difference of 44%.
Overall Gaming Performance
| Featured | RTX 4080 | RTX 3080 |
|---|---|---|
| Average FPS | 115📈 | 81.8📈 |
| %1 lows | 103.6📉 | 74.8📉 |
| Winner: Nvidia's RTX 4080 | ||
When putting the RTX 4080 against the RTX 3080 in frame production tests, the 4080 maintains a significant lead, boasting an average FPS of 115 compared to the 3080’s 81.8 FPS across five demanding games. This translates to around a 41% improvement over the RTX 3080.
Power Consumption
| Featured | RTX 4080 (W) | RTX 3080 (W) |
|---|---|---|
| Average Power Consumption | 296⚡️ | 314.8⚡️ |
| Winner: Nvidia's RTX 4080 | ||
At 4K resolution, the RTX 4080 significantly outperforms the RTX 3080 while consuming 296 watts across various games. While the RTX 3080 consumes almost 314.8 watts that is a difference of almost 6%.
Thermal Efficiency
| Featured | RTX 4080 (°C) | RTX 3080 (°C) |
|---|---|---|
| Average Temperature | 68.4🌡️ | 69🌡️ |
| Winner: Nvidia's RTX 4080 | ||
Talking about the overall thermal efficiency, both GPUs maintained optimal temperatures, crucial for longevity. The RTX 4080 showcased superior thermal efficiency compared to the RTX 3080, both staying below 70°C. The difference is negligible.
Pricing And Availability
| GPU | MSRP | Current Price |
|---|---|---|
| NVIDIA RTX 4080 | 💲1199 | 💲1110 |
| NVIDIA RTX 3080 | 💲699 | 💲450 |
| Difference | 52% | 84% |
The RTX 4080 is available on online platforms like Newegg, for almost 1110 USD. That’s a huge price difference of 84% when you compare it to the current RTX 3080, which is only 450 USD.
Final Verdict – What We Recommend?
NVIDIA RTX 4080: With a remarkable performance boost of around 40% in FPS across various games compared to the RTX 3080, particularly evident at 4K settings, the RTX 4080 emerges as a top-tier choice for gamers seeking unparalleled gaming experiences. Its superior efficiency is demonstrated by lower temperatures and approximately 4% less power consumption than the RTX 3080.
NVIDIA RTX 3080: While the RTX 3080 delivers commendable performance, it falls short in comparison to the RTX 4080, particularly in terms of FPS and efficiency. Nevertheless, with its relatively more affordable price tag of $450, the RTX 3080 remains a viable option.
Overall, if you prioritize unparalleled gaming performance and efficiency, the NVIDIA RTX 4080 stands out as the clear winner. However, considering its higher price point, it’s crucial to assess whether the substantial performance boost justifies the increased investment.
More From RTX 3080:
More From RTX 4080:
Thank you! Please share your positive feedback. 🔋
How could we improve this post? Please Help us. 😔
[Comparisons Expert]
Abdemanaf is a skilled creative writer who has been honing his craft since 2011. While initially working in different fields, he found a passion for technology and has been exploring the tech world since early 2015. Over the years, he has developed an in-depth knowledge of the latest tech trends and product offerings by various companies.
Abdemanaf’s writing reflects his analytical mindset and ability to think critically. He has a knack for breaking down complex technical information into easily digestible pieces, making his articles engaging and accessible to readers from all backgrounds. In February 2022, he joined Tech4Gamers as a blog and product comparison writer, where he has been able to hone his skills further.
As a writer, Abdemanaf is dedicated to staying up-to-date with the latest technological advancements and trends, enabling him to provide readers with the most relevant and accurate information. He is always eager to learn more and is constantly seeking new challenges to improve his skills.
Get In Touch: manaf@tech4gamers.com


