 Threads

Intel’s Hybrid Core architecture did wonders for them as their 12th Gen lineup provided comprehensive performance improvements over the 11th Gen CPUs. In this article, I’ll compare the Core i7-1260P vs Core i7-1255U. The former is rated “P” for power efficiency, while the latter is rated “U” for ultra-power efficiency, and I’ll focus on finding the better one for you.
Key Takeaways
- To start, the Core i7-1260P performed 26.3% better in multi-core applications and was 5.2% faster in single-core applications.
- The Core i7-1260P proved 8.8% more power-consuming under load than the Core i7-1255U.
- Price-wise, the Core i7-1260P laptops range from $681-$4909, while the Core i7-1255U laptops cost between $489 and $4629. Overall, the Core i7-1255U has more value than the Core i7-1260P.
Comparison Table
Let’s compare the specifications of the two CPUs to trace the similarities and differences.
| Mobile CPU | Core i7-1260P | Core i7-1255U |
|---|---|---|
| Architecture | Hybrid Core | Hybrid Core |
| Codename | Alder Lake-P | Alder Lake-U |
| Instruction Set | x86-64 | x86-64 |
| Processing Node | Intel 7 (10nm ESF) | Intel 7 (10nm ESF) |
| Socket |
BGA-1744
|
BGA-1744 |
| No. of Cores | 12 (4P + 8E) | 10 (2P + 8E) |
| No. of Threads | 16 (8 + 8) | 12 (4 + 8) |
| Base Clock |
|
|
| Boost Clock |
|
|
| L1 Cache | 80KB per core | 80KB per core |
| L2 Cache | 1280KB per core | 1280KB per core |
| L3 Cache | 18MB (shared) | 12MB (shared) |
| Memory Support |
|
|
| Memory Size | Up to 64GB | Up to 64GB |
| PCIe Revision | 4.0 | 4.0 |
| No. of PCIe Lanes | 20 | 20 |
| Overclocking Support | No | No |
| Integrated Graphics | Intel Iris Xe G7 Graphics | Intel Iris Xe G7 Graphics |
| GPU Base Clock | 300MHz | 300MHz |
| GPU Boost Clock | 1400MHz | 1250MHz |
| No. of Shaders | 768 | 768 |
| No. of TMUs | 48 | 48 |
| No. of ROPs | 24 | 24 |
| No. of Execution Units | 96 | 96 |
| iGPU Theoretical Performance |
1.69 TFLOPs | 1.69 TFLOPs |
| Total Graphics Power | 15W | 15W |
| CPU Max Operating Temperature | 100°C | 100°C |
| CPU Base Power | 20-28W (configurable) | 12-15W (configurable) |
| CPU Boost Power | 64W | 55W |
| Price Range (July 2023) | $681-$4909 | $489 to $4629 |
| Launch Date | February 23, 2022 | February 23, 2022 |
Also Learn: PC Chipsets Explained
Architectural Differences
- Core/Thread Counts: Starting off, the Core i7-1260P has 12 cores with 4 P-cores and 8 E-cores. The Core i7-1255U halves the number of P-cores, totaling 10 cores. As for the thread counts, the Core i7-1260P has 16 while the Core i7-1255U has 12.
- Clock Speeds: The Core i7-1260P boasts higher base frequencies, with 2.1GHz for the P-cores and 1.5GHz for the E-cores. In contrast, the Core i7-1255U clocks 1.7GHz on the P-cores and 1.2GHz on the E-cores. As for boost frequencies, the Core i7-1255U adds an extra 100MHz to the E-core frequency, equaling 3.5GHz.
- Cache: Although both CPUs have the same L1 and L2 cache per core capacities, the Core i7-1260P has more overall cache (1.1MB L1, 10MB L2). This is because it has two extra cores. As for the L3 cache, the Core i7-1260P has an 18MB pool compared to the 12MB of the Core i7-1255U.
- TDP: The Core i7-1255U is more power-efficient, as evident by the U suffix. It has a configurable base TDP of 12-15 watts compared to 20-28 watts of the Core i7-1260P. Additionally, it can draw up to 55 watts on boost frequencies, while the Core i7-1260P can draw as much as 64 watts.
Similar Article: Core i7-12700H Vs Core i7-1255U
Performance: Core i7-1260P Vs Core i7-1255U
Next, here are the performance benchmarks for the two CPUs.
Cinebench R23

- The Core i7-1260P started proceedings with a win in the Cinebench R23 test. It scored 9746 points compared to 8342 scored by the Core i7-1255U.
- In the single-core test, the Core i7-1260P scored 1745 points, 4.8% ahead of the Intel Core i7-1255U.
Geekbench 5
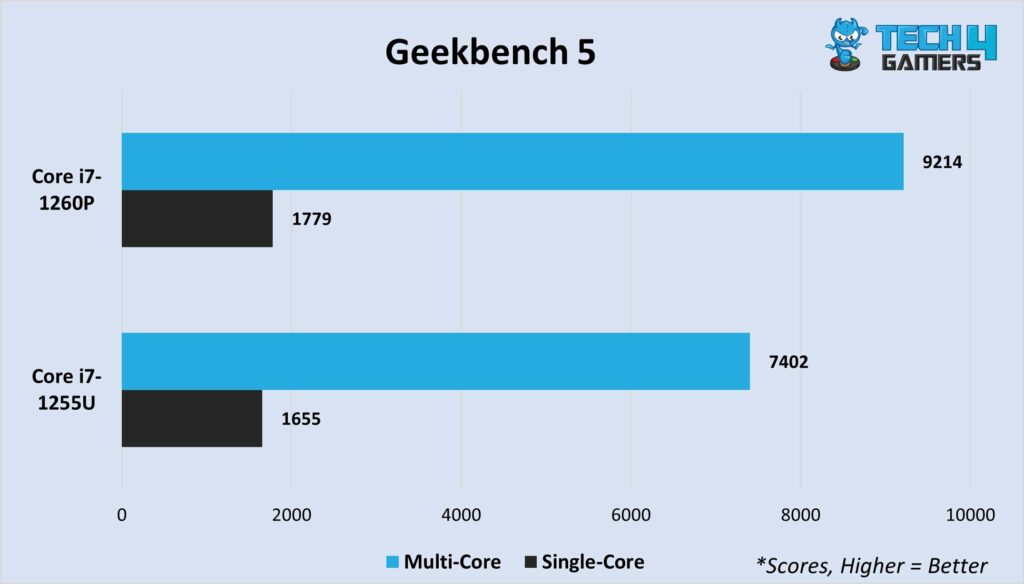
- The next test is Geekbench 5, in which the Core i7-1260P accumulated 9214 multi-core points. In response, the Core i7-1255U scored 7402 points.
- Moving on to the single-core scores, the Core i7-1255U has another narrow win with 1779 points over 1655 points of its rival.
Also Read: HP Envy vs Pavilion
Geekbench 6
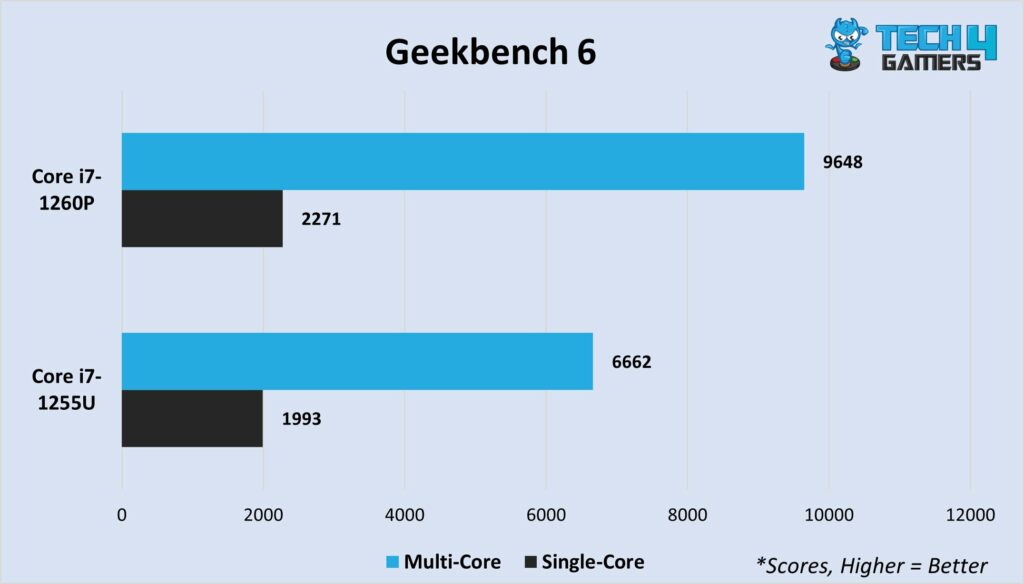
- In Geekbench 6, the Core i7-1260P continues its dominance with 9648 points in the multi-core test. The Intel Core i7-1255U only managed 6662 points, trailing by 44.8%.
- As for the single-core benchmark, the Core i7-1260P recorded 2271 points compared to 1993 of the Core i5-1255U.
Passmark
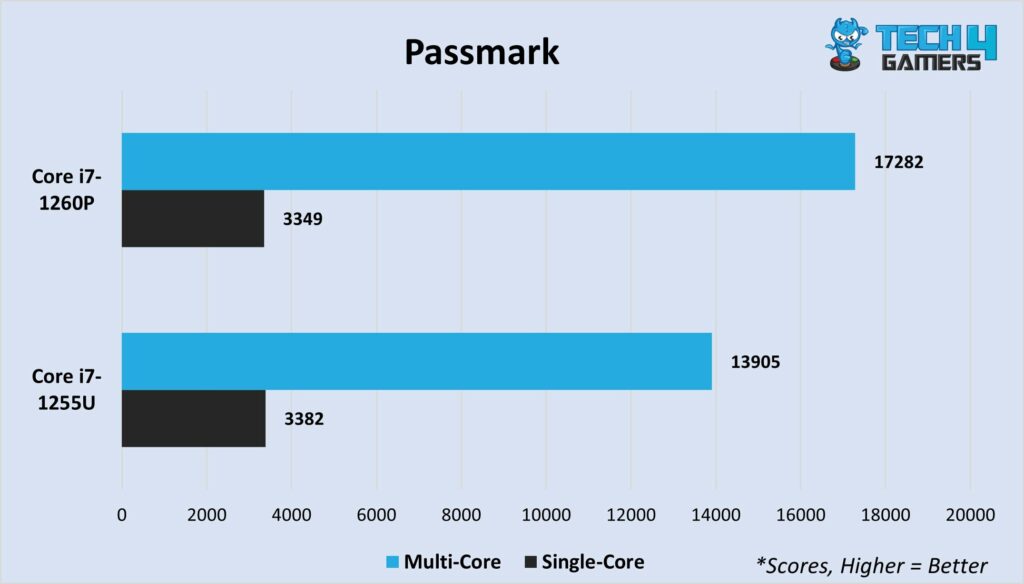
- The next test is Passmark, in which the Core i7-1260P notched up 17282 multi-core points. In comparison, the Core i7-1255U scored 13905 points, 24.2% behind.
- Here, the Core i7-1255U took the lead with 3382 single-core points, leading by nearly 1%.
Another Comparison: Core i7-1255U Vs Core i7-1165G7
Summing Up The Multi-Core And Single-Core Performance
Let’s look at the average multi-core and single-core scores across the four tests.
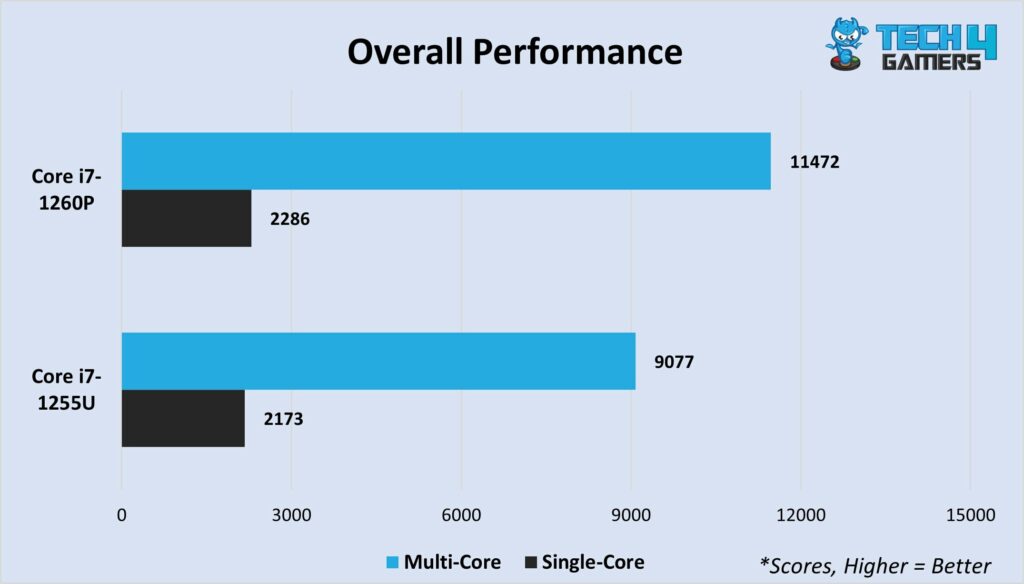
- Multi-core Performance: The Intel Core i7-1260P averaged 11472 points compared to 9077 points across the four tests. Thus, on average, the Core i7-1260P is 26.3% faster in multi-core applications.
- Single-core Performance: In the single-core tests, the Core i7-1260P averaged 2286 points whereas the Core i7-1255U averaged 2173 points. This makes the Core i7-1260P roughly 5.2% faster than the Core i7-1255U in single-core applications.
Learn: How To Benchmark Your Gaming PC/Laptop
Average Power Consumption
Here’s a look at the average power consumption figures at idle and under load.
Reminder: Regarding base TDP, the Core i7-1260P is rated at 20-28 watts, while the Core i7-1255U is rated at 12-15W. As for boost power draw, the Core i7-1260P is rated 64 watts over 55 watts of the Core i7-1255U.
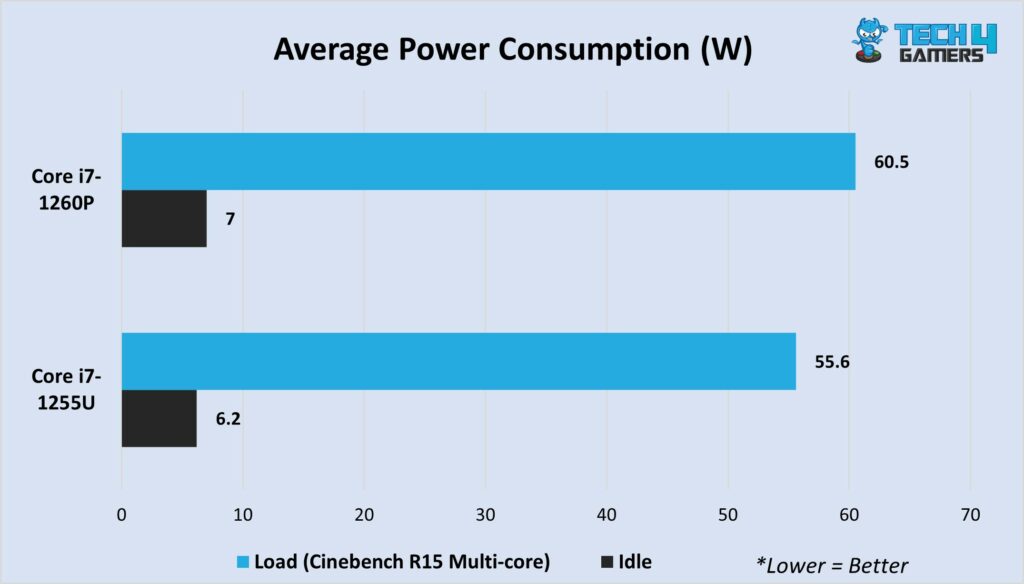
- Idle power consumption: On average, the Core i7-1260P consumed 7 watts while the Intel Core i5-1255U used 6.2 watts.
- Load power consumption: During the Cinebench R15 multi-core stress test, the Core i7-1260P averaged 60.5 watts while the averaged 55.6 watts. So, the Core i7-1255U is approximately 8.8% more power-efficient under loads.
- The Intel Core i7-1255U used 0.6 watts more than it was rated for, while the Core i7-1260P remained under its boost TDP rating.
Read: How To Lower CPU Temperature
Laptop Prices
Next, we’ll go over the laptop prices for the two CPUs.
- Core i7-1260P: Firstly, you can land a Core i7-1260P laptop for as little as $681. If you’re looking for top-selling laptops, your range should be between $824 and $1899. Lastly, if you’re looking for the most premium options, expect to pay up to $4909.
- Core i7-1255U: As for the Core i7-1255U, entry-level laptops start at $489, while the best-sellers are in the $619-$1100 bracket. The most expensive Intel Core i7-1255U laptops can cost a maximum of $4909.
Better Value: Core i7-1255U Vs Core i7-1260P
We can now determine the better value CPU. The Core i7-1260P performed 26.3% faster in multi-core tests and 5.2% in single-core tests. Regarding the price difference, entry-level Core i7-1260P laptops cost 39.2% more than Core i7-1255U laptops. On top of this price difference, the Intel Core i7-1260P consumed 8.8% more power under stress.
As the price difference is bigger than the performance difference, and the Core i7-1260P also consumes more power, we conclude that the Core i7-1255U is the better CPU regarding value.
Also Check: How Much Is My PC Worth?
Final Thoughts
You have reached the end of this Core i7-1260P vs Core i7-1255U comparison. After thoroughly comparing the two CPUs, I’ve found that the Core i7-1260P is better performance-wise. However, the Core i7-1255U unarguably provides better value than the Core i7-1255U.
The Core i7-1260P has two extra P-cores and better clock speeds, giving it better multi-core performance. However, there is little difference between the two CPUs in terms of single-core performance. In the end, the Intel Core i7-1260P costs too much in comparison, making it the unideal choice in this comparison.
I hope this guide has been helpful. Similarly, if you’re looking to build a PC, check out this guide.
Pros And Cons
| CPU | Pros | Cons |
|---|---|---|
| Core i7-1260P |
|
|
| Core i7-1255U |
|
|
Pros And Cons: Core i7-1260P vs Core i7-1255U
Thank you! Please share your positive feedback. 🔋
How could we improve this post? Please Help us. 😔
[Comparisons Expert]
Shehryar Khan, a seasoned PC hardware expert, brings over five years of extensive experience and a deep passion for the world of technology. With a love for building PCs and a genuine enthusiasm for exploring the latest advancements in components, his expertise shines through his work and dedication towards this field. Currently, Shehryar is rocking a custom loop setup for his built.
Get In Touch: shehryar@tech4gamers.com


