GuidesComparisonsRTX 4060 Ti Vs RTX 4070 Ti: Gaming & Overall Benchmarks

RTX 4060 Ti Vs RTX 4070 Ti: Gaming & Overall Benchmarks

In this article, we will be inspecting the architecture, performance and specifications of the RTX 4060 Ti and RTX 4070 Ti.

Confused about which card to choose for your rig? Our RTX 4060 Ti vs RTX 4070 Ti comparison is here to help you understand the difference between the two GPUs in detail. Along with discussing their specs and architecture, we’ll test these two in gaming benchmarks to see how they actually perform.

Key Takeaways

  • At the foundation, both the RTX 4070 Ti and RTX 4060 Ti share the Ada Lovelace architecture, providing the framework for their distinct performances.
  • Furthermore, when gauging gaming capabilities, the RTX 4070 Ti surges ahead of the RTX 4060 Ti, showcasing an impressive 46.9% boost in FPS performance.
  • Turning to power efficiency, the RTX 4060 Ti commands attention with its significantly lower power consumption compared to the RTX 4070 Ti, flaunting a notable 35.8% advantage.
  • Lastly, in terms of thermal handling, the RTX 4070 Ti secures the lead over the RTX 4060 Ti, maintaining a 3.9% advantage in lower average temperatures.

Comparison Table

Technical Specs GeForce RTX 4060 Ti GeForce RTX 4070 Ti
GPU Name AD106 AD104
Architecture Ada Lovelace Ada Lovelace
Process Size 5nm 5nm
Transistors 22,900 million 35,800 million
Base Clock 2310 MHz 2310 MHz
Boost Clock 2535 MHz 2610 MHz
CUDA Cores 4352 7680
Tensor Cores 136 240
RT Cores 34 60
TMUs 136 240
ROPs 48 80
L1 Cache 128 KB (per SM) 128 KB (per SM)
L2 Cache 32 MB 48 MB
Memory Size 16GB 12GB
Memory Type GDDR6 GDDR 6X
Memory Bus Width 128 bit 192 bit
Memory Bandwidth 288.0 GB/s 504.2 GB/s
TDP 165W 285W
Suggested PSU 450W 650W
Release Date May 18th, 2023 Jan 3rd, 2023
MSRP 499 USD 799 USD
Best Variants BEST RTX 4060 Ti Cards Best RTX 4070 Ti Cards

Architectural Differences

  1. Process Node: Firstly, both the RTX 4060 Ti and RTX 4070 Ti harness the efficiency of the 5nm process node, showcasing their commitment to cutting-edge manufacturing.
  2. Clock SpeedMoreover, the RTX 4060 Ti enters the arena with a Base Clock of 2310 MHz and a Boost Clock of 2535 MHz, closely mirroring the RTX 4070 Ti’s Base Clock of 2310 MHz and Boost Clock of 2610 MHz.
  3. VRAM: Additionally, the RTX 4060 Ti introduces a substantial 16GB GDDR6 VRAM, whereas the RTX 4070 Ti advances with 12GB of faster GDDR6X VRAM.
  4. TDP: Furthermore, in the power realm, the RTX 4060 Ti operates with a more conservative 165W TDP, distinguishing itself from the RTX 4070 Ti’s higher 285W TDP.
  5. Supported Technologies: Finally, both the RTX 4070 Ti and RTX 4060 Ti arrive equipped with DLSS technology, underscoring their dedication to elevating visual fidelity through advanced upscaling capabilities.

Also Read: RTX 4060 Ti Vs RTX 2080 Ti

RTX 4060 Ti Vs RTX 4070 Ti: Gaming Benchmarks

Now, it’s time to dive into the gaming benchmarks to see the performance difference between the two GPUs. Across the spectrum of FPS, power consumption, thermal management, and 1% lows, we’ve subjected these GPUs to rigorous testing to unveil the ultimate gaming experience they deliver.

Testing Rig

Here are the specs of the testing rig:

  • CPU: AMD Ryzen 9 5900X
  • Motherboard: MSI X570 A Pro Gaming
  • Memory: Crucial RAM 32 GB (4×8) DDR4 Dual Channel 3600 Mhz CL 16
  • Power Supply: Gigabyte P850GM 850W
  • CPU Cooler: AIO MarsGaming ML-ONE360 Black
  • Storage Drive: SAMSUNG 970 EVO M.2 2280 1TB
  • Operating System: Windows 10 Pro

Note: It’s important to acknowledge various external factors, such as game optimizations, cooling solutions, and the specific resolution settings utilized, can influence those benchmark test outcomes. Considering these variables is vital for comprehensively and precisely evaluating the performance data at hand.

Similar Comparison: RTX 4060 Ti Vs RX 6750 XT

Without further ado, let’s dive headfirst into the gaming benchmarks and thoroughly compare the gaming performance showcased by the RTX 4060 Ti and RTX 4070 Ti.

Dead Space

Dead Space
Dead Space 1440p Gaming Benchmarks – Image Credits (Tech4Gamers)
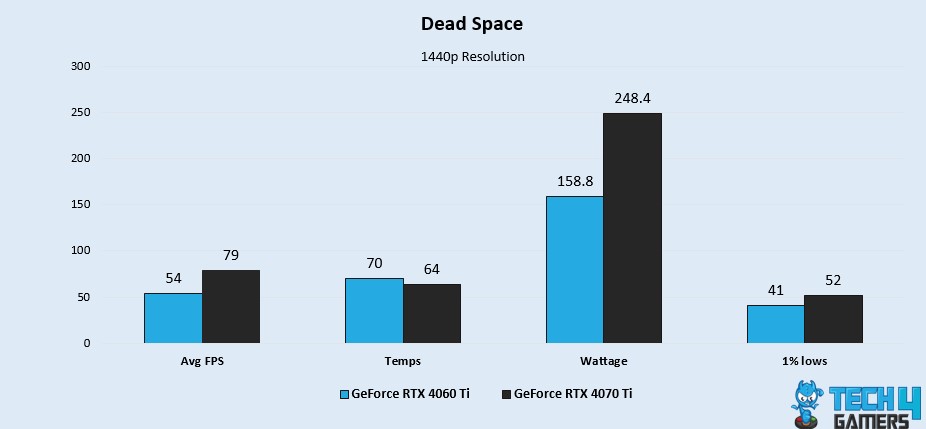
  • Impressively, the RTX 4070 Ti emerges with a notable lead of 37.5%, exhibiting an average FPS of 79, compared to the RTX 4060 Ti’s performance at 54.
  • Evidently, the RTX 4070 Ti shines with an 8.9% advantage in thermal efficiency, maintaining an average temperature of 64°C, as opposed to the RTX 4060 Ti’s average temperature of 70°C.
  • Surprisingly, the RTX 4060 Ti takes the lead in power efficiency, consuming 221.3W, showcasing a 44% advantage over the RTX 4070 Ti’s consumption of 158.8W.
  • One more time, the RTX 4070 Ti shines in 1% low performance, boasting an outstanding 23.6% lead with a 1% low of 52 FPS, surpassing the RTX 4060 Ti’s performance of 41 FPS.

Similar Read: RTX 4060 Ti Vs RX 6600

Star Wars Jedi Survivor

Star Wars Jedi Survivor
Star Wars Jedi Survivor 1440p Gaming Benchmarks – Image Credits (Tech4Gamers)
  • An attention-worthy distinction emerges as the RTX 4070 Ti exhibits a substantial 43% advantage in average FPS, delivering 79 FPS, while the RTX 4060 Ti reaches 51 FPS.
  • Notably, the RTX 4070 Ti showcases its superior thermal efficiency with an average temperature of 66°C, presenting a remarkable 5.8% cooler operation than the RTX 4060 Ti, which averages 70°C.
  • It’s worth noting that the RTX 4060 Ti excels with a 23.4% advantage in power efficiency, consuming 158.1W, while the RTX 4070 Ti’s consumption stands at 200.1W.
  • Impressively, the RTX 4070 Ti demonstrates a remarkable 40% advantage in 1% low performance, recording a 1% low of 51 FPS, as opposed to the RTX 4060 Ti’s performance of 34 FPS.

Dead Island 2

Dead Island 2
Dead Island 2 1440p Gaming Benchmarks – Image Credits (Tech4Gamers)
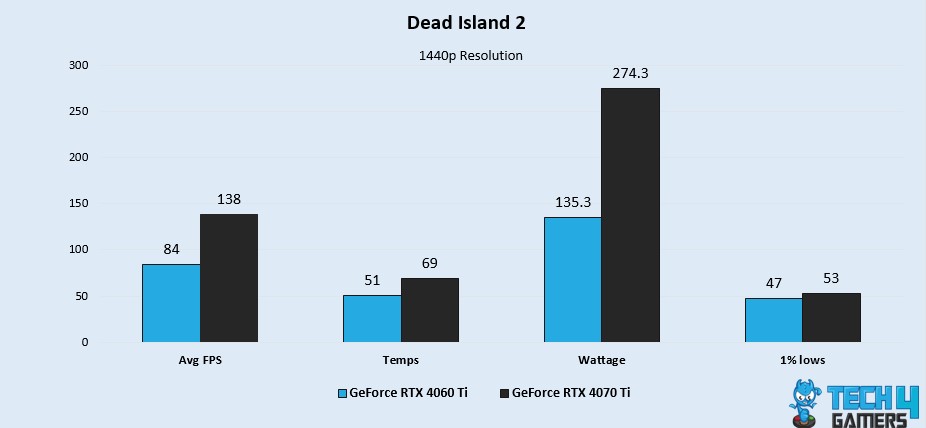
  • Distinguished by its performance, the RTX 4070 Ti marks a significant 48.6% lead with an average FPS of 138, contrasting the RTX 4060 Ti’s 84 FPS performance.
  • Distinctly marked by a 30% difference, the RTX 4070 Ti takes the fall in thermal efficiency, registering an average temperature of 69°C, while the RTX 4060 Ti records a lower average of 51°C.
  • Significantly, the RTX 4060 Ti asserts its superiority with a substantial 67.8% lead in power efficiency, registering a consumption of 135.3W, in contrast to the RTX 4070 Ti’s higher consumption of 274.3W.
  • Similar to the average FPS, the RTX 4070 Ti takes the lead with a 12% difference in 1% low performance, achieving a 1% low of 53 FPS, while the RTX 4060 Ti reaches 47 FPS.

Also Read: RTX 4060 Ti Vs RTX 3060

Redfall

Redfall
Redfall 1440p Gaming Benchmarks – Image Credits (Tech4Gamers)
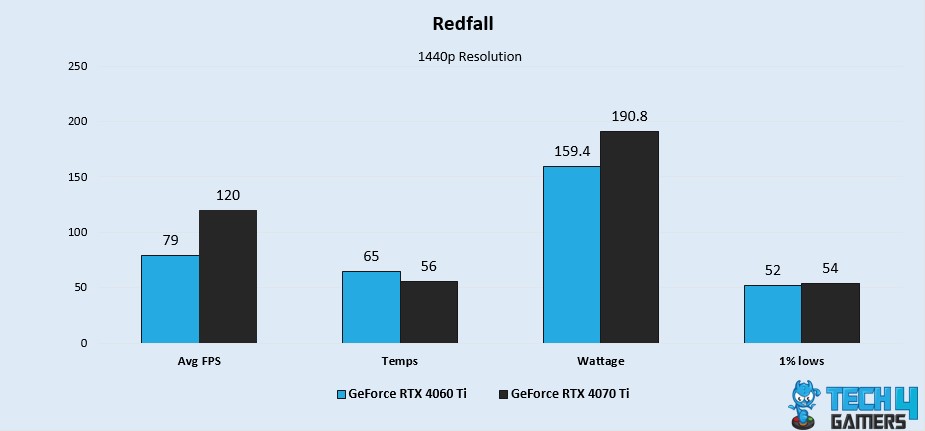
  • The RTX 4070 Ti takes center stage with a notable 41.2% lead in average FPS, registering 120 FPS, while the RTX 4060 Ti trails at 79 FPS.
  • Demonstrating its thermal advantage, the RTX 4070 Ti presents a noteworthy 14.8% cooler operation with an average temperature of 56°C, in contrast to the RTX 4060 Ti’s 65°C.
  • Showcasing its efficiency edge, the RTX 4060 Ti secures a 17.9% lead, consuming 159.4W, compared to the RTX 4070 Ti’s consumption of 190.8W.
  • Significantly, the RTX 4070 Ti excels with a 3.7% advantage in 1% low performance, maintaining a 1% low of 54 FPS, as compared to the RTX 4060 Ti’s 52 FPS.

Fortnite
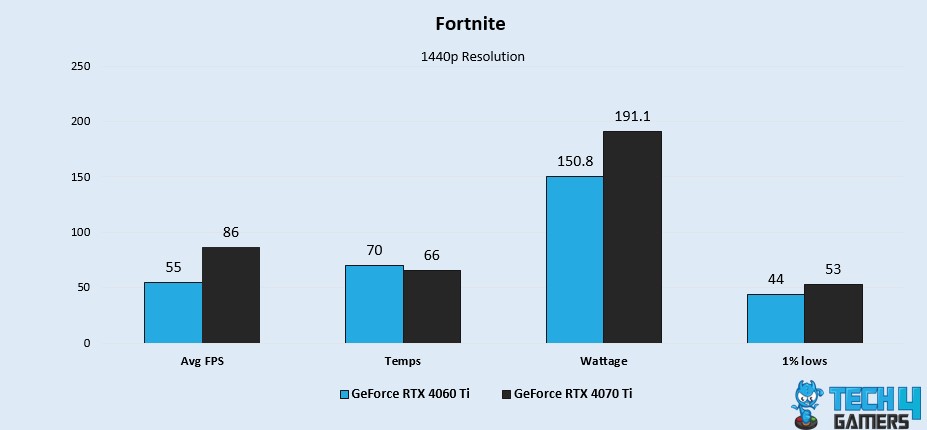
Fortnite
Fortnite 1440p Gaming Benchmarks – Image Credits (Tech4Gamers)
  • In the realm of average FPS, the RTX 4070 Ti establishes its prowess with a remarkable 43.9% advantage, reaching 86 FPS, while the RTX 4060 Ti attains 55 FPS.
  • Significantly, the RTX 4070 Ti asserts a 5.8% advantage in thermal efficiency, maintaining an average temperature of 66°C, as the RTX 4060 Ti records a slightly warmer 70°C on average.
  • Notably, the RTX 4060 Ti establishes its power efficiency with a 23.5% advantage, consuming 150.8W, while the RTX 4070 Ti consumes 191.1W.
  • Moreover, the RTX 4070 Ti asserts a strong 18.5% advantage in 1% low performance, registering a 1% low of 53 FPS, while the RTX 4060 Ti achieves a 44 FPS.

Similar Read: RTX 4060 Ti Vs RTX 3080

Call Of Duty Modern Warfare 2

Call of Duty Modern Warfare 2
Call of Duty Modern Warfare 2 1440p Gaming Benchmarks – Image Credits (Tech4Gamers)
  • Highlighting its strength, the RTX 4070 Ti emerges with a clear 33.5% lead in average FPS, showcasing 108 FPS, compared to the RTX 4060 Ti’s 77 FPS.
  • Impressively, the RTX 4070 Ti secures its lead with a thermal advantage of 10.2%, achieving an average temperature of 65°C, while the RTX 4060 Ti averages 72°C.
  • Distinguished by its efficiency, the RTX 4060 Ti showcases a remarkable 45.7% advantage, consuming 153.9W, as compared to the RTX 4070 Ti’s consumption of 245.1W.
  • Demonstrating its prowess, the RTX 4060 Ti secures a 9.9% lead in 1% low performance, achieving a 1% low of 53 FPS in comparison to the RTX 4070 Ti’s 48 FPS.

The Witcher 3

The Witcher 3
The Witcher 3 1440p Gaming Benchmarks – Image Credits (Tech4Gamers)
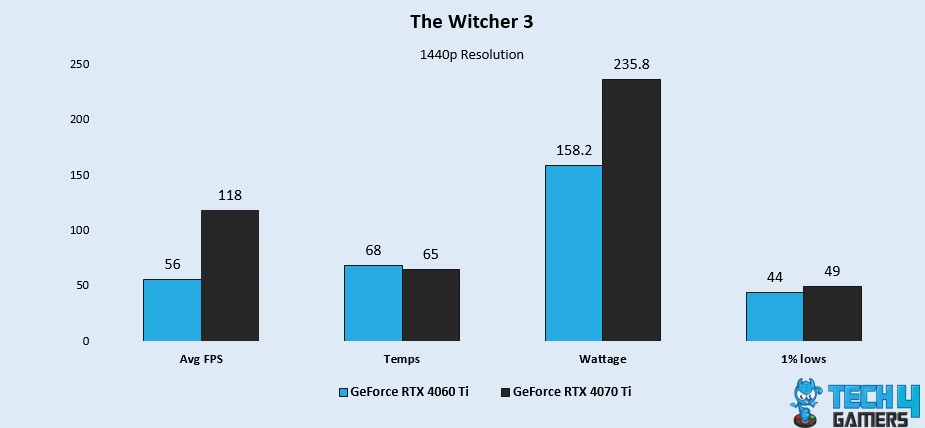
  • Unveiling its performance edge, the RTX 4070 Ti commands a substantial 71.2% lead in average FPS, achieving 118 FPS, while the RTX 4060 Ti delivers 56 FPS.
  • With a 4.5% advantage, the RTX 4070 Ti showcases its thermal efficiency by maintaining an average temperature of 65°C, while the RTX 4060 Ti’s average temperature is 68°C.
  • Moreover, using a 39.3% lead, the RTX 4060 Ti presents its efficiency prowess by consuming 158.2W, while the RTX 4070 Ti consumes 235.8W.
  • In addition, showcasing a 10.7% advantage, the RTX 4070 Ti proves its better 1% low performance, recording a 1% low of 49 FPS, while the RTX 4060 Ti achieves 44 FPS.

Similar Comparison: RTX 4060 Ti Vs RTX 3070

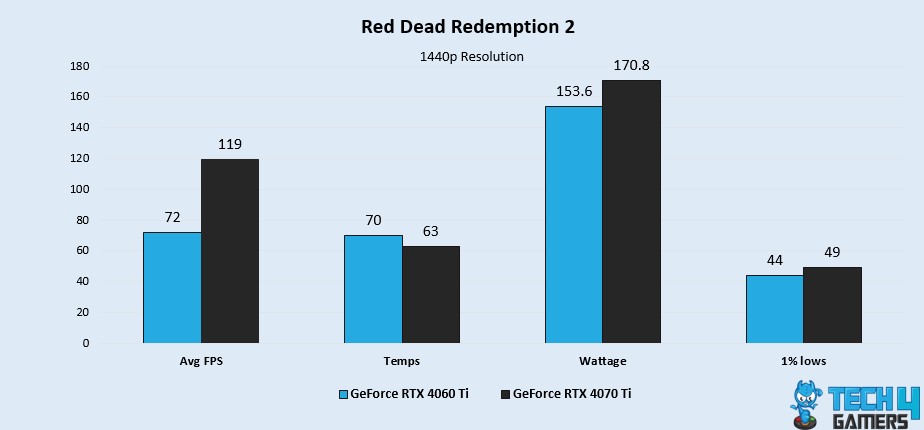
Red Dead Redemption 2

Red Dead Redemption 2
Red Dead Redemption 2 1440p Gaming Benchmarks – Image Credits (Tech4Gamers)
  • In terms of performance, the RTX 4070 Ti shines with a 49.2% lead in average FPS, presenting 119 FPS, while the RTX 4060 Ti reaches 72 FPS.
  • It’s worth noting that the RTX 4070 Ti demonstrates a 10.5% lead in thermal efficiency, boasting an average temperature of 63°C, while the RTX 4060 Ti averages 70°C.
  • Furthermore, it’s important to highlight that the RTX 4060 Ti maintains an efficiency lead of 10.6%, consuming 153.6W, while the RTX 4070 Ti consumes 170.8W.
  • Notably, both cards exhibit a 1% low of 49 FPS vs 44 FPS, showcasing a similar 10.7% advantage for the RTX 4070 Ti over the RTX 4060 Ti’s performance.

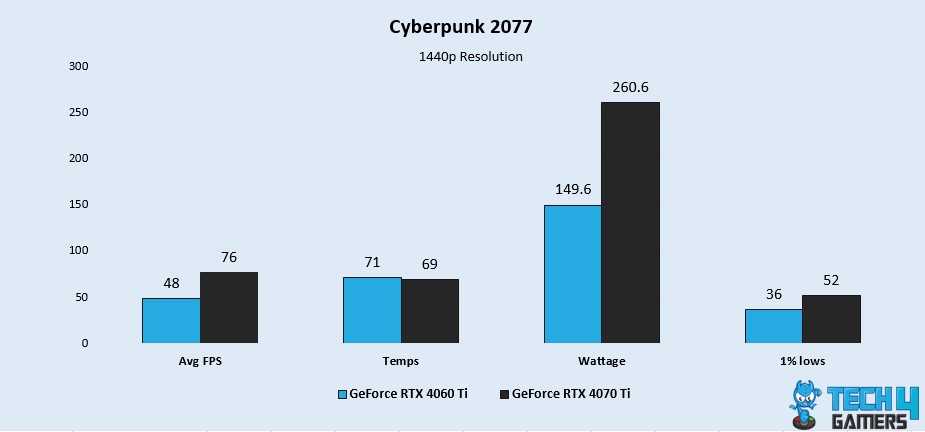
Cyberpunk 2077
Cyberpunk 2077
Cyberpunk 2077 1440p Gaming Benchmarks – Image Credits (Tech4Gamers)
  • A performance distinction is evident as the RTX 4070 Ti establishes a 45.1% lead in average FPS, achieving 76 FPS, while the RTX 4060 Ti achieves 48 FPS.
  • Notably, the RTX 4070 Ti excels with a 2.8% lead in thermal efficiency, recording an average temperature of 69°C, as compared to the RTX 4060 Ti’s 71°C average.
  • Remarkably, the RTX 4060 Ti excels with a 54.1% advantage in power efficiency, consuming 149.6W, as compared to the RTX 4070 Ti’s consumption of 260.6W.
  • Once more, the RTX 4070 Ti stands out with a 36.3% lead in 1% low performance, achieving a 1% low of 52 FPS, while the RTX 4060 Ti reaches 36 FPS.

Also Read: RTX 4060 Ti vs RTX 3070 Ti

Total War Warhammer 3

Total War Warhammer 3
Total War Warhammer 3 1440p Gaming Benchmarks – Image Credits (Tech4Gamers)
  • Significantly, the RTX 4070 Ti takes the lead with a remarkable 52.8% advantage in average FPS, securing 110 FPS, while the RTX 4060 Ti achieves 64 FPS.
  • The RTX 4070 Ti establishes its thermal advantage with a 2.9% difference, achieving an average temperature of 67°C, while the RTX 4060 Ti reaches an average temperature of 69°C.
  • In the realm of power efficiency, the RTX 4060 Ti demonstrates its lead with an 18.2% advantage, consuming 159.2W, while the RTX 4070 Ti consumes 191.2W.
  • While going over the 1% low performance, the RTX 4070 Ti demonstrates a strong 18.5% advantage, achieving a 1% low of 53 FPS, as compared to the RTX 4060 Ti’s performance of 44 FPS.

Overall Gaming Performance

Overall Gaming Performance
Overall Gaming Performance 1440p Gaming Benchmarks – Image Credits (Tech4Gamers)

In the realm of gaming, it all boils down to the numbers that truly matter – average FPS. Join us as we delve into a variety of game titles to unearth how the RTX 4060 Ti and RTX 4070 Ti stack up against each other in terms of raw gaming power. Let’s dissect the data and reveal the gaming dominance that these GPUs bring to the table.

  • When analyzing gaming performance, the RTX 4070 Ti emerges as the unequivocal winner, offering elevated average FPS and better 1% lows in contrast to the RTX 4060 Ti.
  • Additionally, the RTX 4070 Ti solidifies its gaming prowess with an outstanding average FPS of 103.3, eclipsing the RTX 4060 Ti’s average FPS of 64.
  • In a direct comparison, the RTX 4070 Ti attains victory by showcasing its better gaming performance, boasting an impressive 46.9% lead in FPS over the RTX 4060 Ti.

Similar Read: RTX 4070 Vs RTX 4070 Ti

Average Power Consumption

Average Power Consumption
Average Power Consumption 1440p Gaming Benchmarks – Image Credits (Tech4Gamers)

Power consumption isn’t just an abstract figure; it directly impacts your gaming experience. With our focus on real-world usage, we take a deep dive into the average power consumption of the RTX 4060 Ti and RTX 4070 Ti. Brace yourselves as we uncover the energy efficiency that drives these graphics powerhouses and its implications for your gaming setup.

  • Starting off, the RTX 4060 Ti establishes itself as a power consumption benchmark, asserting its supremacy over the RTX 4070 Ti in this domain.
  • Impressively, the RTX 4070 Ti registers a power consumption of 220.8W, whereas the RTX 4060 Ti showcases a lower consumption of 153.6W.
  • With a significant 35.8% power efficiency advantage, the RTX 4060 Ti takes the lead in outperforming the RTX 4070 Ti in power consumption optimization.

Similar Comparison: RTX 4070 Ti Vs RTX 3090

Average Thermal Statistics

Average Thermal Statistics
Average Thermal Statistics 1440p Gaming Benchmarks – Image Credits (Tech4Gamers)

Staying cool under pressure is crucial for optimal performance. Join us as we explore the average thermal statistics of the RTX 4060 Ti vs RTX 4070 Ti comparison. Through meticulous testing, we’ll unveil the thermal dynamics that dictate the stability and sustainability of these GPUs, giving you insights into the cooling prowess that ensures your gaming sessions remain smooth and uninterrupted.

  • Firstly, the RTX 4070 Ti shines in thermal efficiency, outperforming the RTX 4060 Ti by effectively managing temperatures for optimal performance and longevity.
  • Moreover, the RTX 4070 Ti’s ability to maintain an average temperature of 65°C is an impressive feat that stands in contrast to the RTX 4060 Ti’s average temperature of 67.6°C.
  • Setting a notable benchmark, the RTX 4070 Ti exhibits a significant 3.9% improvement in thermal efficiency, positioning it as a frontrunner when compared to the RTX 4060 Ti.

Also Read: RTX 4070 Ti Vs RX 7900 XT

Pricing And Availability

Navigating the landscape of pricing and availability for the RTX 4060 Ti and RTX 4070 Ti graphics cards unveils a significant divergence in their financial profiles. The RTX 4070 Ti enters the market with a price tag of around 799 USD, making a bold statement in the upper echelons of performance.

In contrast, the RTX 4060 Ti comes in at a relatively more accessible price point of approximately 499 USD, representing an option that offers a blend of performance and value. This translates to a substantial price difference of 46.2%, potentially swaying decisions for those considering both options.

Understanding the differences in pricing within the realm of graphics cards is pivotal, considering the dynamic nature of the market. Factors like regional variations, ongoing promotions, and demand fluctuations can influence consumers’ final prices.

Furthermore, this notable price distinction of 46.2% could influence the decision-making process, inviting users to weigh performance against budget constraints and assess which card aligns more closely with their needs and aspirations.

More From RTX 4070 Ti: RTX 4070 Ti Vs RX 7900 XTX

RTX 4070 Ti Vs RTX 4060 Ti: Which One To Buy?

  • Starting with a price difference of 46.2%, the RTX 4060 Ti presents itself as a budget-friendly option. On the performance front, the RTX 4070 Ti takes the lead with an impressive 46.9% advantage.
  • In addition, the RTX 4060 Ti gains a notable 35.8% edge in power efficiency, while the RTX 4070 Ti maintains a modest 3.9% advantage in temperature control.
  • In conclusion, the RTX 4070 Ti stands out for its remarkable FPS performance and efficient thermal management, whereas the RTX 4060 Ti offers a blend of cost efficiency and power optimization.

Also Read: RTX 4070 Ti Vs RTX 3080

Pros And Cons

GPU Pros Cons
GeForce RTX 4060 Ti
  • Embraces a compact dual-slot design, striking a balance between form and function.
  • Applauded for its DLSS 3 and Frame Generation support, elevating visual quality and performance.
  • Lacks support for DisplayPort 2.0, omitting access to cutting-edge display technologies.
GeForce RTX 4070 Ti
  • Praised for delivering a significant leap in generational performance
  • Recognized for its exceptional efficiency, making it a compelling choice
  • Highlighted the limitation of 12GB memory, which may impact performance

FAQs

How does the gaming performance of the RTX 4060 Ti compare to the RTX 4070 Ti?

The RTX 4070 Ti outperforms the RTX 4060 Ti with a remarkable 46.9% improvement in average FPS, making it the superior choice for enhanced gaming experiences.

What is the main difference in power consumption between the RTX 4060 Ti and RTX 4070 Ti?

The RTX 4060 Ti demonstrates its efficiency with a notable 35.8% advantage in power efficiency over the RTX 4070 Ti.

How does the thermal management compare between the RTX 4060 Ti and RTX 4070 Ti?

The RTX 4070 Ti showcases its thermal superiority by maintaining average temperatures that are 3.9% lower than those of the RTX 4060 Ti.


More From RTX 4070 Ti

Was our article helpful? 👨‍💻

Thank you! Please share your positive feedback. 🔋

How could we improve this post? Please Help us. 😔

Related articles

Core i9 14900K Vs Ryzen 9 7900X3D: 5 Games Tested

Does the top dog of the new 14th-gen CPUs hold up to the best Ryzen processor for gaming? Find out in our Core i9 14900K vs Ryzen 9 7900X3D comparison.

Core i9 14900K Vs Ryzen 9 7900X: A Battle of Titans

This article will compare the Core i9 14900K vs Ryzen 9 7900X to see whether the newer Intel processors pack a punch.

RTX 2060 Vs GTX 1660 Ti [We Tested 11 Games]

In this GeForce RTX 2060 vs GTX 1660 Ti comparison, we will test the old cards from NVIDIA and check which one performs better.

Core i7-14700K Vs Core i7-13700K: Should You Upgrade?

In this article, we will be putting Intel's lineup to the test by benchmarking the Core i7-14700k Vs Core i7-13700K.

Core i7-14700K Vs Ryzen 7 7800X3D [We Tested 11 Games]

In this article, we will be exploring the battle of the Core i7-14700K Vs Ryzen 7 7800X3D in order to crown a winner between them.

Similar Guides