

The Radeon RX 7900 XT is one of AMD’s ultimate graphics cards now available, and the Radeon RX 6800 XT is among the best graphics cards of the year 2020. Both graphics cards were enhanced with the most updated and top architectures and technologies of AMD available at the development time. In Radeon RX 7900 XT vs RX 6800 XT, I will discuss the explicit details, features, and performance in demanding games of each GPU.
Key Takeaways
- The Radeon RX 7900 XT comes with the latest RDNA 3 architecture and NAVI 31 chip, while the Radeon RX 6800 XT has the RDNA 2 architecture and NAVI 21 chip.
- As per my evaluation, the overall gaming performance of the Radeon RX 7900 XT is ~ 35-40% better than that of the Radeon RX 6800 XT.
- Regarding power efficiency, I noticed that the RX 7900 XT consumes much more power, and the Radeon RX 6800 XT is about 73.8% more energy efficient in gaming.
- As per my observation, the RX 7900 XT is thermally 8% more efficient than the Radeon RX 6800 XT in gaming.
- As stated by the manufacturer’s recommended retail price, the Radeon RX 6800 XT is $150 cheaper than the Radeon RX 7900 XT.
Comparison Table
| Feature | Radeon RX 7900 XT | Radeon RX 6800 XT |
| Architecture | RDNA 3 | RDNA 2 |
| Design Chip | Navi 31 | Navi 21 |
| Product Family | AMD Radeon RX 7000 Series | AMD Radeon RX 6000 Series |
| Steam Processors | 5376 | 4608 |
| Shader Engines | 6 | 0 |
| Compute Units | 84 | 72 |
| Ray Accelerators | 84 | 72 |
| ROPs | 192 | 128 |
| Game Frequency | 2000 MHz | 2015 MHz |
| Boost Frequency | Up to 2400 MHz | Up to 2215 MHz |
| Memory Type | GDDR6 | GDDR6 |
| Memory Size | 20GB | 16GB |
| Memory Speed | 20 Gbps | 16 Gbps |
| Required Power | 315W | 300W |
| Best Variants | Best RX 7900 XT | Best RX 6800 XT Cards |
Architectural Details
- Process Node: The chip used in the fabrication of AMD RX 7900 XT is the latest NAVI 31, while at the fabrication time of RX 6800 XT, the NAVI 21 chip was among the top and latest chips and was employed in the fabrication of RX 6800 XT. The chip has a die size of 520 mm² and contains 26,800 million transistors.
- Clock Speed: The base clock of AMD RX 7900 XT is 2000 MHz, while the base clock of Radeon RX 6800 XT is 2015 MHz. However, when it comes to turbo clocks, the maximum frequency of the RX 7900 XT is up to 2400 MHz, while the RX 6800 XT has a top clock of up to 2250 MHz.
- VRAM: The memory type of both RX 6800 XT and RX 7900 XT is the same GDDR6. The memory size of RX 7900 XT is 20GB, while that of RX 6800 XT is 16GB.
- Rendering Formats: In rendering formats, both graphics cards provide multiple options. The Radeon RX 7900 XT supports the AV1 encode, while the Radeon RX 6800 XT does not support the AV1 encode.
Gaming Benchmarks
The gaming execution is a fundamental differentiating factor in the performance comparison of two graphics cards. To better understand the gaming capabilities of both graphics cards, I will compare their performance in the following resolution.
Testing PC Specifications
- CPU: Core i7 14700KF
- Motherboard: MSI MEG Z790 ACE MAX Motherboard Review
- SSD: XPG GAMMIX S70 BLADE 2TB NVMe
- CPU Cooler: Arctic Liquid Freezer II 420 – AIO Water Cooler
- PSU: ENERMAX REVOLUTION D.F. X 1050W
- RAM: XPG Lancer RGB 32GB 7200MT/s DDR5
- OS: Windows 11
A Plague Tale: Requiem
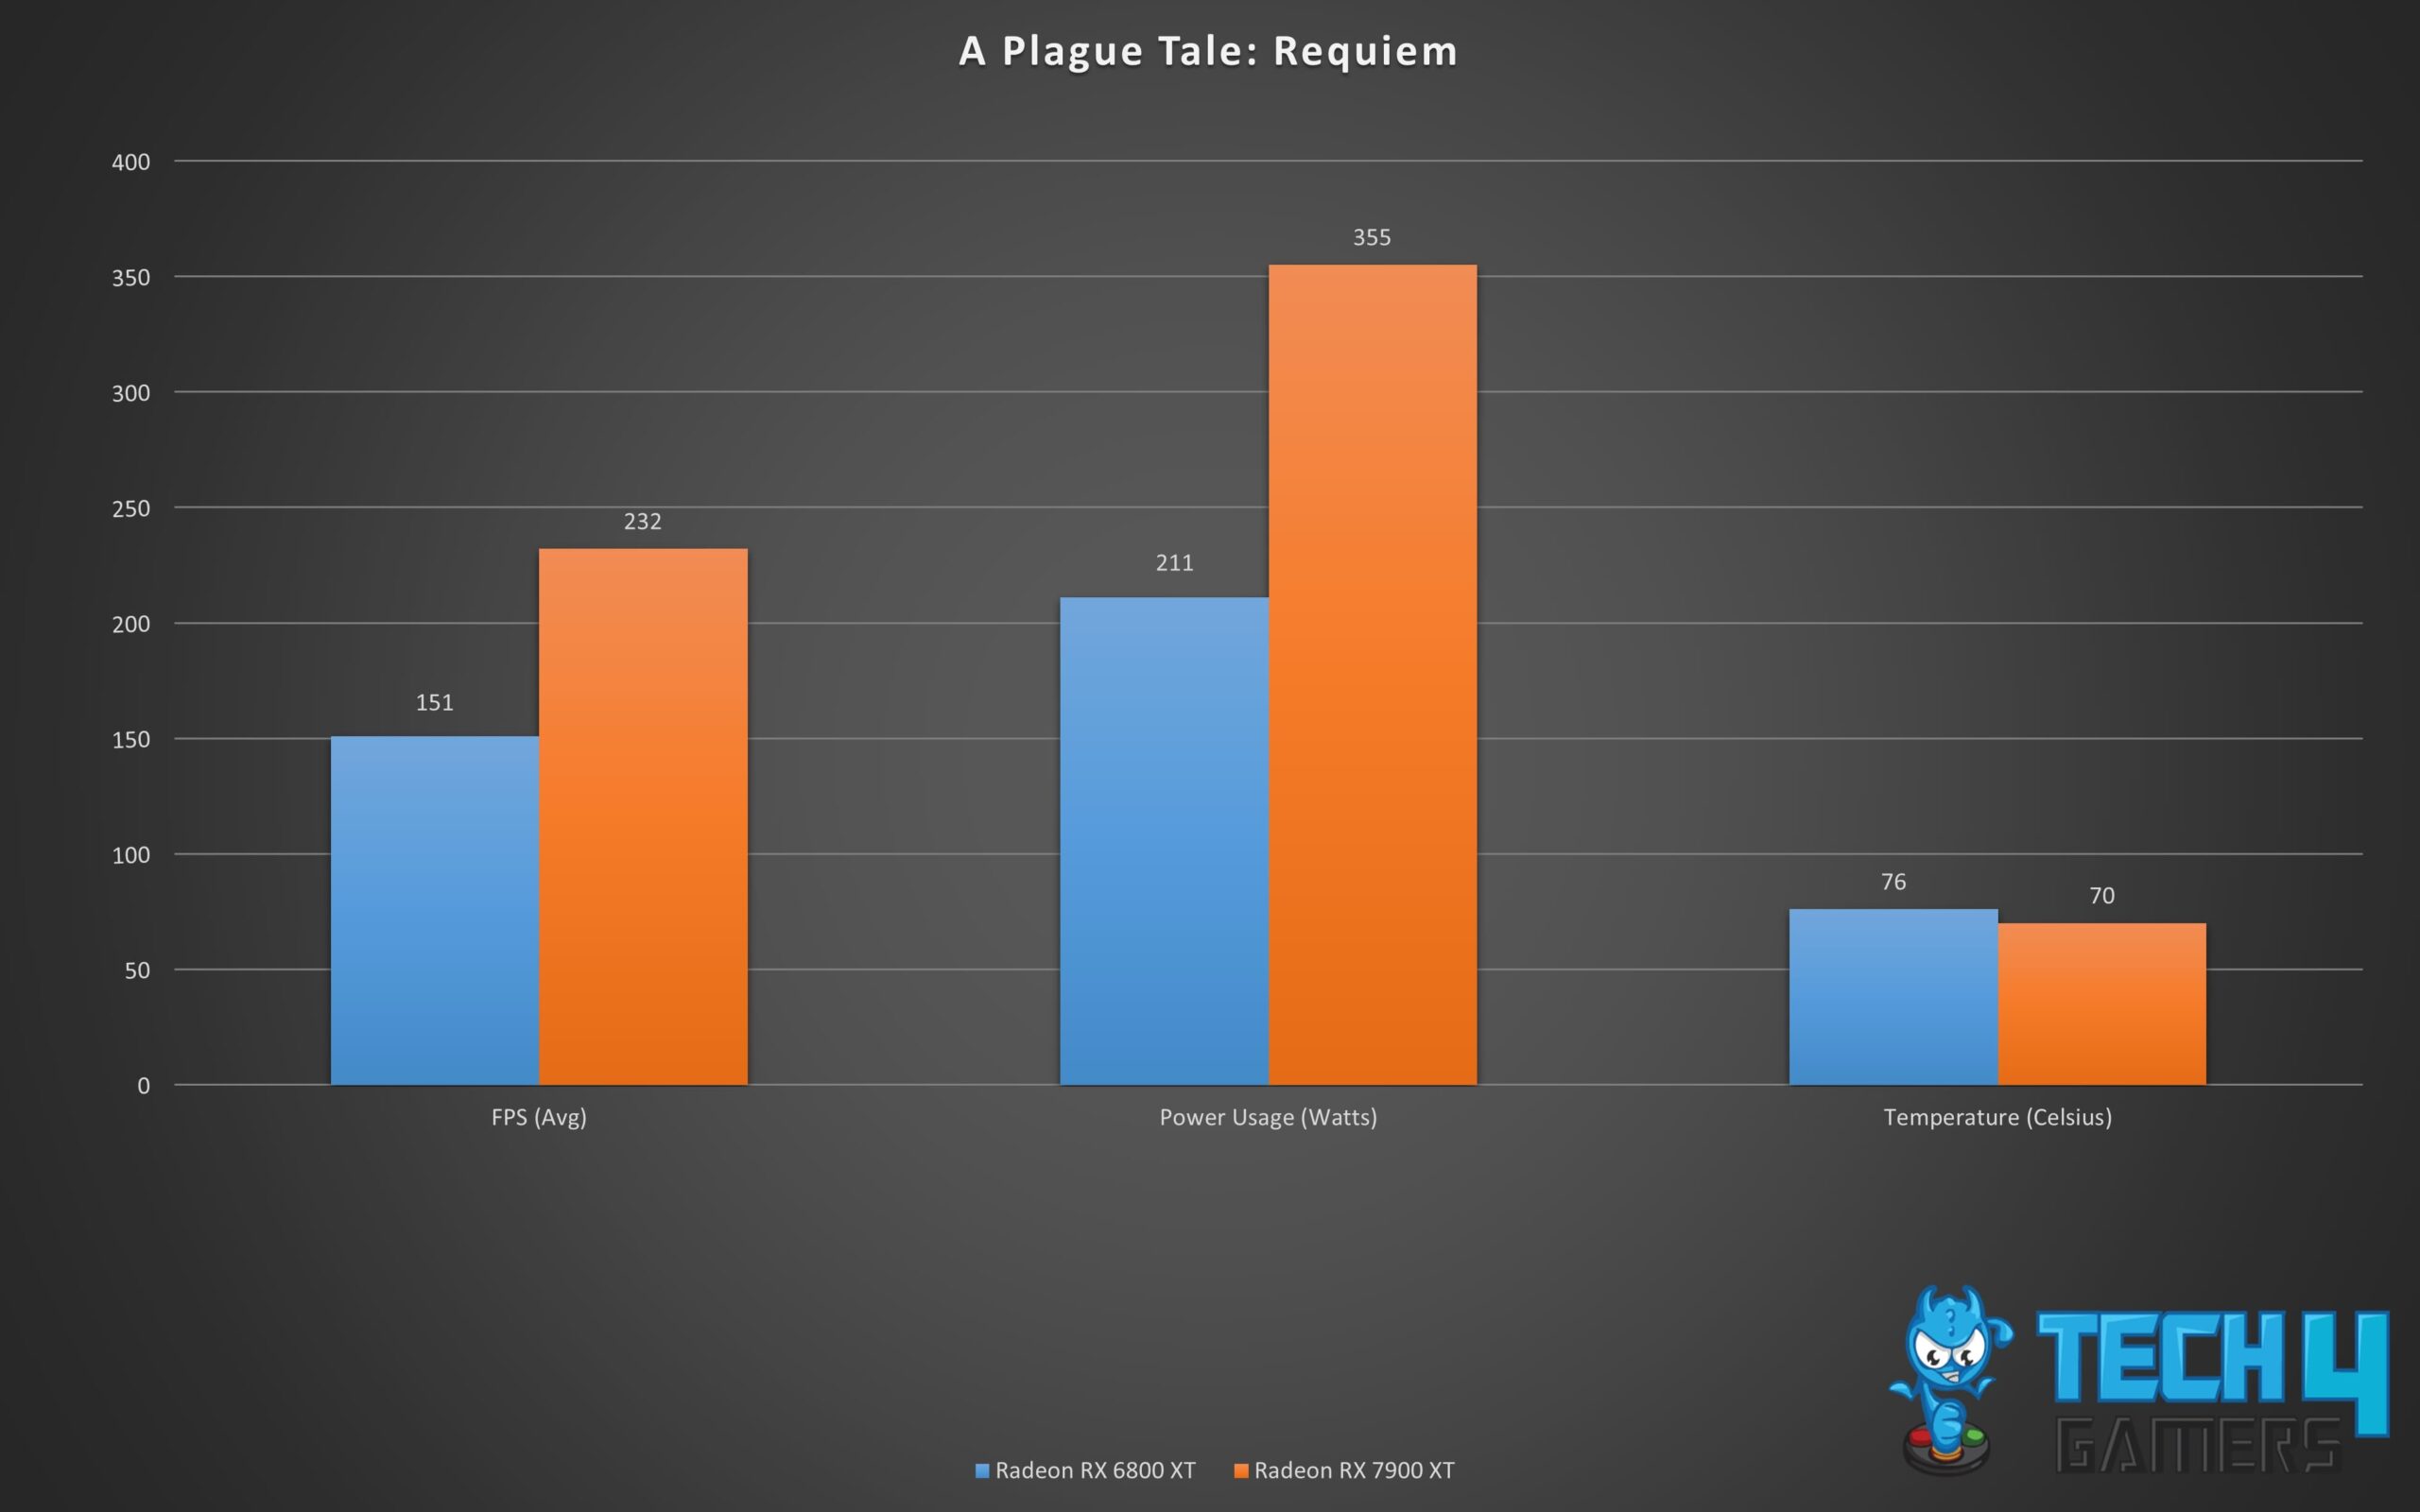
- In my experience, I was able to witness the remarkable performance of the RX 7900 XT in A Plague Tale: Requiem at 1440p. It outshone the RX 6800 XT by a substantial margin, boasting an impressive 34.5% performance increase.
- The average frame rate achieved by the RX 6800 XT clocked in at a modest 84 FPS, whereas the RX 7900 XT soared to an impressive average of 113 FPS. This stark contrast in frame rates was truly noticeable during gameplay.
- What’s even more astonishing is the utilization of the GPUs. The RX 7900 XT was operating at full throttle, reaching 100% of its maximum capacity, showcasing its raw power. Meanwhile, the RX 6800 XT wasn’t far behind, running at 98% of its maximum capacity.
- In addition to performance, it’s worth mentioning the temperature differences between the two GPUs. The RX 6800 XT reached a temperature of 69°C, which was notably six degrees higher than the RX 7900 XT, which remained cool at 63°C during the demanding gameplay of A Plague Tale: Requiem.
Call Of Duty: Modern Warfare 2
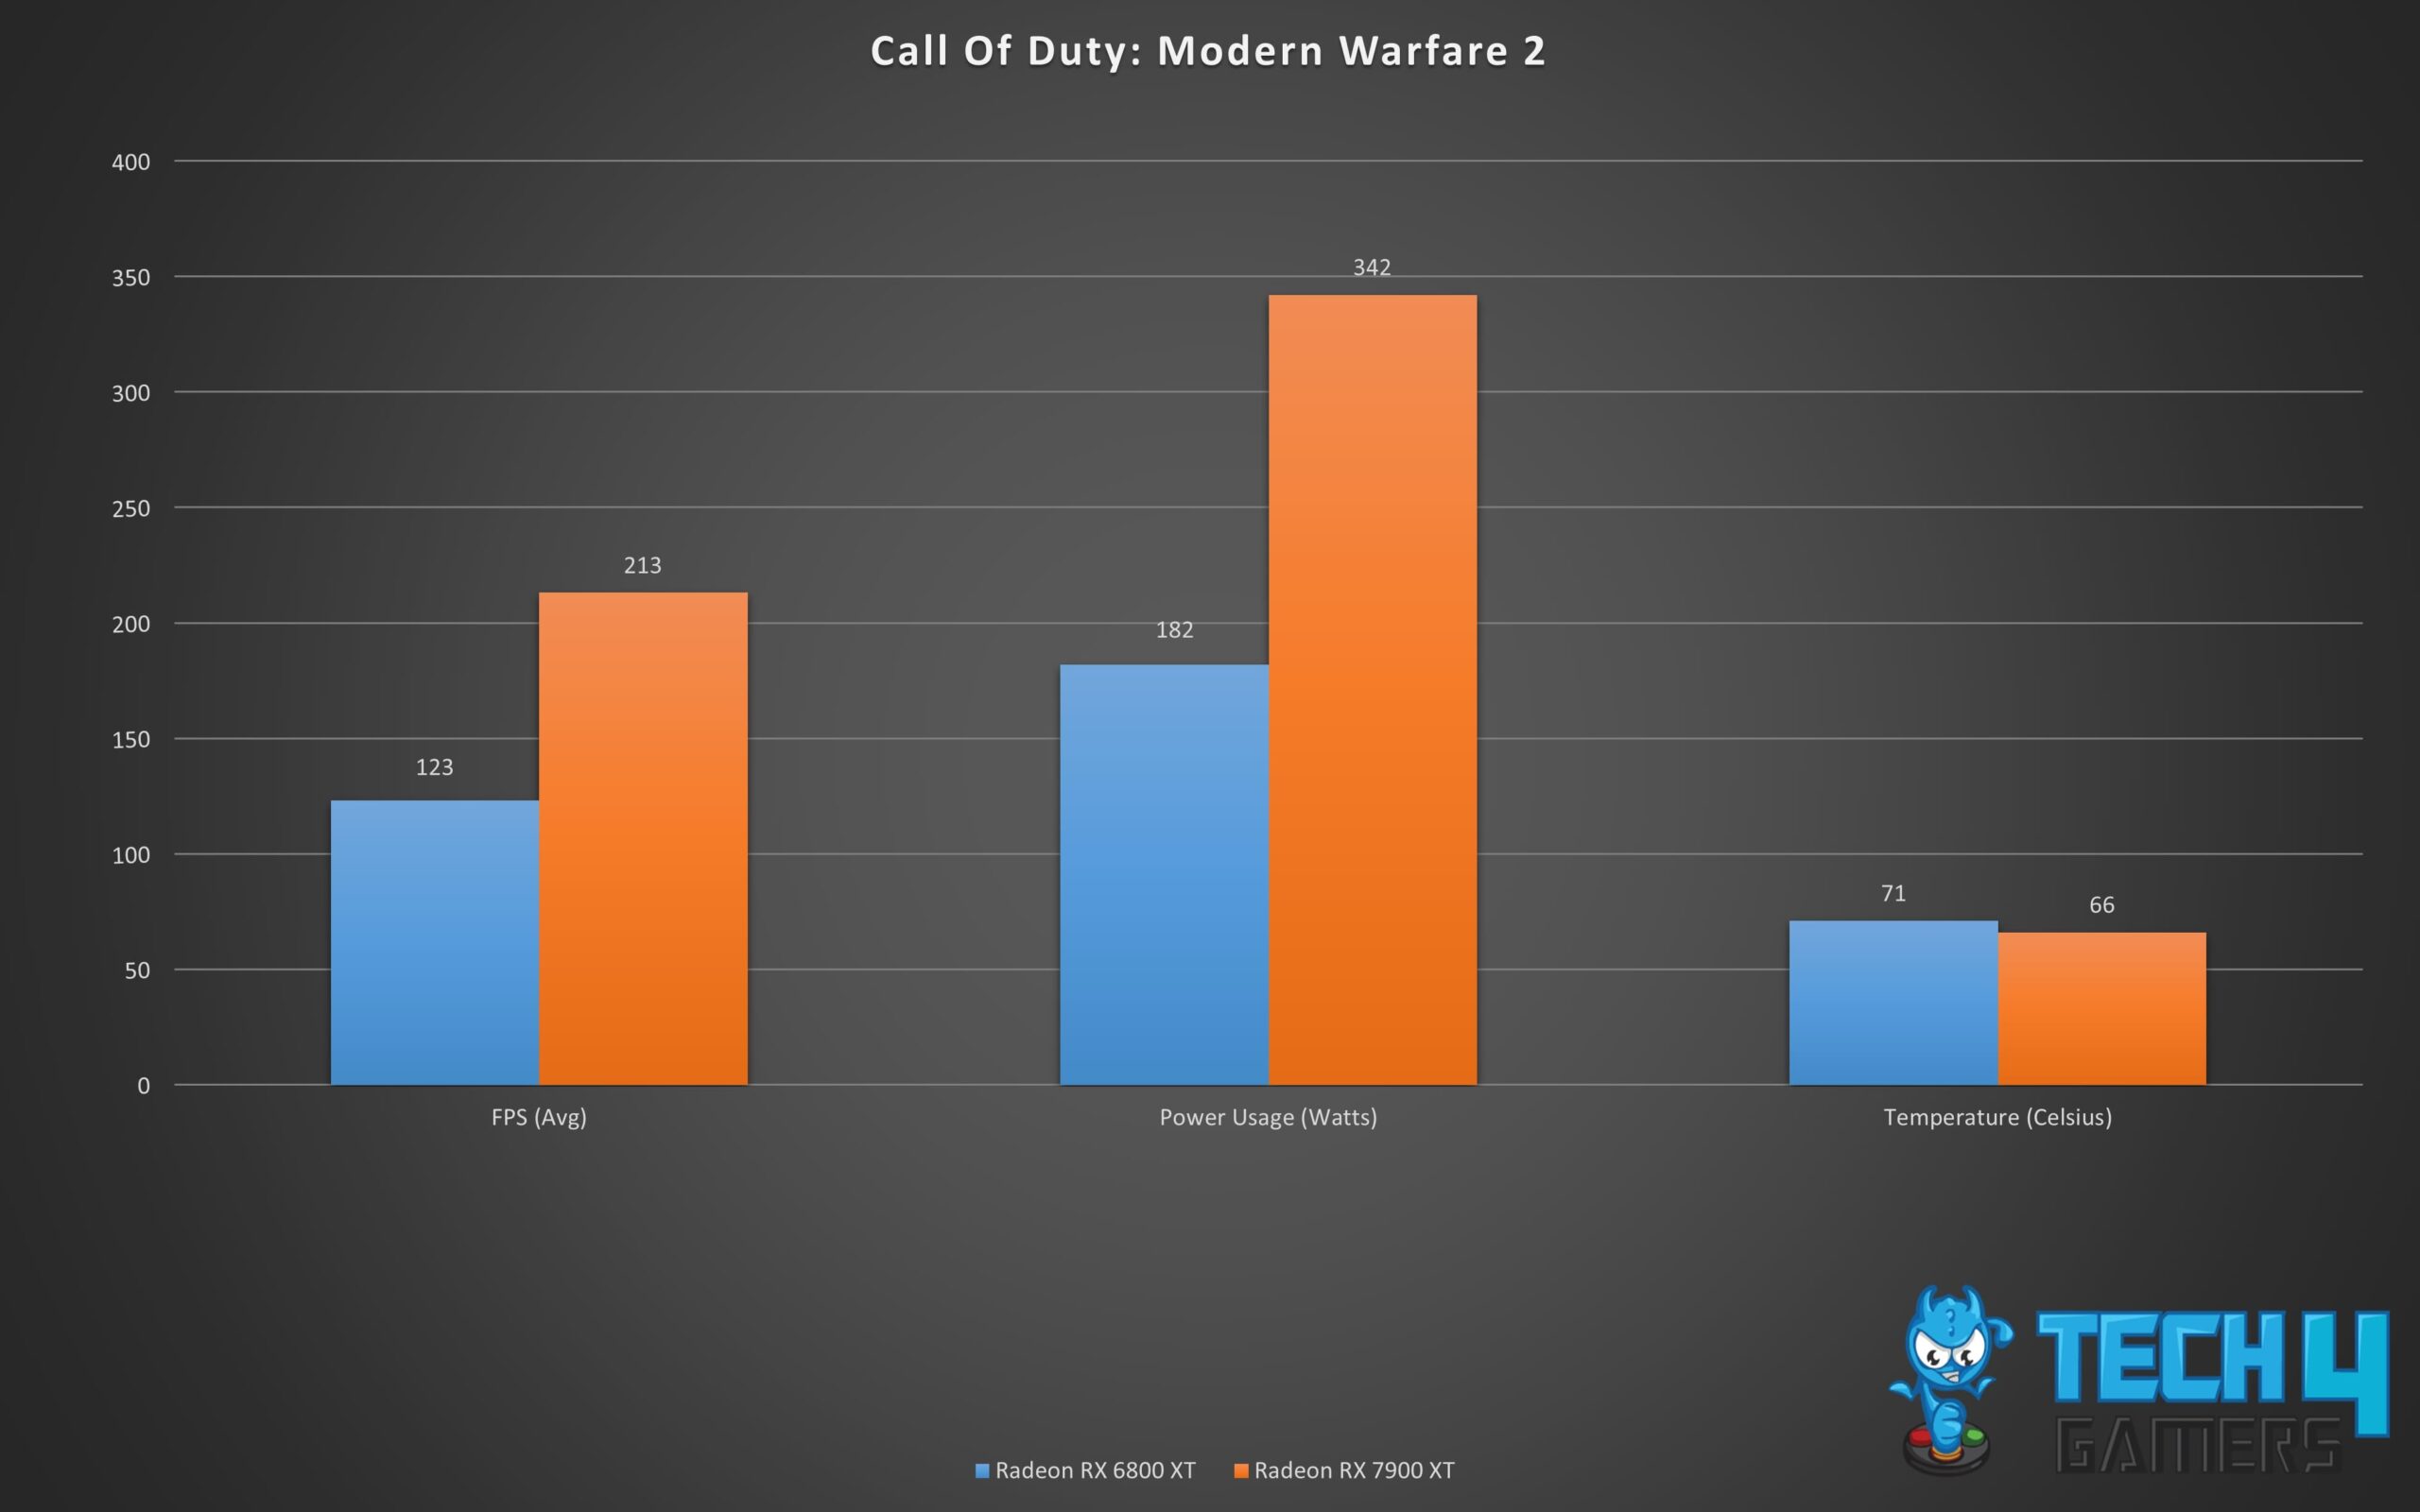
- In my time playing the Call Of Duty: Modern Warfare 2 at 1440p, the Radeon RX 7900 XT once again proved its superiority, delivering a jaw-dropping 38.5% performance boost over the Radeon RX 6800 XT.
- The average frame rate achieved by the Radeon RX 6800 XT was a respectable 109 FPS, but it paled in comparison to the astonishing 151 FPS churned out by the Radeon RX 7900 XT. This substantial frame rate gap was impossible to overlook during the gameplay.
- Furthermore, the GPUs’ utilization was a noteworthy aspect of the experience. The RX 7900 XT was consistently operating at 100% capacity, showcasing its exceptional power during gameplay. Meanwhile, the RX 6800 XT wasn’t far behind, running at 99% of its maximum capacity and still delivering strong performance.
- The RX 6800 XT ran at a temperature of 62°C, which was notably five degrees higher than the RX 7900 XT, which maintained a cooler temperature at 57°C. This temperature delta emphasizes the efficient thermal management of the Radeon RX 7900 XT, ensuring both high performance and optimal cooling, even during intense gaming sessions.
Cyberpunk 2077
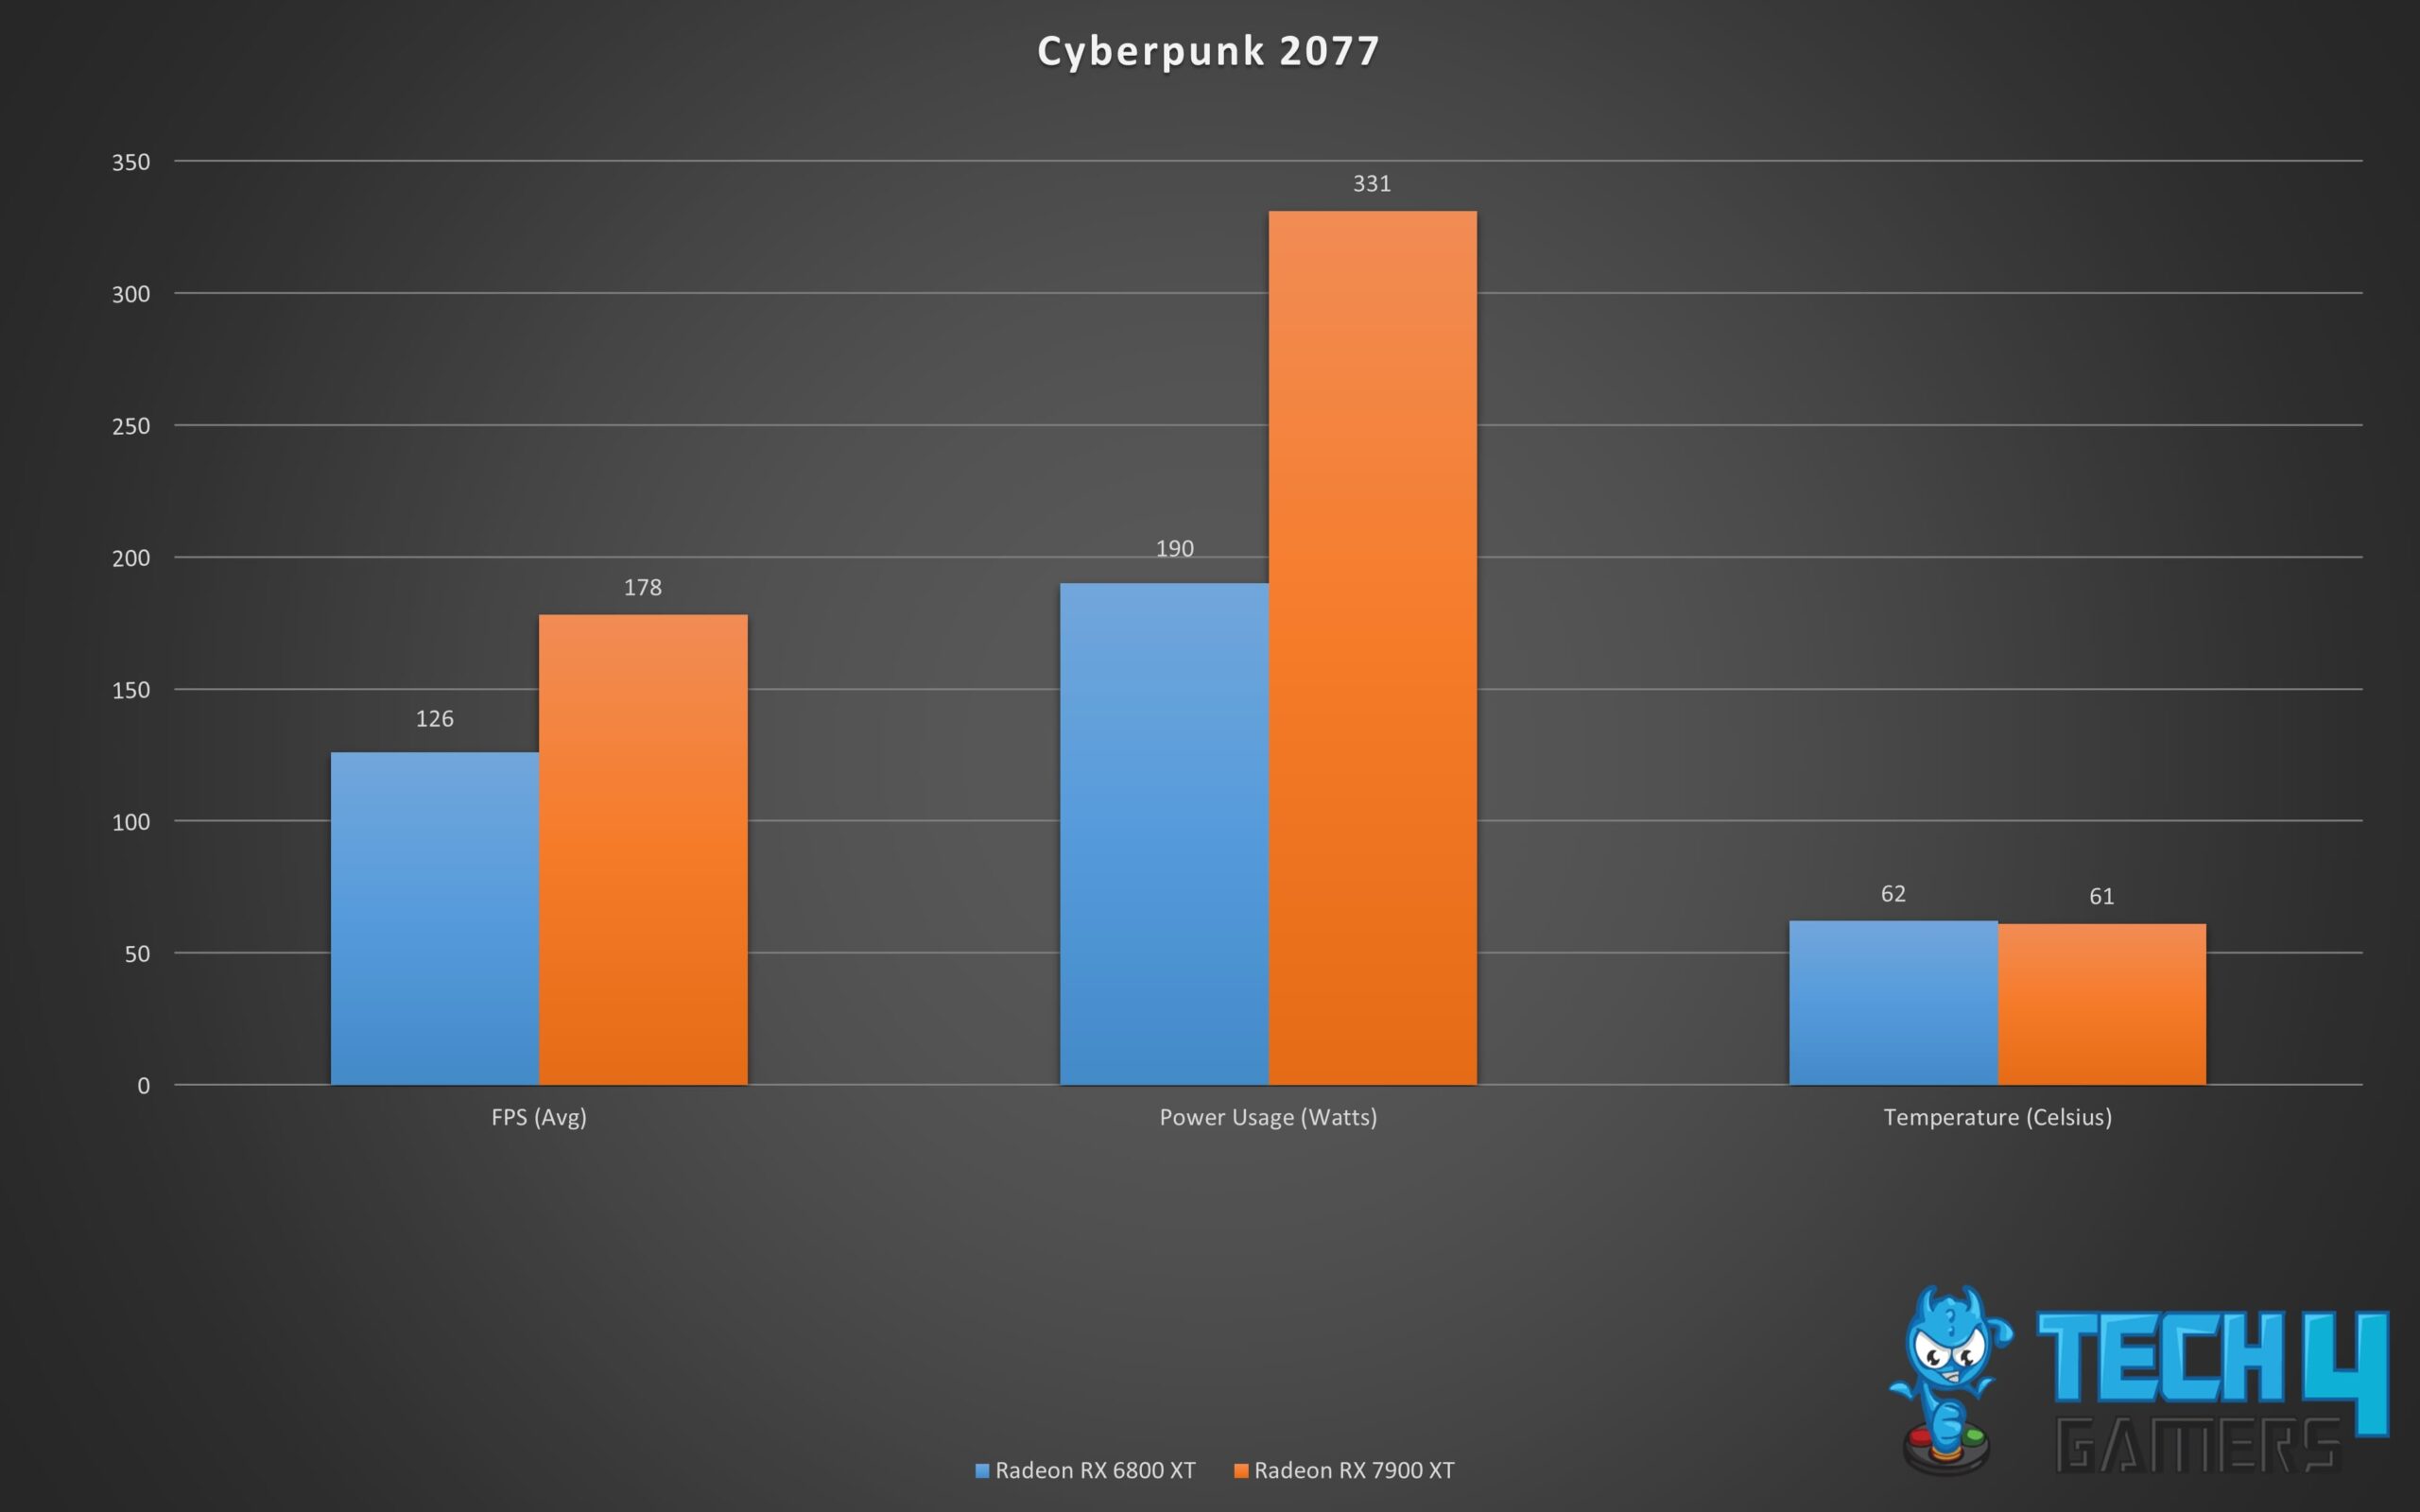
- As per my testing, the RX 7900 XT outperformed the Radeon RX 6800 XT in Cyberpunk 2077 by about 31%.
- On average, the RX 6800 XT only managed to deliver 84 FPS, whereas the RX 7900 XT achieved a remarkable 110 fps. This performance gap was readily noticeable during gameplay, making for a significantly more immersive experience with the latter.
- Furthermore, in terms of GPU utilization, the RX 7900 XT was consistently at 100% load during gameplay, showcasing its relentless power. Meanwhile, the Radeon RX 6800 XT was no slouch, operating at 98% of its maximum capacity and maintaining a strong performance.
- In Cyberpunk 2077, the RX 6800 XT (67°C) ran at a temperature nine degrees higher than the RX 7900 XT (58°C).
Fortnite
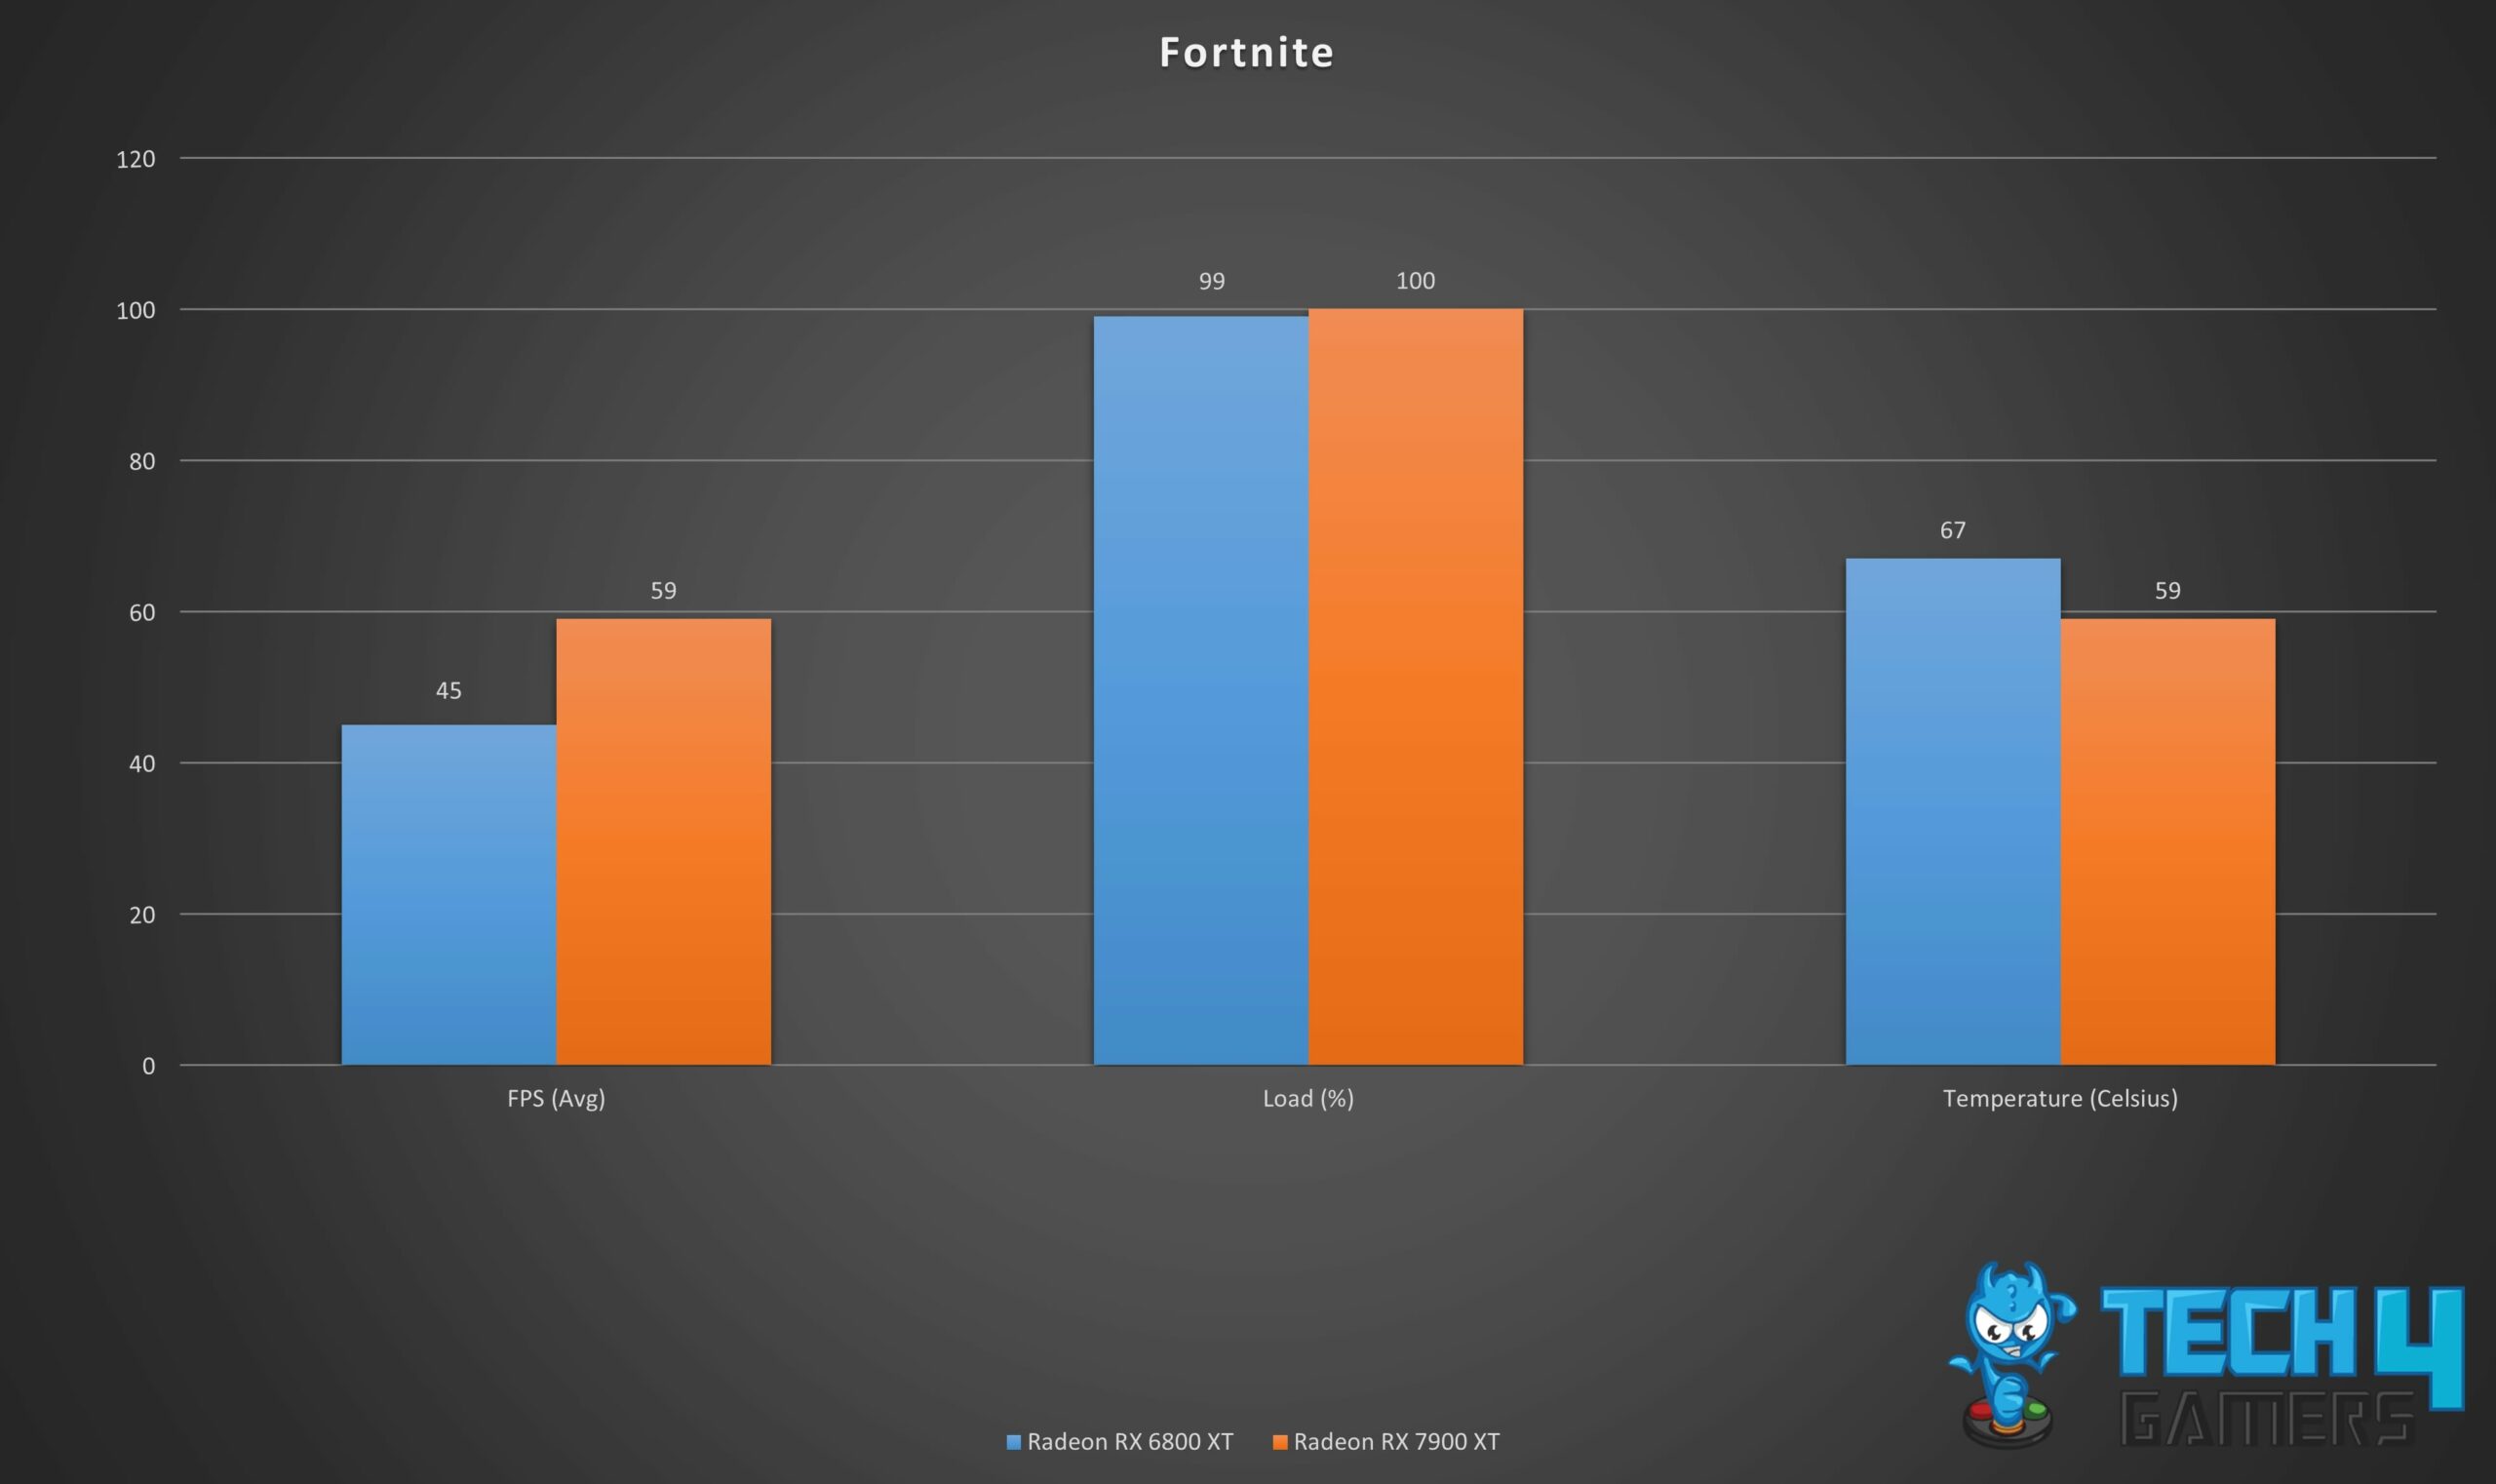
- As per my analysis with Fortnite, I observed that the RX 7900 XT outperformed the Radeon RX 6800 XT by approximately 31.1%.
- The average frame rate achieved by the RX 6800 XT stood at 45 frames per second, while the Radeon RX 7900 XT impressively delivered 59 frames per second on average. This noticeable performance gap significantly enhanced the gaming experience.
- During gameplay, the RX 7900 XT was operating at full capacity, running at 100%, while the Radeon RX 6800 XT was only slightly behind, working at 99% of its maximum load, ensuring both cards delivered strong performance.
- Additionally, in terms of operating temperatures in Fortnite, the Radeon RX 6800 XT ran at a warmer 67°C, while the RX 7900 XT maintained a cooler 59°C, showcasing the latter’s superior thermal management during intense gaming sessions.
God Of War
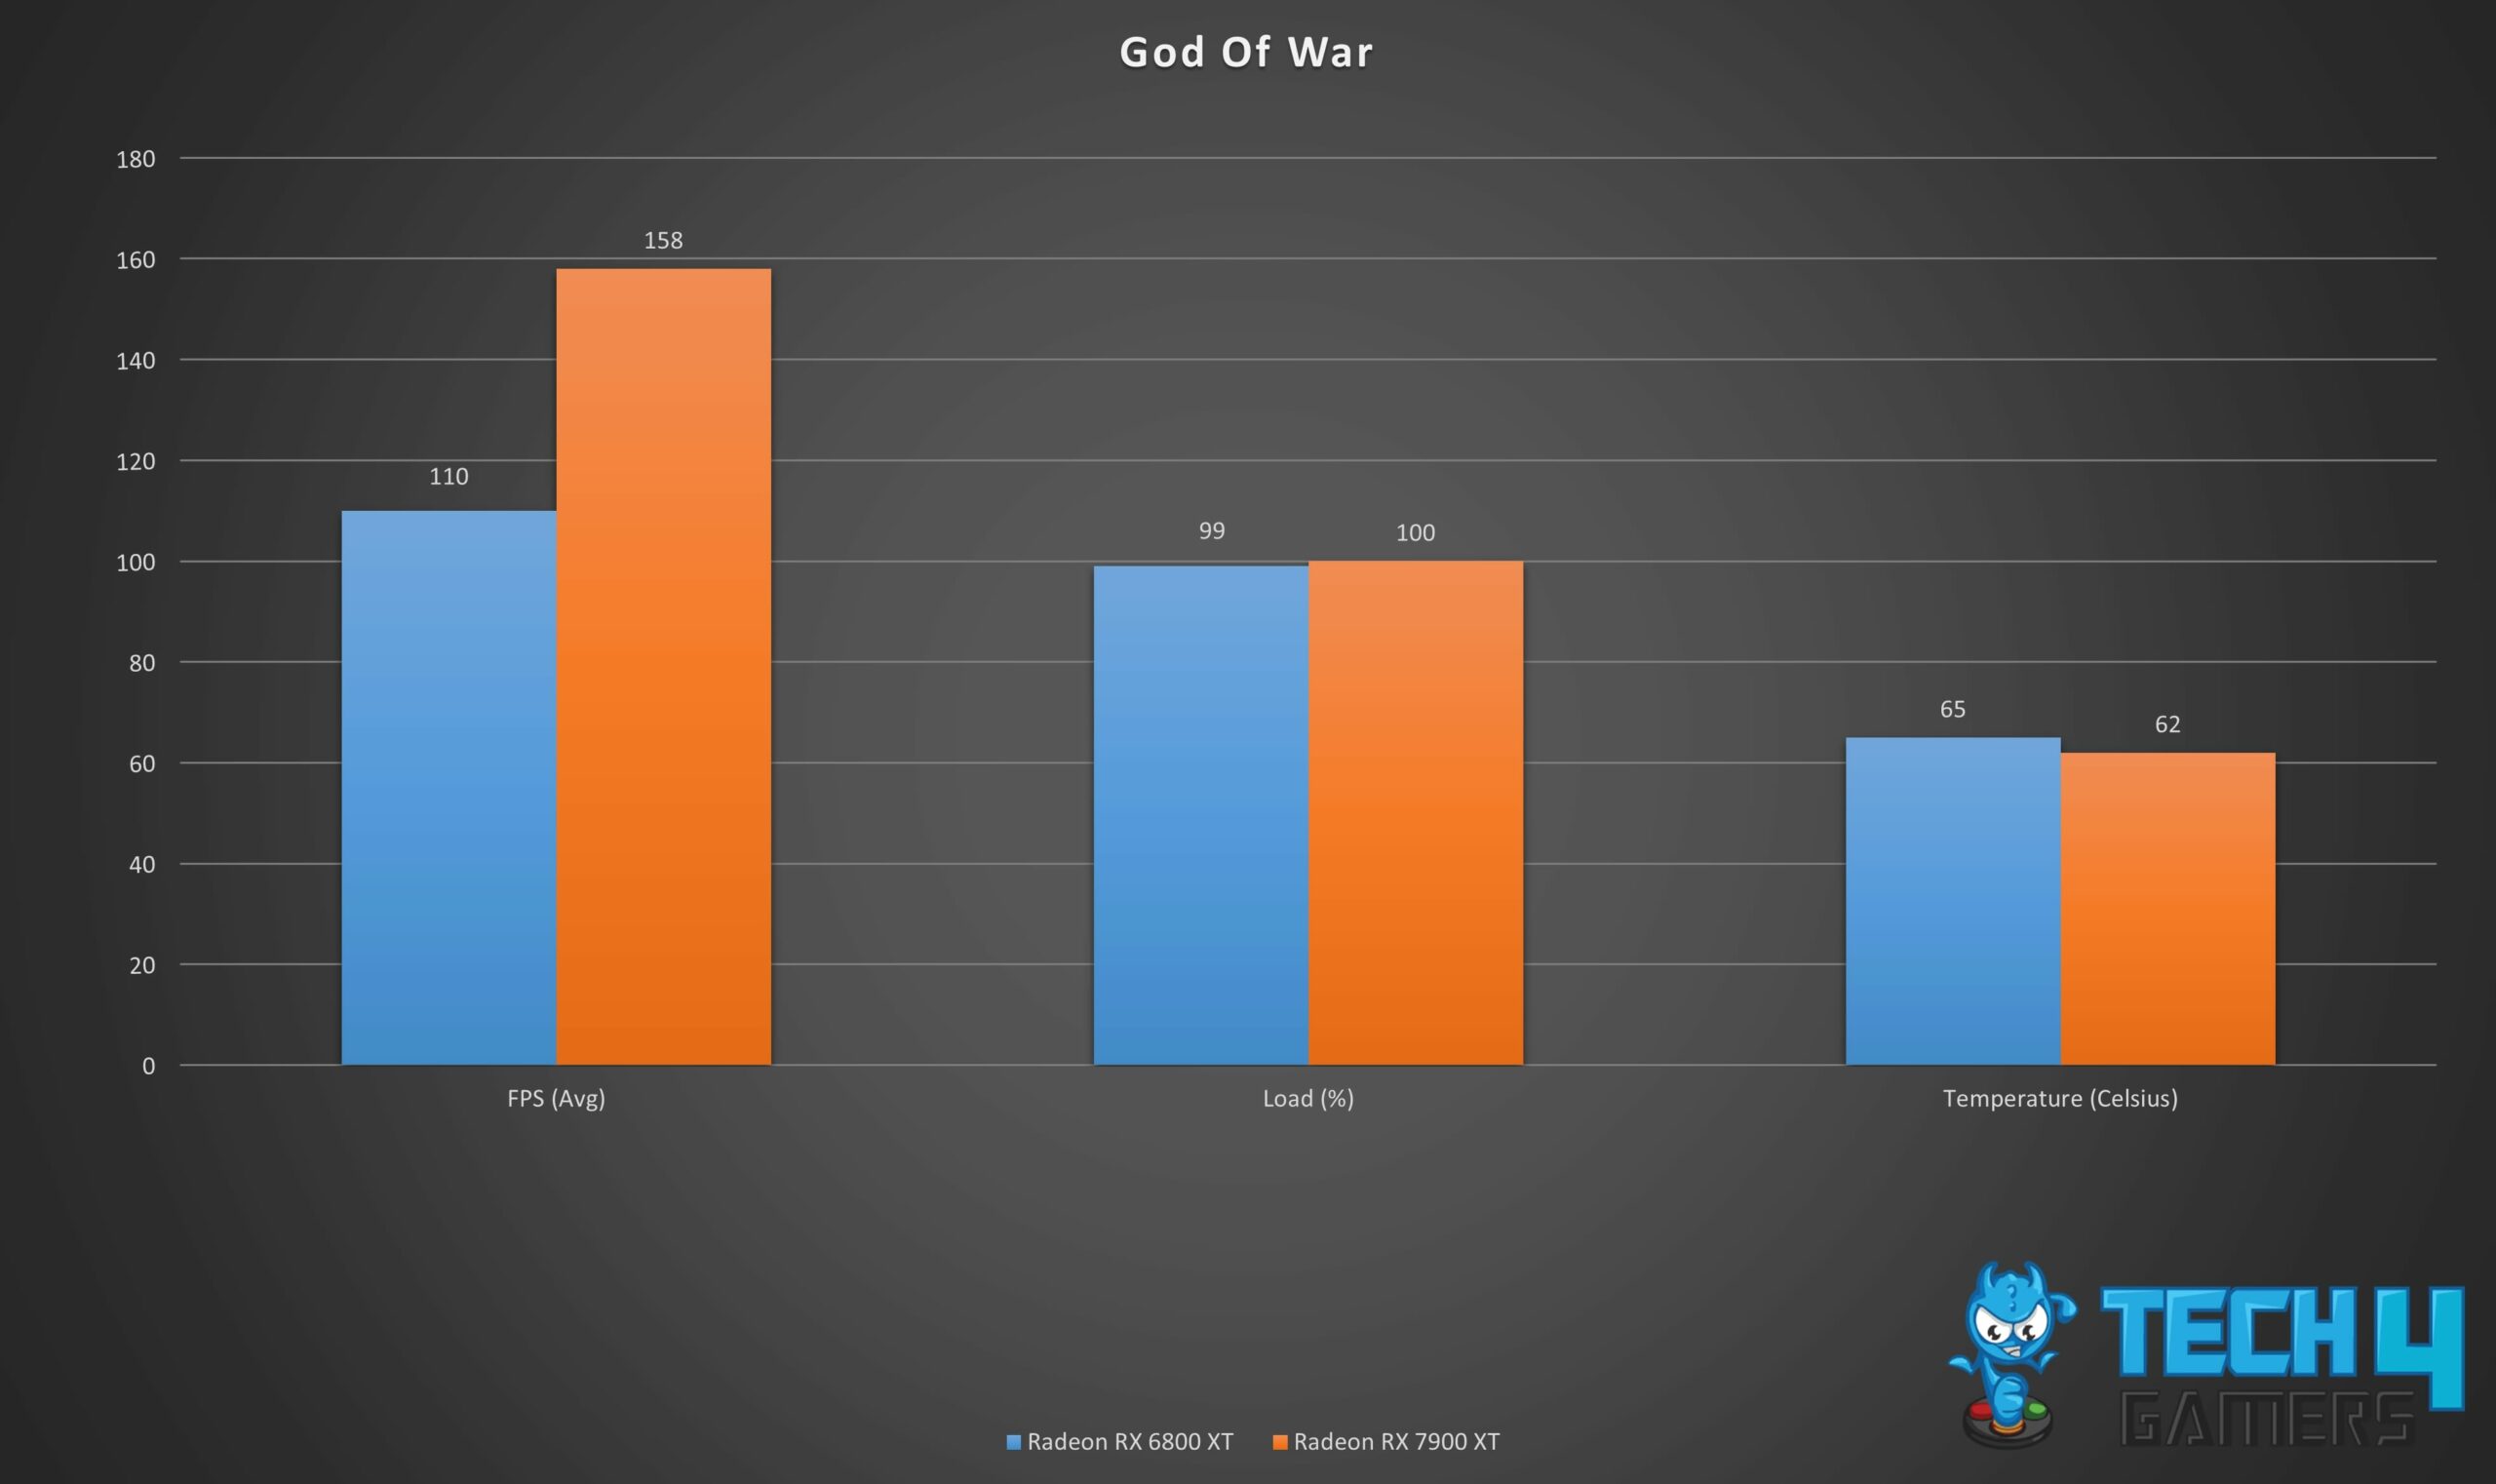
- After playing the God Of War, I observed that the RX 7900 XT outperformed the Radeon RX 6800 XT by approximately 43.6%.
- In comparison to the Radeon RX 7900 XT, which achieved an impressive 158 FPS on average, the Radeon RX 6800 XT could only manage an average of 110 frames per second. This substantial performance difference notably enhanced the gaming experience.
- During gameplay, the Radeon RX 7900 XT operated at its maximum capacity, running at 100%, while the RX 6800 XT was close behind, operating at 99% of its total capacity, ensuring both GPUs delivered robust performance.
- Notably, in terms of operating temperatures during gameplay in God Of War, the Radeon RX 7900 XT maintained a temperature of 62°C, while the RX 6800 XT ran slightly warmer at 65°C, showcasing the former’s superior thermal management capabilities.
The Callisto Protocol
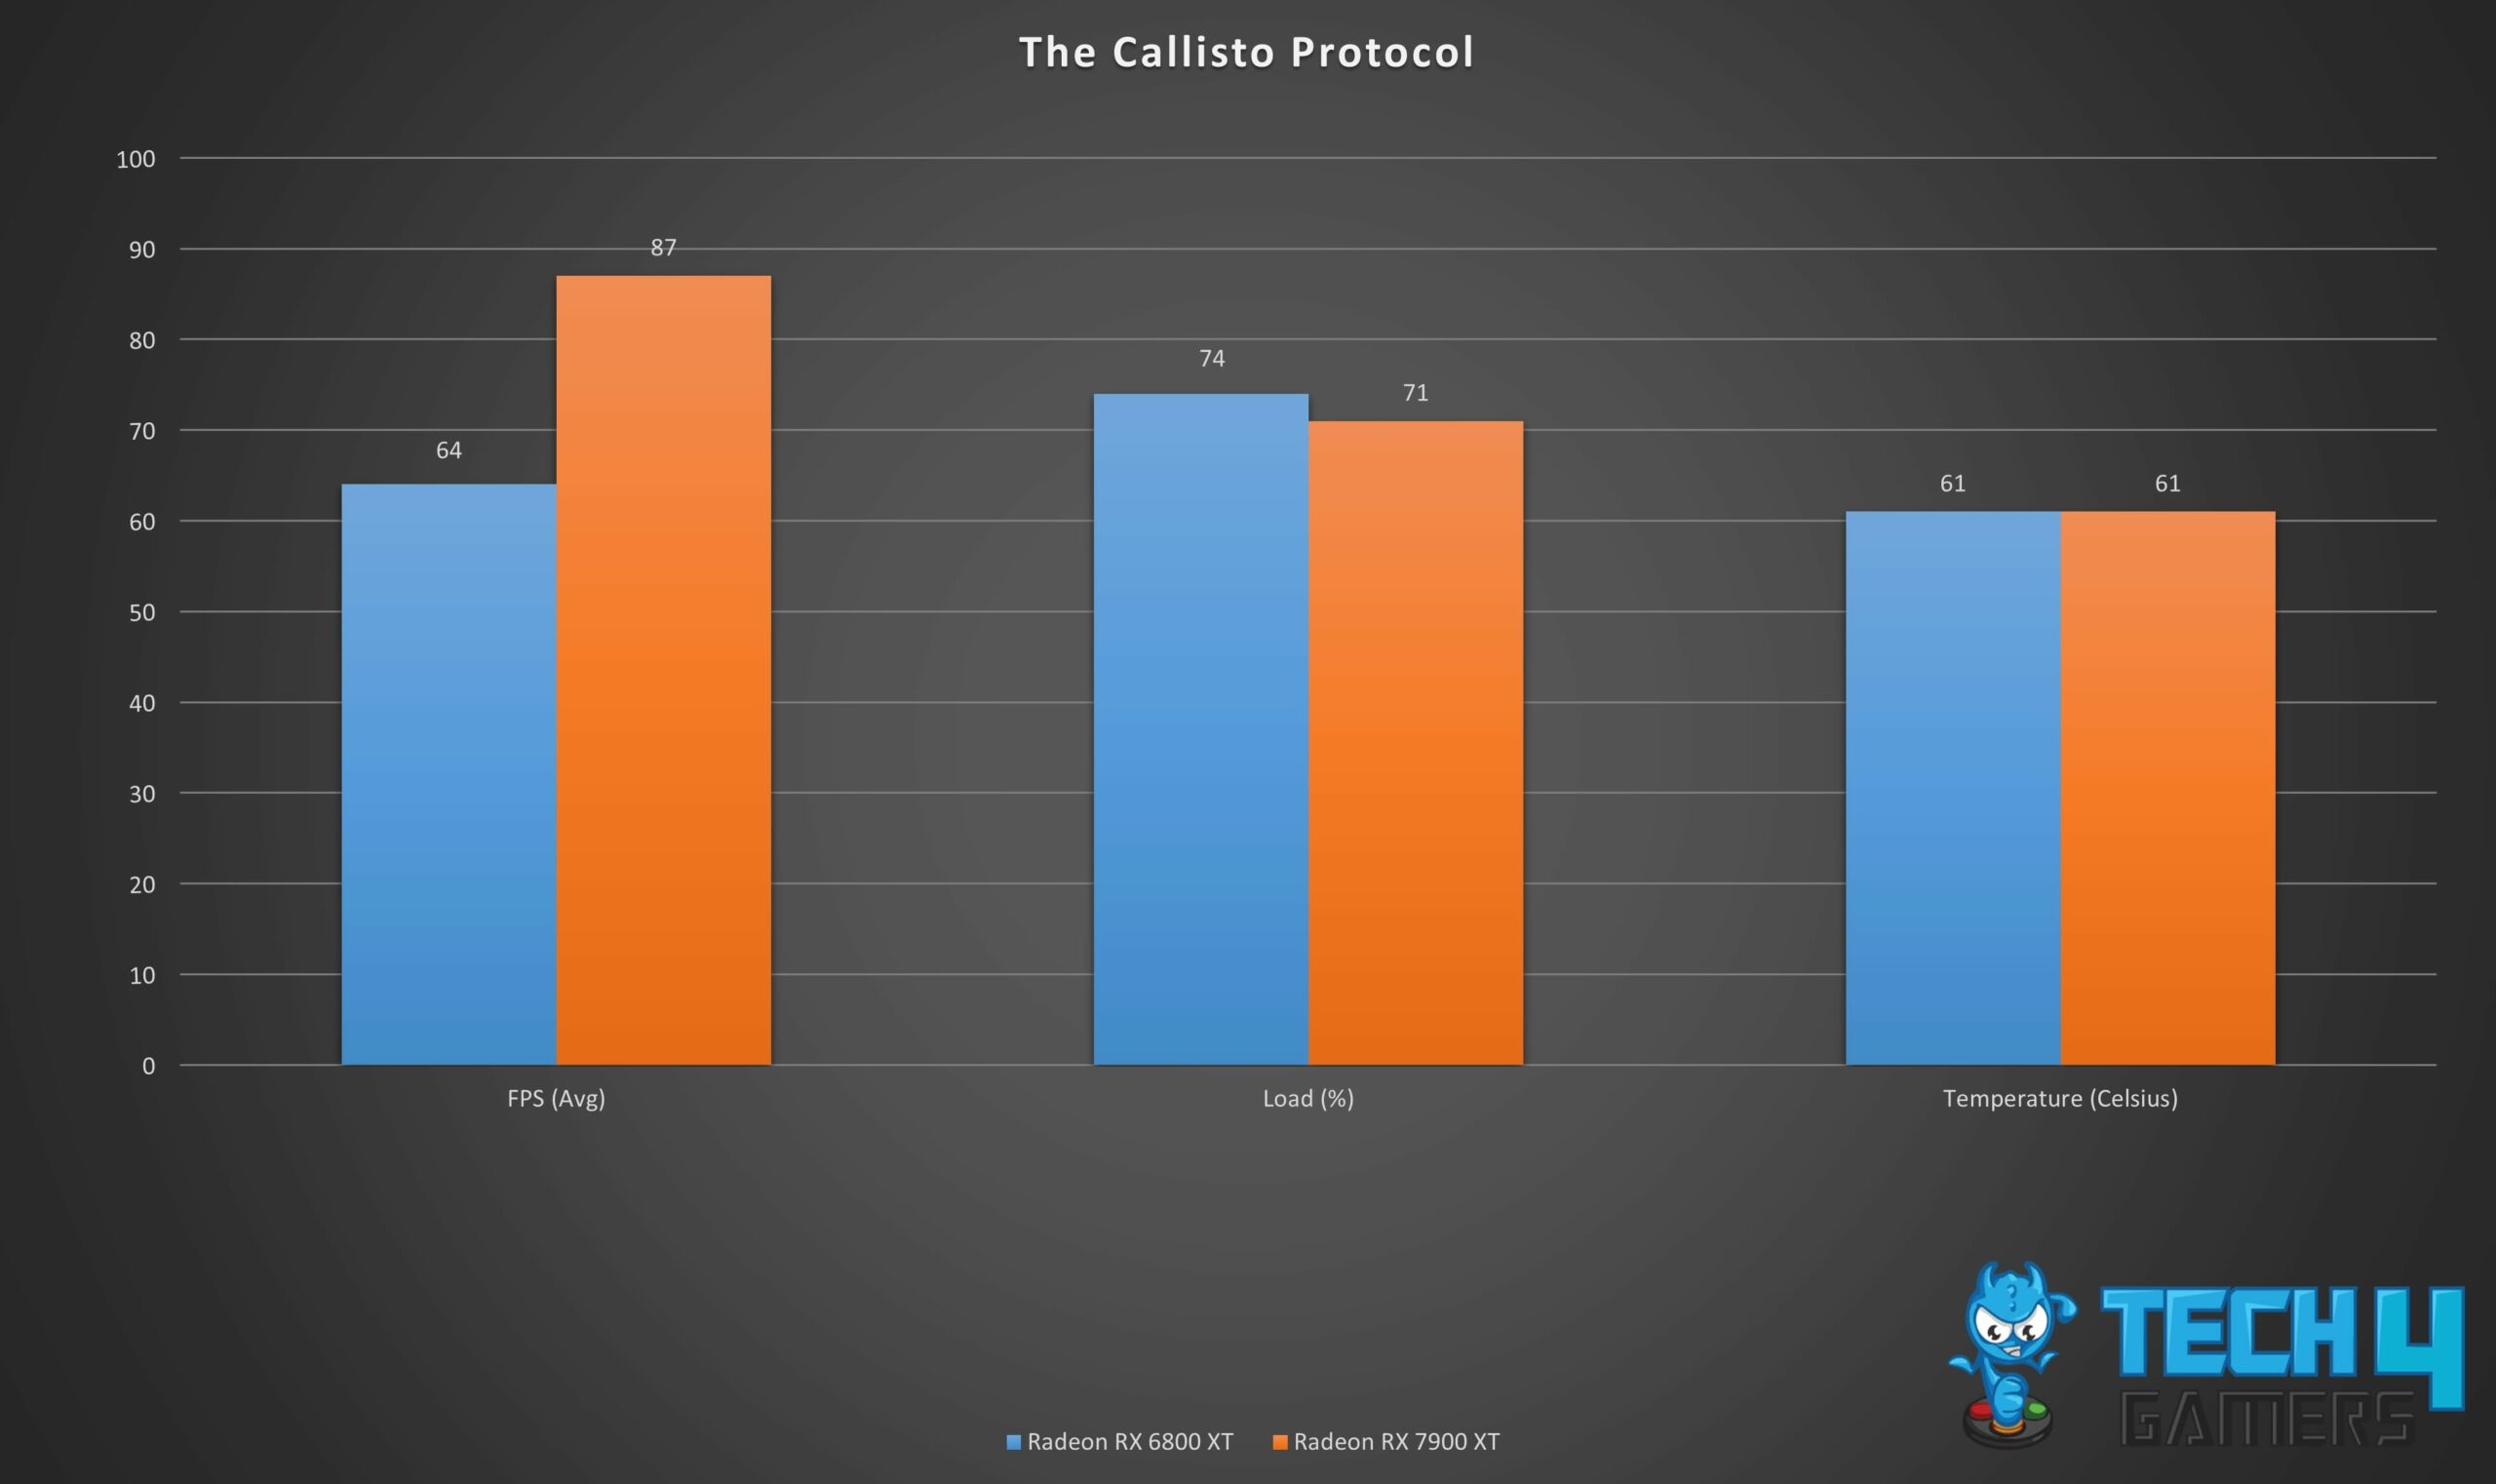
- In the Callisto Protocol, I observed that the Radeon RX 7900 XT delivered an outstanding performance, surpassing the Radeon RX 6800 XT by an impressive margin of approximately 36%.
- The average frame rate achieved by the RX 7900 XT stood at a solid 87 FPS, which significantly outshone the comparatively modest average of 64 FPS attained by the Radeon RX 6800 XT. This performance difference was unmistakable during gameplay, enhancing the gaming experience.
- In terms of GPU utilization, the RX 6800 XT was operating at 74% of its total capacity, whereas the Radeon RX 7900 XT ran at 71%. Both GPUs were still delivering strong performance and providing an engaging gaming experience.
- Notably, both the RX 7900 XT and RX 6800 XT operated at the same temperature of 61°C during the gameplay, highlighting their efficient cooling solutions for maintaining consistent performance in The Callisto Protocol.
Overall Gaming Analysis
After examining how the Radeon RX 7900 XT and RX 6800 XT performed in various games at various resolutions, let’s look at their general behavior. Here, I will check out their frame rate performance, thermal and power efficiency, and the load under which the GPUs were operating in the above games.
Performance
![Overall Gaming Performance at 1440p - Image Credits [Tech4Gamers]](https://tech4gamers.com/wp-content/uploads/2023/03/Overall-Gaming-Performance-at-1440p-Image-Credits-Tech4Gamers.jpg)
- In my gaming benchmarks, during my experience, I witnessed that the RX 7900 XT outperformed the RX 6800 XT overall by a remarkable 30.3 frames per second.
- The Radeon RX 7900 XT delivered an impressive overall frame rate of 113 FPS, whereas the RX 6800 XT lagged behind with an average of 82.7 FPS.
- In every game, playing at 1440p resolution, the Radeon RX 7900 XT consistently outperformed the RX 6800 XT as per my evaluation. The Radeon RX 6800 XT couldn’t secure a win in any of the games, even with a slight lead.
Thermal Efficiency
![Overall Gaming Temperature - Image Credits [Tech4Gamers]](https://tech4gamers.com/wp-content/uploads/2023/03/Overall-Gaming-Temperature-Image-Credits-Tech4Gamers.jpg)
- Based on my testing, I observed that the RX 7900 XT maintained an average operating temperature that was 6.9 degrees lower than that of the Radeon RX 6800 XT during games.
- The Radeon RX 6800 XT registered an average temperature of 76.3°C, while the Radeon RX 7900 XT impressively stayed cooler at 69.7°C.
- Across all the games, the Radeon RX 6800 XT consistently operated at higher temperatures compared to the RX 7900 XT. This temperature difference resulted in the Radeon RX 7900 XT exhibiting an overall thermal efficiency advantage of ~10% in games, ensuring not only strong performance but also effective cooling during intense gaming sessions.
Power Efficiency
![Average Power Consumption during 1080p games - Image Credits [Tech4Gamers]](https://tech4gamers.com/wp-content/uploads/2023/03/Average-Power-Consumption-during-1080p-games-Image-Credits-Tech4Gamers.jpg)
- As per my evaluation, I observed significant differences in power consumption between the Radeon RX 7900 XT and the Radeon RX 6800 XT during games.
- The Radeon RX 7900 XT consumed 129 watts more power compared to the Radeon RX 6800 XT, resulting in an overall power consumption of 303.8 W for the Radeon RX 7900 XT and 174.8 W for the Radeon RX 6800 XT.
- As the figures indicate, the RX 7900 XT is a notably power-hungry GPU in comparison to the Radeon RX 6800 XT.
- Opting for the RX 6800 XT would be more cost-effective for users who want to keep their electricity bills in check. In fact, the Radeon RX 6800 XT stands out as 73.8% more power-efficient overall compared to the power-hungry RX 7900 XT.
Price And Availability
AMD launched the Radeon RX 6800 XT with a price tag of $649 at the end of the year 2020, and AMD launched the Radeon RX 7900 XT at $899 at the end of 2022.
Since these graphics cards come with many variants, their prices may differ. For example, the GPUs manufactured by Gigabyte, MSI, and ASUS are relatively more expensive than others.
There is no problem with Radeon RX 6800 XT and Radeon RX 7900 XT being available. Both these graphics cards are readily available in the offline market and online stores like Amazon, eBay, and Aliexpress.
RX 7900 XT Vs RX 6800 XT: Which One Would I Recommend?
The gaming performance of the RX 7900 XT, according to my testing, is much better than the 6800 XT. In figures, the RX 7900 XT performed 36.6% better in 1440p games. Moreover, the performance-to-price ratio of the Radeon RX 7900 XT is also higher than the RX 6800 XT.
Therefore, I recommend you go for the RX 7900 XT. Because the Radeon RX 7900 XT is newly launched and has the latest architecture and chip, better memory, and superior performance, it would be a better option.
However, if you are low on budget and the RX 7900 XT does not suit you, then I would urge you to check out the Radeon RX 6800 XT, which is also a fabulous graphics card. The performance of the RX 6800 XT is outstanding when not compared to the latest high-priced graphics cards.
| GPU | Pros | Cons |
|---|---|---|
| RX 7900 XT |
|
|
| Radeon RX 6800 XT |
|
|
Thank you! Please share your positive feedback. 🔋
How could we improve this post? Please Help us. 😔
[Hardware Reviewer]
Hi! I’m Ali Tauseef, and I have been writing for Tech4Gamers since 2022. I love all things computer hardware but am particularly fond of CPUs and motherboards, and I like to stay up-to-date about the latest advancements in these worlds, and when possible, write about it. When I’m not doing that, I like to get into a little FPS action in CS2 or get lost in the vast world of RDR2.
Get In Touch: ali@tech4gamers.com


Feedback By: