AMD Radeon RX 7600
Rated: 8.9/10
Intel Arc A770
Rated: 8.3/10
Pros And Cons
| GPU | Pros | Cons |
|---|---|---|
| ARC A770 | ✅Provides a robust 16GB of GDDR6 memory. ✅Performs exceptionally better than the A750. | ❌Performance is not consistent in games. |
| Radeon RX 7600 | ✅Provides seamless gaming experience on 1080p. ✅Only requires an 8-pin power connector for peak performance. | ❌Ray tracing quality is average. |
- The RX 7600 outperforms the ARC A770 in various gaming benchmarks. On average, the RX 7600 showcases a 14.8% advantage in FPS performance.
- The RX 7600 runs cooler than the ARC A770. It also demonstrates better power efficiency, consuming roughly 6.5% less power on average than its counterpart.
- The Radeon RX 7600 is priced at around 269 USD, positioning it as a more affordable option than the ARC A770, which commands a higher price of about 299 USD.
- With superior performance, efficiency, and affordability, the RX 7600 is recommended for gamers and content creators.
Comparison Table
| Technical Specs | Radeon RX 7600 | Intel Arc A770 |
|---|---|---|
| GPU Name | Navi 33 | DG2-512 |
| Architecture | RDNA 3.0 | Generation 12.7 |
| CUDA Cores | 2048 | NA |
| Tensor Cores | NA | 512 |
| ROPs | 64 | 128 |
| Memory Bus Width | 128 bit | 256 bit |
| Suggested PSU | 500W | 600W |
| Best Variants | Best RX 7600 GPUs | - |
Architectural Difference
- Process Node: Starting off, both the Arc A770 and RX 7600 share the same 6nm process size, showcasing their similar manufacturing technology.
- Clock Speed: Additionally, the Arc A770 outperforms the RX 7600 with higher clock speeds: 2100 MHz base and 2400 MHz boost, compared to the RX 7600’s 1720 MHz base and 2655 MHz boost.
- VRAM: Furthermore, the Arc A770 boasts 16GB of GDDR6 VRAM, surpassing the RX 7600’s capacity of 8GB of GDDR6 VRAM.
- TDP: Moreover, the Arc A770 exhibits a higher TDP of 225W, while the RX 7600 maintains a lower TDP of 165W in terms of thermal design.
- Supported Technologies: Finally, the RX 7600 incorporates FSR for graphics enhancement, and the Arc A770 has XeSS to achieve similar results.
Shifting our attention to an equally intriguing showdown between two powerful and budget-friendly options: AMD’s RX 7600 vs ARC A770 from Intel. Before placing it against the ARC A770, we have reviewed AMD’s RX 7600 in detail. This clash between these formidable contenders promises an exciting battle in the realm of gaming graphics cards.
Gaming Performance Benchmarks
We conducted extensive gaming tests to thoroughly evaluate the gaming capabilities of the RX 7600 vs ARC A770.
Testing Rig
- CPU: AMD Ryzen 7 7800X3D
- Motherboard: ASRock Z790 Taichi Lite Motherboard
- Memory: XPG Lancer RGB 32GB 7200MHz DDR5 Ram
- Power Supply: ENERMAX REVOLUTION D.F. X 1050W
- CPU Cooler: Corsair H150i Elite
- Storage Drive: XPG GAMMIX S70 BLADE 2TB NVMe SSD
- Operating System: Windows 11
Fortnite (Epic Settings + RT ON)
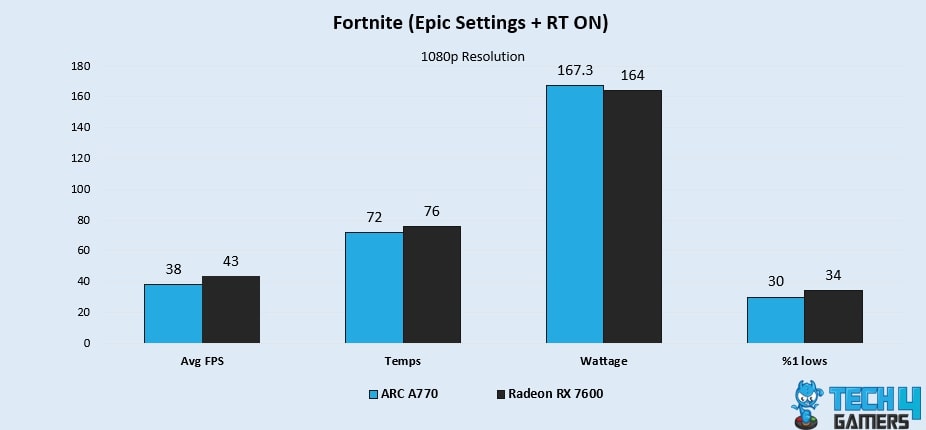
- In this Fortnite gameplay, the RX 7600 outperforms the ARC A770 with a significant 12.3% advantage, achieving 43 FPS compared to the latter’s 38 FPS.
- Moreover, the RX 7600 exhibits a remarkable 12.5% higher 1% low performance, reaching 34 FPS, compared to the ARC A770’s 30 FPS.
Fortnite (High Settings)
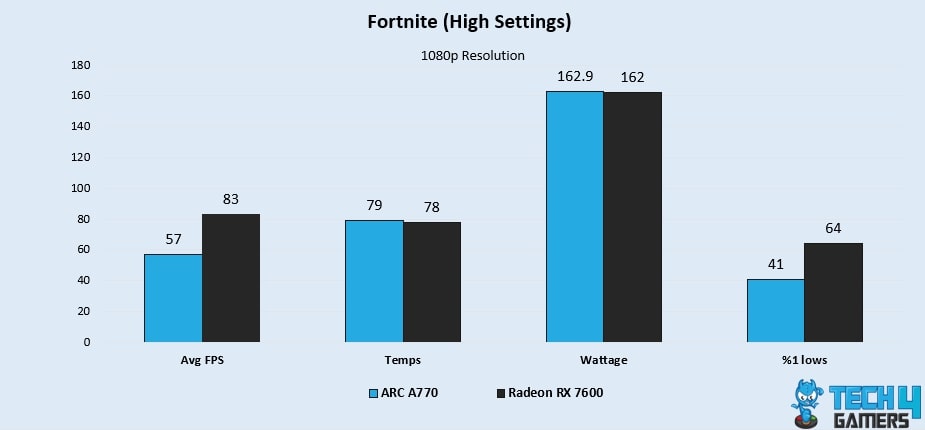
- Impressively, the RX 7600 surpasses the ARC A770 with a 37.1% increase in average FPS, reaching 83 FPS compared to the ARC A770’s 57 FPS.
- In addition, the RX 7600 delivers an exceptional 43.8% higher 1% low performance, achieving 64 FPS and outperforming the ARC A770’s 41 FPS.
Star Wars Jedi Survivor
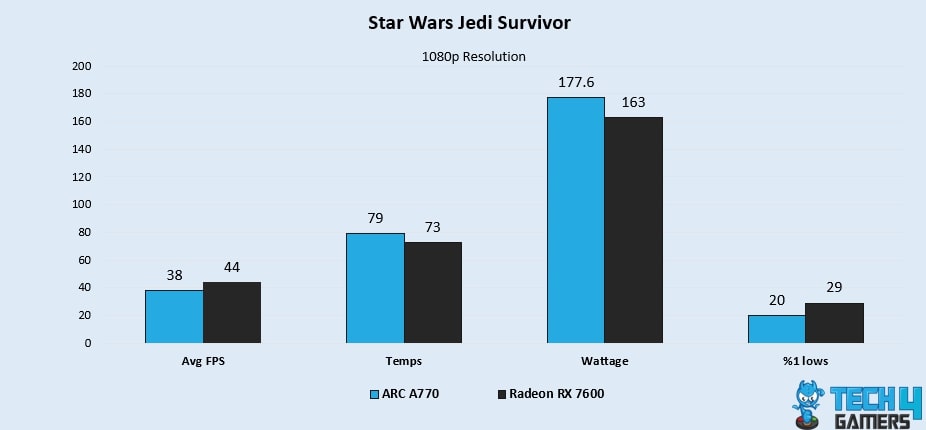
- In my Star Wars Jedi Survivor gameplay, the RX 7600 outshines the ARC A770 with a 14.6% advantage, achieving 44 FPS compared to the ARC A770’s 38 FPS.
- Furthermore, the RX 7600 demonstrates a significant 36.7% higher 1% low performance, achieving 29 FPS, compared to the ARC A770’s 20 FPS.
A Plague Tale Requiem
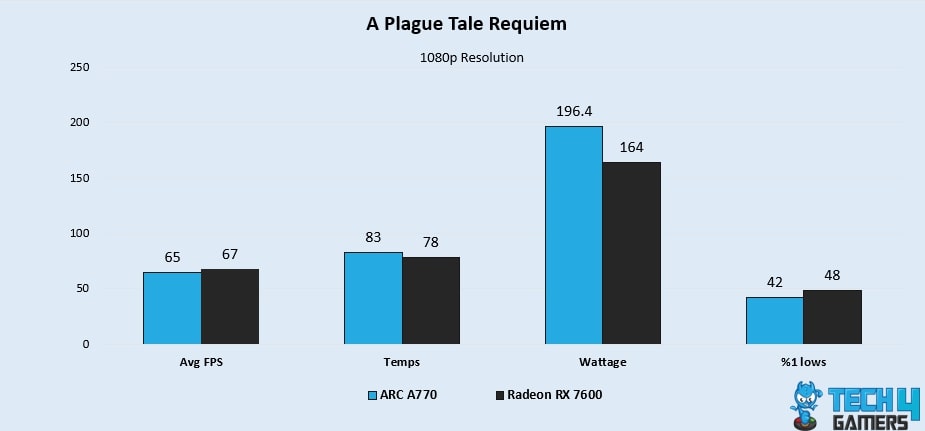
- While playing Plague Tale Requiem, I observed the RX 7600 maintains a slight 3% lead, achieving 67 FPS compared to the ARC A770’s 65 FPS.
- Furthermore, the RX 7600 exhibits a 13.3% advantage in 1% low performance, achieving 48 FPS, surpassing the ARC A770’s 42 FPS.
Returnal
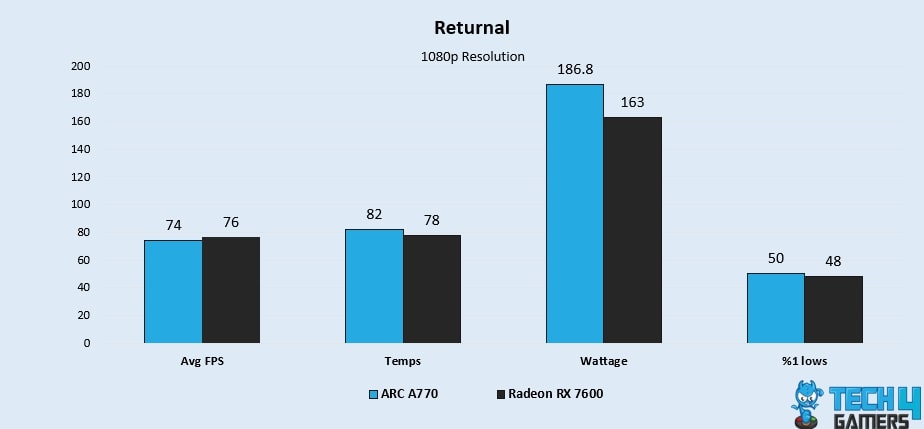
- Surprisingly in this gameplay, the RX 7600 edges out the ARC A770 with a 2.6% advantage, reaching 76 FPS compared to the ARC A770’s 74 FPS.
- Furthermore, the RX 7600 showcases a 4% lower 1% low performance, achieving 48 FPS, falling behind the ARC A770’s 50 FPS.
Forspoken
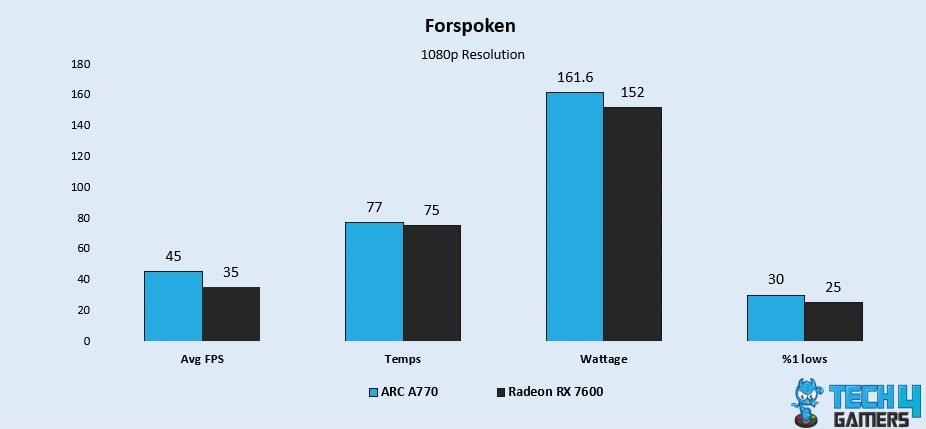
- In this session, the RX 7600 falls behind the ARC A770 with a significant 25% decrease, achieving only 35 FPS compared to the ARC A770’s 45 FPS.
- In addition, the RX 7600 demonstrates a substantial 18.1% lower 1% low performance, achieving 25 FPS, compared to the ARC A770’s 30 FPS.
Resident Evil 4 Remake
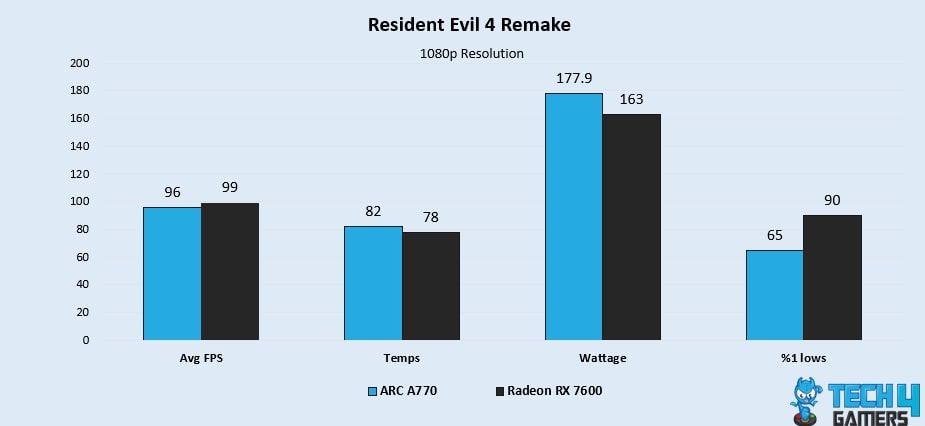
- In my Resident Evil gameplay, the RX 7600 maintains a slight 3% lead over the ARC A770, achieving 99 FPS compared to the ARC A770’s 96 FPS.
- Moreover, the RX 7600 delivers an outstanding 32.2% higher 1% low performance, achieving 90 FPS, surpassing the ARC A770’s 65 FPS.
Call Of Duty Modern Warfare II
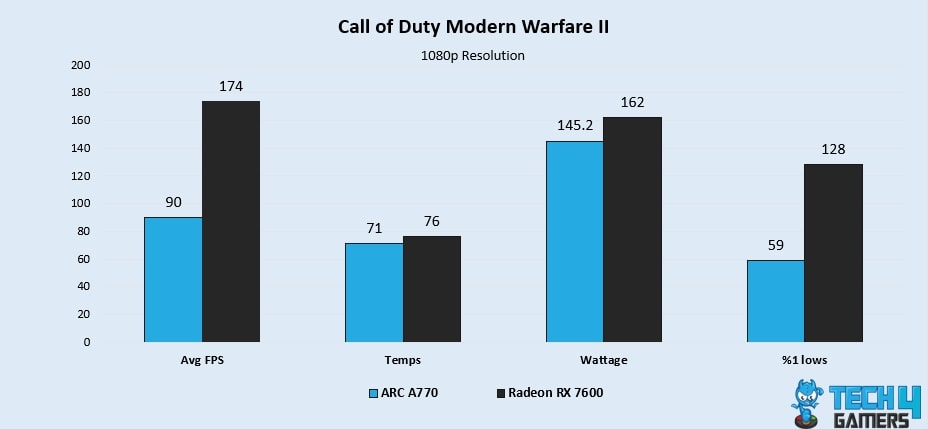
- In this gameplay, the RX 7600 outperforms the ARC A770 with a 63.6% advantage, achieving an impressive 174 FPS compared to the ARC A770’s 90 FPS.
- Moreover, the RX 7600 exhibits a remarkable 73.7% higher 1% low performance, achieving 128 FPS, surpassing the ARC A770’s 59 FPS.
Cyberpunk 2077
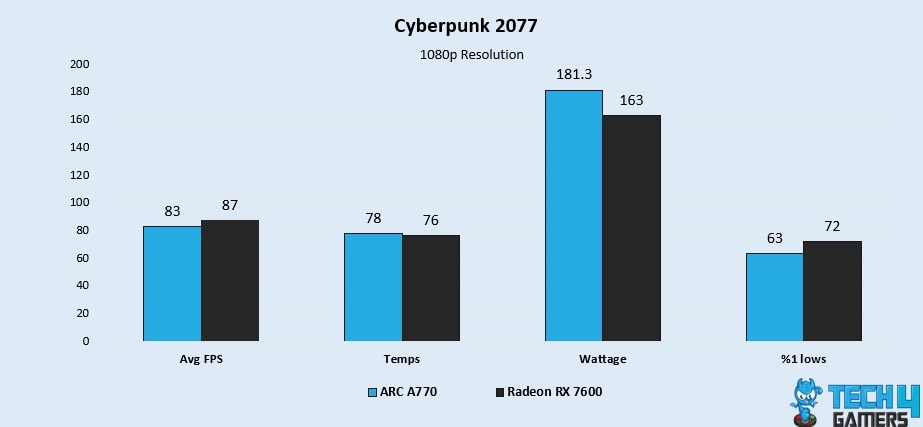
- While testing Cyberpunk 2077 in our benchmarks, the RX 7600 showcases a 4.7% advantage, achieving 87 FPS compared to the ARC A770’s 83 FPS.
- Moreover, the RX 7600 showcases a 13.3% advantage in 1% low performance, achieving 72 FPS and outperforming the ARC A770’s 63 FPS.
Cyberpunk 2077 (XeSS and FSR2 Quality + RT Ultra)
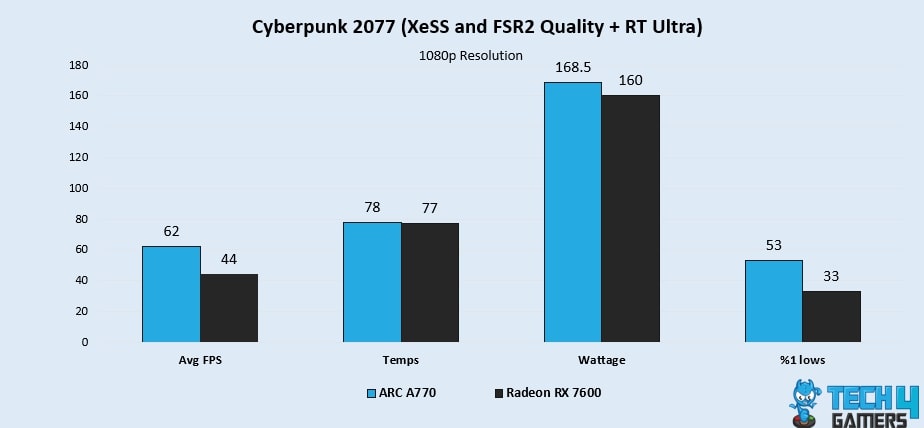
- Surprisingly, the ARC A770 dominates the RX 7600 with an impressive 33.9% increase in average FPS, achieving 62 FPS compared to the RX 7600’s 44 FPS.
- Furthermore, the RX 7600 demonstrates a 46.5% lower 1% low performance, achieving 33 FPS, compared to the ARC A770’s 53 FPS.
Overall Gaming Performance
| Featured | Arc A770 | RX 7600 |
|---|---|---|
| Average FPS | 64.8📈 | 75.2📈 |
| %1 lows | 52📉 | 60📉 |
| Winner: AMD's Radeon RX 7600 | ||
When considering the overall gaming performance, the RX 7600 takes the lead with an average of 75.2 FPS, surpassing the ARC A770’s 64.8 FPS. To sum up, the RX 7600 solidifies its position as the superior choice for gamers by outperforming the ARC A770 by a significant margin of 14.8% in terms of FPS performance.
Average Power Consumption
| Featured | Arc A770 (W) | RX 7600 (W) |
|---|---|---|
| Average Power Consumption | 172.5⚡️ | 161.6⚡️ |
| Winner: AMD's Radeon RX 7600 | ||
During our benchmark tests, the RX 7600 demonstrated impressive efficiency, consuming an average of 161.6W, while the ARC A770 exhibited higher power consumption, averaging 172.5W. The RX 7600 showcases an average power consumption that is approximately 6.5% lower.
Average Thermal Statistics
| Featured | Arc A770 (°C) | RX 7600 (°C) |
|---|---|---|
| Average Temperature | 78.1🌡️ | 76.5🌡️ |
| Winner: AMD's Radeon RX 7600 | ||
Moreover, the RX 7600 stands out for its impressive thermal efficiency, boasting a cool average temperature of 76.5°C. The ARC A770 falls slightly behind with an average temperature of 78.1°C. The benchmark results strongly support the RX 7600 as the winner in terms of thermal efficiency, with a narrow lead of 2% over the ARC A770.
Pricing And Availability
| GPU | MSRP | Current Price |
|---|---|---|
| ARC A770 | 💲329 | 💲299 |
| Radeon RX 7600 | 💲269 | 💲269 |
| Difference | 20% | 10.5% |
This price difference of about 11% makes the RX 7600 a more cost-effective choice for budget-conscious consumers. Moreover, regarding availability, the RX 7600 enjoys wider availability and presence in multiple retail channels. On the other hand, the ARC A770, being a first-generation offering from Intel, might face comparatively limited availability.
Final Verdict – What We Recommend?
Radeon RX 7600: With an impressive 14.8% lead in average FPS performance and consuming around 6.5% less power on average, the RX 7600 delivers an outstanding gaming experience. It’s widely available and cost-effective, making it a top choice for gamers and content creators who want high-performance graphics without spending too much.
Intel Arc A770: While the Intel Arc A770 boasts impressive hardware specs and innovative features, it falls short in gaming performance and power efficiency compared to the Radeon RX 7600. Despite its higher clock speeds and larger VRAM capacity, it struggles to match the RX 7600’s superior gaming capabilities and efficiency. Its higher price and potential availability issues might not appeal to budget-conscious consumers.
For gamers and content creators looking for high-performance graphics without breaking the bank, the Radeon RX 7600 is the preferred choice due to its exceptional gaming experience and cost-effectiveness.
More From Intel Arc A770
More From Radeon RX 7600
Thank you! Please share your positive feedback. 🔋
How could we improve this post? Please Help us. 😔
[Comparisons Specialist]
I’m a passionate computer hardware expert specializing in CPUs and GPUs. With a lifelong curiosity for hardware and extensive hands-on experience, I provide valuable insights, practical advice, and in-depth analysis on these components. Engaging with the hardware community, I exchange knowledge and stay at the forefront of technological advancements.
Get In Touch: uzair@tech4gamers.com