If you’re in the market for a mid-to-high-end graphics card for your PC, then the RX 6600 XT and RTX 3050 are two solid options. But which one is better? Today, we find out as we compare the RX 6600 XT vs RTX 3050 with our extensive benchmark tests.
Key Takeaways
- The Radeon RX 6600 XT is based on a 7nm node from TSMC, while the GeForce RTX 3050 uses an 8nm node from Samsung.
- According to our testing, the RX 6600 XT is 45.4% faster than the RTX 3050 in 1080P gaming.
- Moreover, we also found that the RTX 3050 is 4.94% more power efficient than AMD’s Radeon RX 6600 XT.
- In addition, during benchmarking, the RX 6600 XT shows weaker thermal performance, running 10.8% warmer than the GeForce RTX 3050, on average.
Comparison Table
| Technical Specs | GeForce RTX 3050 | Radeon RX 6600 XT |
| GPU Name | GA106 | Navi 23 |
| Architecture | Ampere | RDNA 2.0 |
| Transistors | 12,000 million | 11,060 million |
| Shading Units | 2560 | 2048 |
| Tensor Cores | 80 | NA |
| RT Cores | 20 | 32 |
| TMUs | 80 | 128 |
| ROPs | 32 | 64 |
| L1 Cache | 128 KB (per SM) | 128 KB per Array |
| L2 Cache | 2 MB | 2 MB |
| Memory Bus Width | 128 bit | 128 bit |
| Memory Bandwidth | 224.0 GB/s | 256.0 GB/s |
| Suggested PSU | 300W | 450W |
| Release Date | Jan 4th, 2022 | Jul 30th, 2021 |
| Approximated Price | 230 USD | 220 USD |
| Best Variants | Best RTX 3050 Cards | – |
Architectural Differences
- Process Node: The RTX 3050 utilizes an advanced 8nm process node, whereas the RX 6600 XT employs a 7nm process node, providing it with potential advantages in power efficiency and thermal performance.
- Clock Speed: The RTX 3050 operates at a base clock of 1552 MHz with a boost clock of 1777 MHz, while the RX 6600 XT boasts a higher base clock of 1968 MHz and an even more impressive boost clock of 2589 MHz, which can potentially result in superior gaming performance.
- VRAM: Both cards are equipped with 8GB of GDDR6 VRAM, ensuring sufficient memory for gaming at various resolutions and settings.
- TDP: The RTX 3050 demonstrates a lower TDP of 130W, indicating potential power efficiency and less heat generation. In contrast, the RX 6600 XT features a higher TDP of 160W, which may result in increased power consumption and heat production.
- Supported Technologies: The RTX 3050 incorporates DLSS (Deep Learning Super Sampling), an AI-powered upscaling technology that enhances gaming visuals and performance. On the other hand, the RX 6600 XT supports FSR (FidelityFX Super Resolution), an AMD technology designed to improve game performance by upscaling graphics.
RX 6600 XT Vs RTX 3050: Gaming Benchmarks
Next, let’s move on to the gaming performance of the two graphics cards. We’ll be comparing the performance across 10 games at 1080P. Please note that these figures can vary slightly from actual in-game performance because of inconsistencies in monitoring software. With that out of the way, here is a look at our test bench:
- OS: Windows 11
- CPU: Intel Core i7-13700K
- Motherboards: ASRock Z790 Taichi Lite Motherboard
- RAM: Kingston Fury Renegade RGB DDR5 32GB 7200MHz
- SSD: XPG GAMMIX S70 BLADE 2TB NVMe SSD
- PSU: Enermax Revolution D.F. X 1050W
- CPU Cooler: MSI MAG CORELIQUID E360 CPU Liquid Cooler
Assassin’s Creed: Valhalla
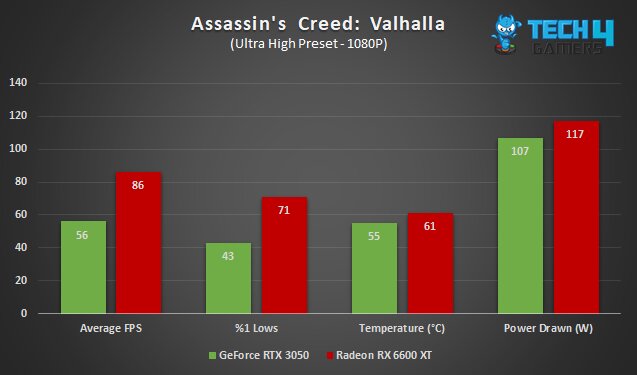
- In our tests, the Radeon RX 6600 XT started off strong with a 53% average FPS lead in Assassin’s Creed: Valhalla, scoring 86 FPS, while the RTX 3050 only managed 56 FPS.
- Moving to the %1 lows, the Radeon RX 6600 XT has a big lead again with 71 FPS. The GeForce RTX 3050 replies with 43 FPS.
- Additionally, when it comes to thermal performance, our tests revealed that the RX 6600 XT tends to run somewhat hotter, with an average of around 61°C, while its Nvidia competitor maintains a cooler operating of approximately 55°C.
- Looking at the power draw figures, the Radeon RX 6600 XT is again on the worse side, drawing 10 watts more than the GeForce RTX 3050.
Horizon Zero Dawn
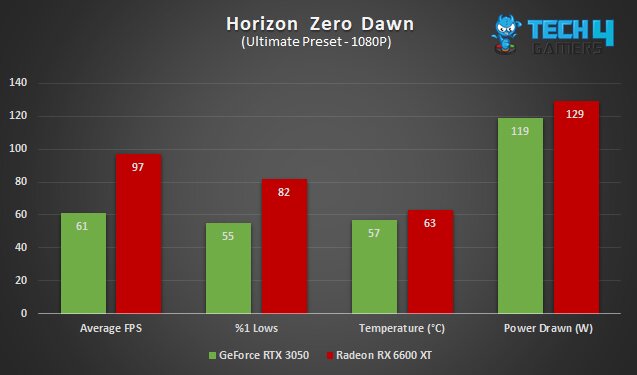
- Our tests have shown that when running Horizon Zero Dawn at the ultimate quality preset, the Radeon RX 6600 XT averages an impressive 97 FPS. On the other hand, the GeForce RTX 3050 lags behind with an average of 61 FPS.
- The Radeon RX 6600 XT scores 82 FPS in the %1 lows, and the GeForce RTX 3050 only manages 55 FPS in reply.
- In terms of temperatures, our tests have revealed that the Radeon RX 6600 XT averages around 63°C, while the GeForce RTX 3050 maintains a cooler average temperature of 57°C.
- Nvidia RTX 3050 uses 119 watts of power on average, and the Radeon RX 6600 XT runs at 129 watts.
Hitman 3
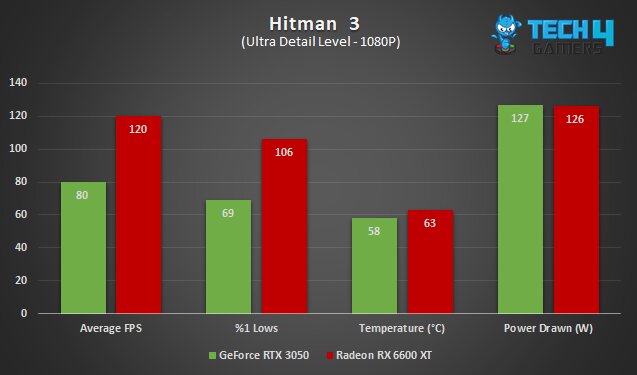
- In our Hitman 3 benchmark, the Radeon RX 6600 XT delivered an impressive average of 120 FPS, while the GeForce RTX 3050 lagged significantly behind, averaging only 80 FPS, which is exactly 50% lower in terms of performance.
- The GeForce RTX 3050 shows 69 FPS as the %1 low score, and the Radeon RX 6600 XT is miles ahead with 106 FPS.
- During our testing, the GeForce RTX 3050 maintained an average temperature of 58°C, while the Radeon RX 6600 XT ran slightly hotter at an average of 63°C.
- The GeForce RTX 3050 happens to draw more power in this instance, by only 1 watt, than the Radeon RX 6600 XT, at 127 watts.
Days Gone
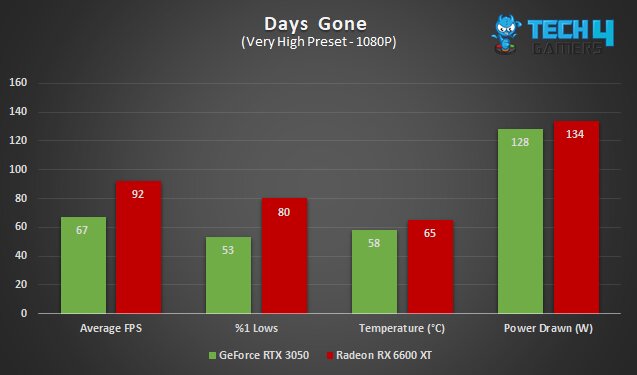
- Moving on to Days Gone now. The Radeon RX 6600 XT top scores again with 92 FPS on average during our testing, and the GeForce RTX 3050 scores 67 FPS in reply.
- Regarding the %1 lows, the Radeon RX 6600 XT retains its position at the top, scoring 80 FPS. The GeForce RTX, 3050, notches up 53 FPS and so is 50% behind.
- Here, the Radeon RX 6600 XT runs at 65°C on average in our benchmark while the GeForce RTX 3050 continues to impress with thermal performance, running 7°C cooler.
- The Radeon RX 6600 XT draws 134 watts, slightly higher than the GeForce RTX 3050 mark of 128 watts.
God of War
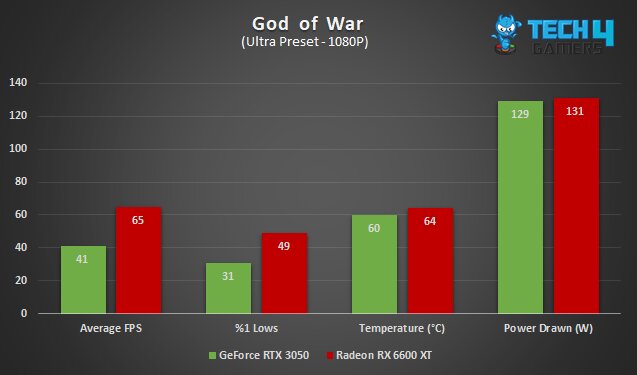
- In our benchmarking, Nvidia’s GeForce RTX 3050 averaged 41 FPS, falling behind the Radeon RX 6600 XT by 58.5%.
- A similar contrast is recorded between the two GPUs in the %1 lows, where the GeForce RTX 3050 achieves 31 FPS and the AMD Radeon RX 6600 XT scores 49 FPS.
- The GeForce RTX 3050, on average, runs at 60°C. That is 4°C cooler than the Radeon RX 6600 XT during our testing.
- Again, there’s a minimal difference between the power drawn by the two graphics cards, as the GeForce RTX 3050 consumes 129 watts, and its AMD competitor counters that with 131 watts.
Red Dead Redemption 2
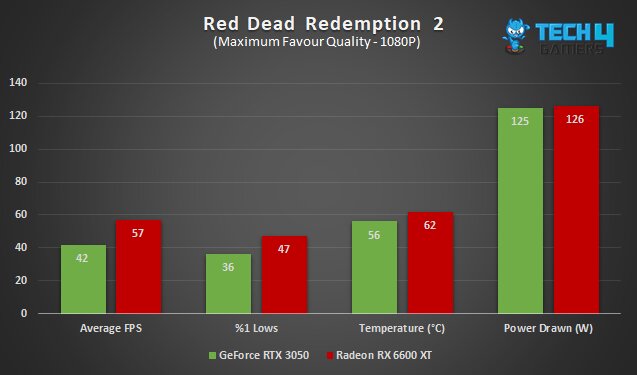
- The struggle continues for the GeForce RTX 3050 in our gameplay, as it averages 42 FPS in Red Dead Redemption 2 at maxed-out settings. The Radeon RX 6600 XT struggles, too, scoring 57 FPS on average.
- Similar results are seen in the %1 lows. The Radeon RX 6600 XT falls to 47 FPS, while the GeForce RTX 3050 manages only 36 FPS.
- In our testing, the Radeon RX 6600 XT was observed to run at an average temperature that was 6 degrees Celsius higher than the GeForce RTX 3050.
- The two graphics cards show almost no difference in power draw here, only an ignorable 1-watt difference.
Forza Horizon 5
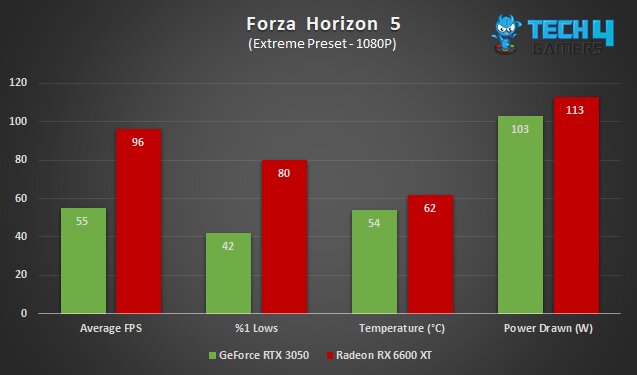
- Another massive victory for the Radeon RX 6600 XT – this time in Forza Horizon 5 – we found it scores 96 FPS on average, and the GeForce RTX 3050 struggles to catch up, achieving only 55 FPS.
- Regarding the %1 lows, the Radeon RX 6600 XT holds its ground and scores 90% higher than the GeForce RTX 3050.
- Again, we’re seeing familiar figures in terms of thermals. The Radeon RX 6600 XT runs at 62°C on average, and the GeForce RTX 3050 counters that with cooler temperatures of around 54°C.
- The Radeon RX 6600 XT again draws somewhat more power than the GeForce RTX 3050 – 9.74% more inexact.
Dying Light 2
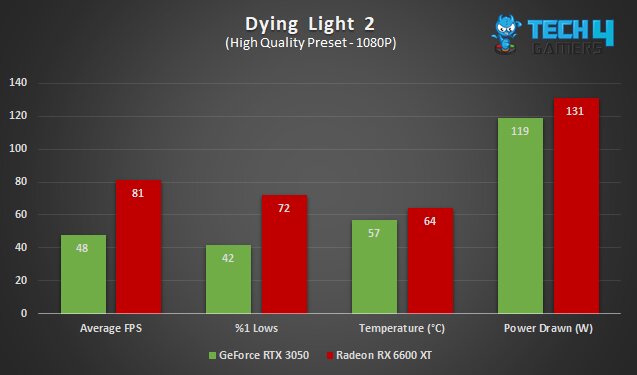
- The Radeon RX 6600 XT continues to go strong, averaging 81 FPS in Dying Light 2. The GeForce RTX 3050 was seen trailing far behind with 48 FPS – a 68.75% difference.
- The %1 lows tell the same story, showing a big contrast between the two graphics cards. Specifically, the Radeon RX 6600 XT manages 72 FPS, and the GeForce RTX 3050 manages 42 FPS.
- The Radeon RX 6600 XT runs warmer again in our examination, averaging around 64°C, 12.2% higher than the GeForce RTX 3050.
- The GeForce RTX 3050 proves to be more power efficient again, albeit it doesn’t impress us, considering it only managed 48 FPS. It drew 119 watts on average, and the Radeon RX 6600 XT drew 131 watts of power.
Cyberpunk 2077
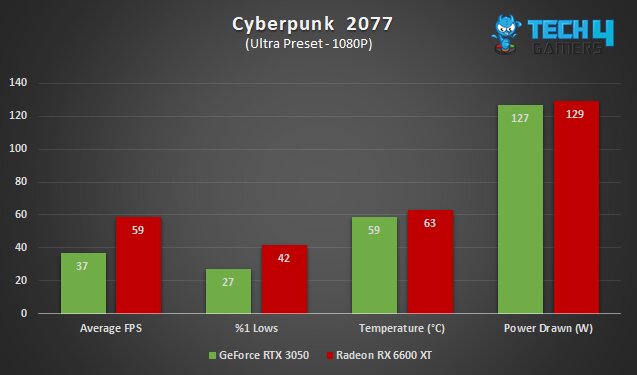
- Things are really dull for the GeForce RTX 3050 in Cyberpunk 2077, as it only manages 37 FPS on average on the ultra preset during our gameplay. The Radeon RX 6600 XT shows much better numbers, with 59 FPS on average.
- Looking at the %1 lows, the situation worsens for the GeForce RTX 3050. It manages 27 FPS, while the Radeon RX 6600 XT is 55% better with 42 FPS.
- The temperature figures are pretty comparable as per our tests; an average 4°C difference between the two cards is seen here.
- Same as the temperature the power drawn by the two graphics cards is similar. The Radeon RX 6600 XT draws 129 watts, and the GeForce RTX 3050 draws 127 watts of power.
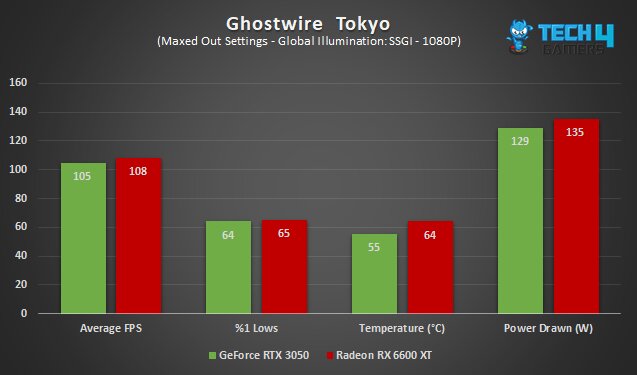
- In this final test, the GeForce RTX 3050 catches up to the Radeon RX 6600 XT and only lags the AMD card by 2.8% in average FPS.
- Our tests reveal that there is only a 1 FPS difference between the two graphics cards when it comes to %1 FPS figures.
- Regarding thermals, the Radeon RX 6600 XT runs at 64°C – much hotter again compared to the GeForce RTX 3050 running at only 55°C.
- Looking at the power draw of our benchmark sheet, the Radeon RX 6600 XT draws 135 watts, and the GeForce RTX 3050 betters that with 129 watts.
Also Read: GTX 1650 vs RTX 3050
Overall Gaming Performance
To conclude the 1080P Radeon RX 6600 XT vs GeForce RTX 3050 gaming results, we’ve derived a mean of the average FPS recorded by both GPUs across the 10 tests.
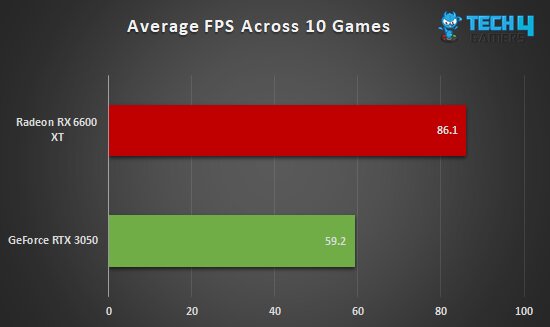
- During our tests, we saw the Radeon RX 6600 XT blow the GeForce RTX 3050 out of the water with 86.1 FPS on average. The GeForce RTX 3050 averages 59.2 FPS across the 10 titles.
- So, the AMD Radeon RX 6600 XT is a whopping 45.4% faster in 1080P gaming compared to the GeForce RTX 3050.
Power Draw
Next, let’s discuss the average power drawn across the 10 games for both GPUs. Remember that the Radeon RX 6600 XT has a TDP rating of 160 watts, while the GeForce RTX 3050 is rated at 130 watts.
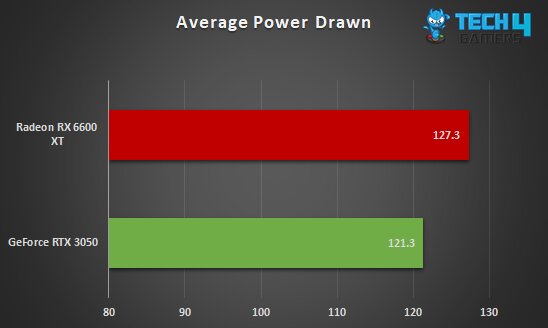
- While we were testing out power consumption, the AMD Radeon RX 6600 XT draws 127.3 watts of power on average, while the GeForce RTX 3050 draws 121.3 watts.
- The GeForce RTX 3050 is thus 4.94% more power efficient.
- Both the graphics cards perform adequately according to their TDP ratings, but the Radeon RX 6600 XT stays well below its TDP rating.
Thermal Statistics
Next, let’s look at the thermal statistics. For that, we’re averaging the temperature recorded by the two graphics cards across the 10 games.
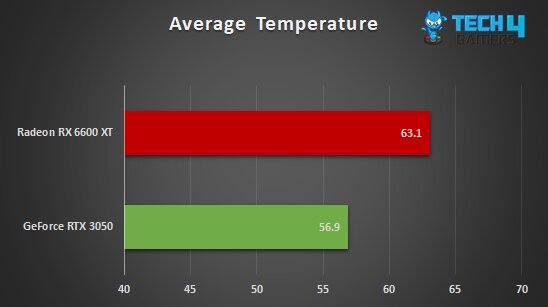
- On average, we found the Radeon RX 6600 XT ran at 63.1°C during the 1080P gaming tests. On the other hand, the Nvidia GeForce RTX 3050 ran at a much cooler 56.9°C.
- The GeForce RTX 3050 is thus 10.8% more thermally efficient than the Radeon RX 6600 XT.
Also, make sure to read about safe idle GPU temperatures here.
Pricing And Availability
- As of our research, the RTX 3050 is priced at around $230 and is readily available on popular platforms such as Newegg.
- Similarly, the Radeon RX 6600 XT is priced at $220, and it can be easily found on Newegg, making it a competitive option.
- Comparing the two, the RTX 3050 carries a slightly higher price point, with a difference of approximately 4.4% compared to the RX 6600 XT.
RX 6600 XT Vs RTX 3050: Which One Would We Recommend?
- Our research and testing indicate a significant 45.4% performance advantage over the RTX 3050 in this resolution. Gamers who prioritize smooth and high-quality gaming experiences should lean towards the RX 6600 XT.
- For those who value power efficiency and lower energy consumption, the RTX 3050 holds an edge, consuming around 4.94% less power than the RX 6600 XT. This not only helps reduce monthly energy bills but also contributes to a greener, more sustainable gaming setup
- Our thermal testing shows that the RTX 3050 maintains significantly cooler temperatures, with an advantage of approximately 10.8% compared to the RX 6600 XT. This ensures that your system operates within safe temperature limits, enhancing reliability and longevity.
- Both cards offer impressive value for their respective strengths. While the RTX 3050 carries a slightly higher price point (around 4.4% more expensive), it’s still a competitive choice, considering its efficiency and performance.
Pros And Cons
| GPU | Pros | Cons |
| Radeon RX 6600 XT |
|
|
| GeForce RTX 3050 |
|
|
Thank you! Please share your positive feedback. 🔋
How could we improve this post? Please Help us. 😔
[Hardware Reviewer]
Hi! I’m Ali Tauseef, and I have been writing for Tech4Gamers since 2022. I love all things computer hardware but am particularly fond of CPUs and motherboards, and I like to stay up-to-date about the latest advancements in these worlds, and when possible, write about it. When I’m not doing that, I like to get into a little FPS action in CS2 or get lost in the vast world of RDR2.
Get In Touch: ali@tech4gamers.com


Feedback By:
Mitchell
Robert
Lee
John
Jessica
David
Wilson
Lisa