RTX 4060 Ti
Rated: 8.5/10
RX 6800 XT
Rated: 9/10
Pros And Cons
| Graphics Card | Pros | Cons |
|---|---|---|
| RTX 4060 Ti | ✅ Higher Thermal Efficiency ✅ Better Ray-Tracing Performance | ❌ Lower Gaming Performance |
| RX 6800 XT | ✅ Excellent Overall Gaming Performance ✅ Better Rasterized Performance | ❌ Higher Power Consumption |
- Our benchmarks reveal a clear performance advantage for the RX 6800 XT. It delivers a 24.2% higher frame rate than the RTX 4060 Ti.
- The RTX 4060 Ti shines in both power efficiency and thermals. It consumes significantly less power, about 52.2%, and runs 12.1% cooler than the RX 6800 XT.
- As of early March 2024, the RTX 4060 Ti boasts a significantly lower price point than the RX 6800 XT, offering an impressive 84% cost advantage.
- We recommend the RTX 4060 Ti for budget-conscious gamers who prioritize efficiency. If you’re willing to compromise on price and thermals for maximum gaming performance, we recommend the RX 6800 XT.
Comparison Table
| Technical Specs | GeForce RTX 4060 Ti | Radeon RX 6800 XT |
|---|---|---|
| Architecture | Ada Lovelace | RDNA 2.0 |
| CUDA Cores | 4352 | 4608 |
| Tensor Cores | 136 | NA |
| RT Cores | 34 | 72 |
| TDP | 165W | 300W |
| Memory Bus Width | 128 bit | 256 bit |
| Release Date | May 18th, 2023 | Oct 28th, 2020 |
| MSRP | 499 USD | 530 USD |
| Best Variants | Best RTX 4060 Ti Graphic Cards | Best RX 6800 XT Graphic Cards |
Gamers on the hunt for a powerful GPU upgrade have two strong contenders in the battle of the RTX 4060 Ti from the industry leader vs the RX 6800 XT from AMD, a respected competitor known for innovation. To pick the perfect card for your ultimate gaming experience, test their gaming benchmark results to see which option reigns supreme.
Architectural Difference
- Process Node: Regarding fabrication, the RTX 4060 Ti boasts a cutting-edge 5nm process node, a step ahead of the RX 6800 XT’s 7nm node.
- Clock Speed: Moreover, speaking of clock speeds, the RTX 4060 Ti leads with a Base Clock of 2310 MHz and a Boost Clock of 2535 MHz, leaving the RX 6800 XT behind with its Base Clock of 1825 MHz and Boost Clock of 2015 MHz.
- VRAM: Additionally, turning our attention to VRAM, both contenders offer a formidable 16GB GDDR6 VRAM, providing ample space for intense gaming and resource-hungry applications.
- TDP: Furthermore, regarding thermal design power, the RTX 4060 Ti keeps its cool with a 165W TDP, whereas the RX 6800 XT demands more power with its higher 300W TDP.
- Supported Technologies: Finally, in advanced technologies, the RTX 4060 Ti introduces DLSS for optimized performance, while the RX 6800 XT showcases its prowess with FidelityFX Super Resolution (FSR).
Gaming Benchmarks – 1440p
We’ll run them through benchmarks in eight popular games to clearly understand the gaming power of the RTX 4060 Ti vs RX 6800 XT. We’ll focus on average FPS and 1% lows to better understand their performance. We used the following setup to run the GPUs:
Testing Rig
- CPU: AMD Ryzen 7 7800X3D
- Motherboard: MSI B650M Project Zero
- Memory: 32 GB G.Skill Trident Z5 RGB DDR5 6600 CL34
- Power Supply: Thermaltake 1200W ToughPower PF1
- CPU Cooler: Corsair iCUE H150i Elite
- SSD: 2 TB CORSAIR MP600 Elite NVMe
- Operating System: Windows 10 Pro
Remnant 2
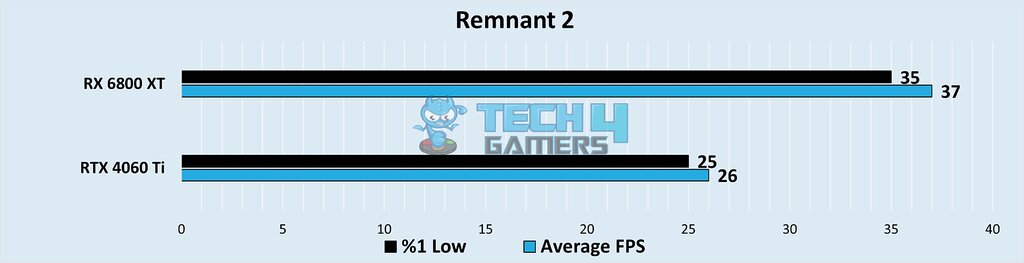
- In our testing, the RX 6800 XT demonstrated a clear performance advantage. It hit an average of 37 FPS, outpacing the RTX 4060 Ti’s 26 FPS by 34.9%.
- The RX 6800 XT performed better in Remnant 2 regarding 1% low frame rates, achieving 25 FPS compared to 35 FPS of the RTX 4060 Ti.
Ratchet & Clank Rift Apart
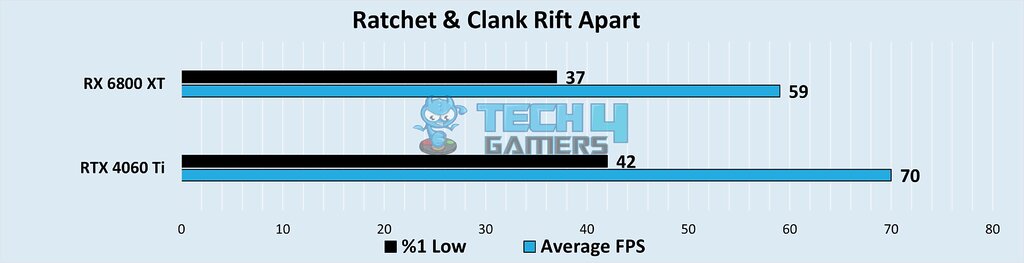
- Things got interesting when we switched gears! The RTX 4060 Ti flipped the script with an average FPS of 70, showcasing a 17% advantage over the RX 6800 XT’s 59.
- The 1% low benchmark reveals the RX 6800 XT’s advantage. It delivers 42 FPS, outperforming the weaker 37 FPS of the RTX 4060 Ti.
Star Wars Jedi Survivor (Ray Tracing On)
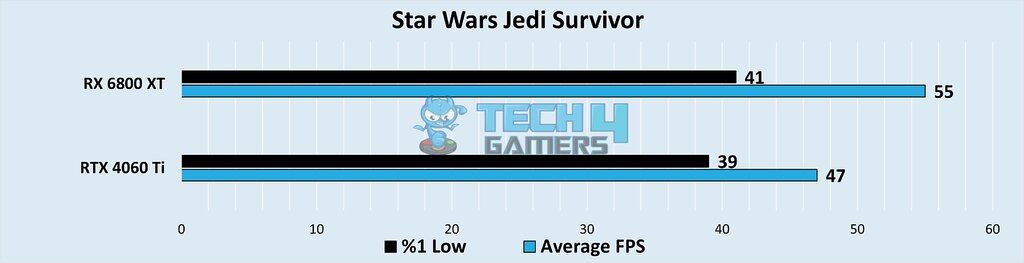
- The RX 6800 XT flexed its gaming muscle during our testing, achieving an average FPS of 55. This marks a 15.6% advantage over the RTX 4060 Ti’s 47.
- In Star Wars Jedi Survivor, we found the RX 6800 XT with a 39 FPS result. This puts it slightly behind the RTX 4060 Ti, which achieves 41 FPS regarding minimum frame rates.
Resident Evil 4 Remake
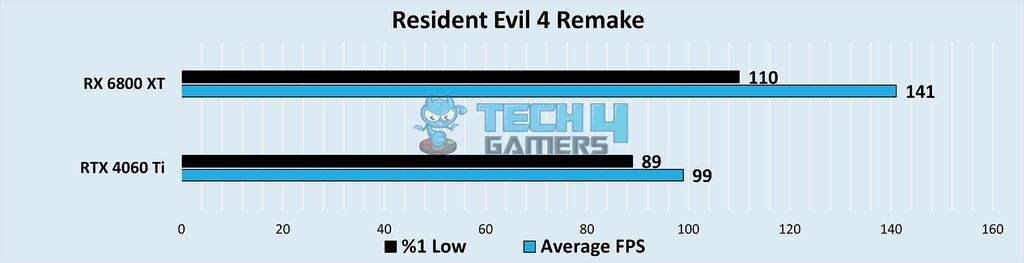
- The RX 6800 XT impressed us in this benchmark! It cranked out an average of 141 FPS, a whopping 35% faster than the RTX 4060 Ti’s 99 FPS.
- Our analysis of minimum frame rates revealed that the RX 6800 XT achieved a robust 1% low of 89 FPS, outperforming the RTX 4060 Ti’s 110 FPS.
The Last of Us Part 1
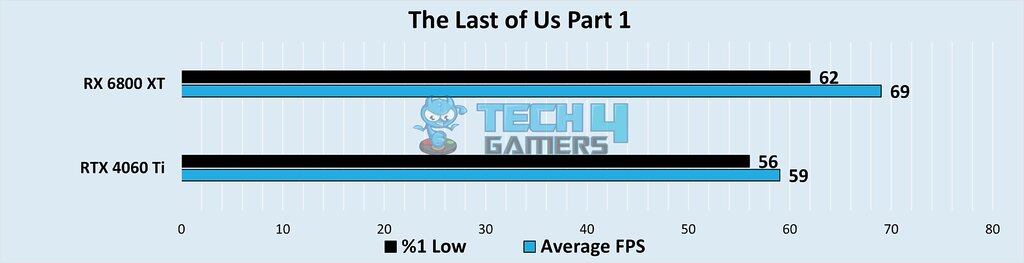
- The RX 6800 XT maintained a slight advantage in our tests. It achieved an average FPS of 69, edging out the RTX 4060 Ti’s 59 by a narrow 5.2% margin.
- We analyzed 1% lows and saw the RX 6800 XT demonstrate its strength. In the Last of Us part 1, it hit 56 FPS, edging the RTX 4060 Ti’s 62 FPS.
Hogwarts Legacy
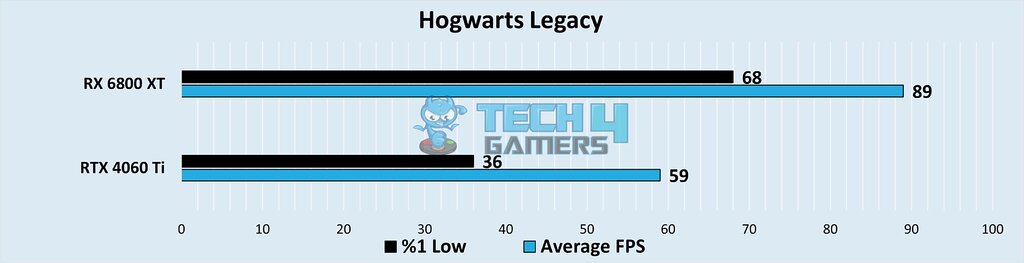
- The RX 6800 XT in our benchmark pulled ahead with an average FPS of 89. This represents a staggering 40.54% performance advantage over the RTX 4060 Ti’s 59.
- The RX 6800 XT achieved a robust 1% low frame rate of 36 FPS in Hogwarts Legacy, significantly outperforming the RTX 4060 Ti’s lagging 68 FPS.
Returnal
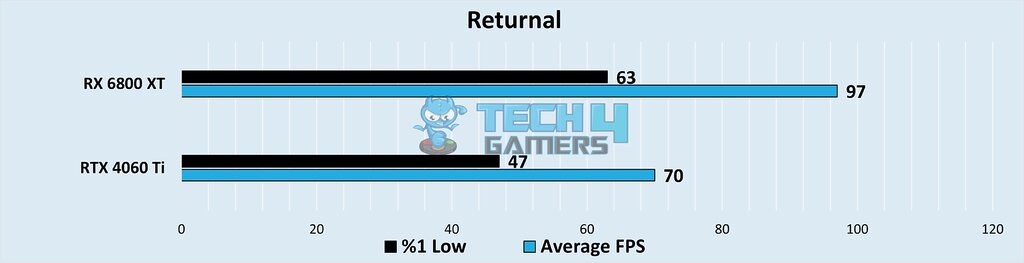
- Our tests highlighted a clear advantage for the RX 6800 XT. It achieved an average FPS of 97, leaving the RTX 4060 Ti’s 70 behind by 32.3%.
- The RTX 4060 Ti’s dominance is 1% low performance. It secured a solid lead with a 1% low of 63 FPS, exceeding the RX 6800 XT’s 47 FPS.
Forspoken (Ray Tracing On)
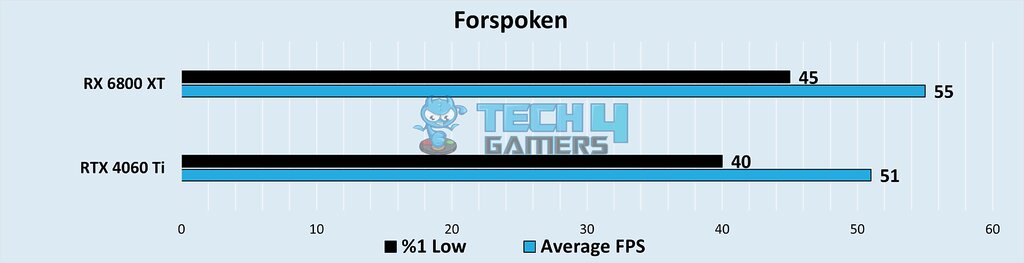
- The RX 6800 XT demonstrated its prowess in our benchmarks. It achieved an average FPS of 55, securing a 7.5% advantage over the RTX 4060 Ti’s 51.
- Focusing on 1% lows, the RX 6800 XT has a narrow lead. It achieved 40 FPS, while the RTX 4060 Ti closely trailed at 45 FPS in Forspoken while the ray-tracing was on.
Overall Gaming Performance
| Feature | RTX 4060 Ti | RX 6800 XT |
|---|---|---|
| Average FPS | 📈 60.1 | 📈 75.2 |
| 1% Lows | 📉 46.7 | 📉 57.6 |
| Winner: AMD Radeon RX 6800 XT | ||
The RX 6800 XT proves its gaming dominance over the RTX 4060 Ti. It boasts a higher average FPS, better 1% lows, tackles dips in performance better with stronger minimums, and a significant 24.2% FPS advantage in demanding scenarios.
Power Consumption
| Game | RTX 4060 Ti (W) | RX 6800 XT (W) |
|---|---|---|
| Remnant 2 | 162.6 | 281 |
| Ratchet & Clank Rift Apart | 144.5 | 200 |
| Star Wars Jedi Survivor | 154.2 | 279 |
| Resident Evil 4 Remake | 162.1 | 181 |
| The Last of Us Part 1 | 141.2 | 225 |
| Hogwarts Legacy | 152.3 | 280 |
| Returnal | 152.1 | 178 |
| Forspoken | 147.6 | 253 |
| Average Power Consumption | ⚡152 | ⚡235 |
| Winner: Nvidia GeForce RTX 4060 Ti | ||
The RTX 4060 Ti demonstrates impressive power efficiency in our testing, boasting a 52.2% lead over the RX 6800 XT. This efficiency advantage strengthens the position of the RTX 4060 Ti as a compelling choice for power-conscious gamers.
Thermal Efficiency
| Game | RTX 4060 Ti (Celsius) | RX 6800 XT (Celsius) |
|---|---|---|
| Remnant 2 | 62 | 69 |
| Ratchet & Clank Rift Apart | 57 | 63 |
| Star Wars Jedi Survivor | 61 | 69 |
| Resident Evil 4 Remake | 61 | 69 |
| The Last of Us Part 1 | 57 | 61 |
| Hogwarts Legacy | 58 | 68 |
| Returnal | 60 | 68 |
| Forspoken | 59 | 68 |
| Average Temperature | 🌡️59.4 | 🌡️66.8 |
| Winner: Nvidia GeForce RTX 4060 Ti | ||
The RTX 4060 Ti excels in heat management, a key factor for stable performance and longevity. It operates at cooler temperatures than the RX 6800 XT, demonstrating a significant 12.1% improvement in thermal efficiency. This advantage positions the RTX 4060 Ti as a leader in temperature control.
Pricing And Value
| Graphics Card | Launch MSRP | Current Price |
|---|---|---|
| RTX 4060 Ti | 💲499 | 💲379 |
| RX 6800 XT | 💲649 | 💲699 |
| Difference | 30% | 84% |
The RX 6800 XT has a slightly higher price tag. However, evaluating this cost in terms of its performance potential, features like ray tracing, and the games you enjoy is essential. On the other hand, the attractive MSRP of the RTX 4060 Ti might be more budget-friendly, making it an appealing option for cost-conscious buyers.
RX 6800 XT Vs RTX 4060 Ti: What We Recommend?
RX 6800 XT: If raw gaming power is your top priority, the RX 6800 XT is the way to go. It delivers consistently higher frame rates and smoother overall performance in most games. Considering the price difference, the RX 6800 XT usually costs more.
RTX 4060 Ti: If you want a card that prioritizes efficiency and runs cooler, the RTX 4060 Ti is the clear winner. It uses significantly less power and maintains lower temperatures for a quieter.
Finally, ensure your power supply can handle your chosen card, especially the more demanding RX 6800 XT. The bottom line is that both cards offer excellent value, but they truly excel in different areas.
More from RX 6800 XT
More from RTX 4060 Ti
Thank you! Please share your positive feedback. 🔋
How could we improve this post? Please Help us. 😔
[Comparisons Specialist]
I’m a passionate computer hardware expert specializing in CPUs and GPUs. With a lifelong curiosity for hardware and extensive hands-on experience, I provide valuable insights, practical advice, and in-depth analysis on these components. Engaging with the hardware community, I exchange knowledge and stay at the forefront of technological advancements.
Get In Touch: uzair@tech4gamers.com