

When it comes to choosing the ideal graphics card for your gaming or creative needs, both RTX 3080 and RX 6800 XT stand out as formidable contenders. In this comprehensive comparison between the RTX 3080 vs RX 6800 XT, I’ve dedicated time to dissect their performance, features, and capabilities meticulously.
Key Takeaways
- On paper, I found that the RTX 3080 boasts more cores, but in my experience, the RX 6800 XT excels with higher clock speeds, greater VRAM capacity, and a lower TDP.
- Moreover, when it came to benchmark testing, my findings revealed that the RX 6800 XT outperformed the RTX 3080 at 1440p, and the RX 6800 XT maintained its lead with a small but noticeable 2.65% advantage.
- In my testing, the RTX 3080 consumed approximately 27.5% more power at 1440p. However, it’s worth noting that both GPUs performed equally well in terms of thermal efficiency.
Comparison Table
| Technical Specs | GeForce RTX 3080 | Radeon RX 6800 XT |
| GPU Name | GA102 | Navi 21 |
| Architecture | Ampere | RDNA 2.0 |
| Transistors | 28,300 million | 26,800 million |
| Shading Units | 8704 | 4608 |
| Tensor Cores | 272 | NA |
| RT Cores | 68 | 72 |
| TMUs | 272 | 288 |
| ROPs | 96 | 128 |
| L1 Cache | 128 KB (per SM) | 128 KB per Array |
| L2 Cache | 5 MB | 4 MB |
| Memory Bus Width | 320 bit | 256 bit |
| Memory Bandwidth | 760.3 GB/s | 512.0 GB/s |
| Suggested PSU | 700W | 700W |
| Release Date | Sep 1st, 2020 | Oct 28th, 2020 |
| Approximated Price | 800 USD | 500 USD |
| Best Variants | BEST RTX 3080 Cards | BEST RX 6800 XT |
Architectural Differences
- Process Node: The RTX 3080 utilizes an 8nm process node, whereas the RX 6800 XT employs a 7nm process node, offering insights into their manufacturing technologies.
- Clock Speed: The RTX 3080 features a base clock of 1440 MHz and a boost clock of 1710 MHz, while the RX 6800 XT boasts a higher base clock of 1825 MHz and an even more impressive boost clock of 2250 MHz, providing a glimpse into their clock speed capabilities.
- VRAM: With 10GB of GDDR6X VRAM, the RTX 3080 offers substantial video memory, while the RX 6800 XT takes it a step further with a generous 16GB of GDDR6 VRAM, reflecting their VRAM capacities.
- TDP: The RTX 3080 carries a TDP (Thermal Design Power) of 320W, slightly higher than the RX 6800 XT’s 300W, highlighting their power consumption specifications.
- Supported Technologies: Finally, the RTX 3080 incorporates DLSS (Deep Learning Super Sampling) as part of its technology arsenal, while the RX 6800 XT opts for FSR (FidelityFX Super Resolution), showcasing their respective approaches to enhancing gaming experiences.
Also Read: RTX 3080 Vs 3080 Ti
RTX 3080 Vs RX 6800 XT: Gaming Benchmarks
Now, let’s dive into the crucial gaming benchmarks. I have tested both the RTX 3080 and RX 6800 XT in 10 games at 1440p to determine the superior graphics card.
Testing Rig:
- OS: Windows 11
- CPU: Intel Core i7-13700K
- Motherboards: ASRock Z790 Taichi Lite Motherboard
- RAM: Kingston Fury Renegade RGB DDR5 32GB 7200MHz
- SSD: XPG GAMMIX S70 BLADE 2TB NVMe SSD
- PSU: Enermax Revolution D.F. X 1050W
- CPU Cooler: MSI MAG CORELIQUID E360 CPU Liquid Cooler
Hitman 3
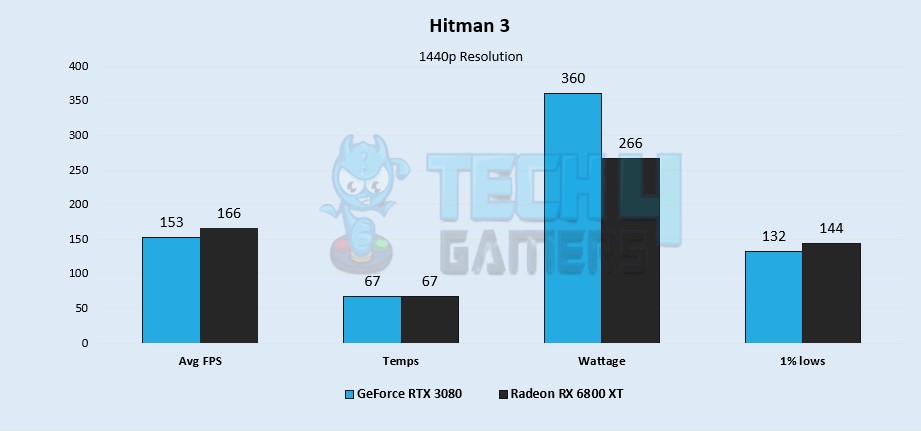
- In my 1440p gaming benchmark of Hitman 3, the RX 6800 XT maintains an average of 166 FPS, outperforming the RTX 3080’s 153 FPS by approximately 8.1%, showcasing a notable gap between the two cards.
- When it came to temperature tests, both GPUs operate at a consistent 67°C, displaying minimal variance.
- Furthermore, my benchmarks showed that the RTX 3080, despite its lower FPS, continues to exhibit high power consumption, drawing 30% more power than the RX 6800 XT, which consumes just 266W during gaming.
- The 1% lows further favored the RX 6800 XT, with only a drop to 144 FPS compared to the RTX 3080’s 132 FPS.
Similar Comparisons: RTX 3080 Vs RX 6900 XT
Cyberpunk 2077
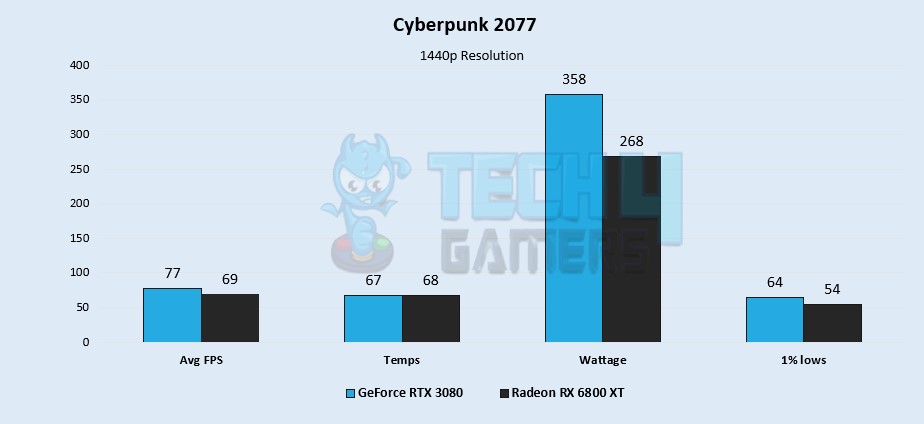
- Surprisingly, the RTX 3080 maintains an average of 77 FPS, surpassing the RX 6800 XT’s 69 FPS by approximately 10.9%, securing a clear victory for Team Green in terms of FPS performance.
- During my extended gaming sessions, the RTX 3080 maintained a temperature of 67°C, while the RX 6800 XT operated at 68°C.
- Despite its strong thermal performance, the RTX 3080 consumes roughly 28.7% more power than the RX 6800 XT, drawing 358W compared to the RX 6800 XT’s 268W, which is notable considering the RTX 3080’s FPS advantage.
- In 1% lows, the RTX 3080 continues its lead with a minimum of 64 FPS, while the RX 6800 XT drops to 54 FPS.
Also Read: RX 5700 XT Vs RTX 3080
Call Of Duty: Warzone
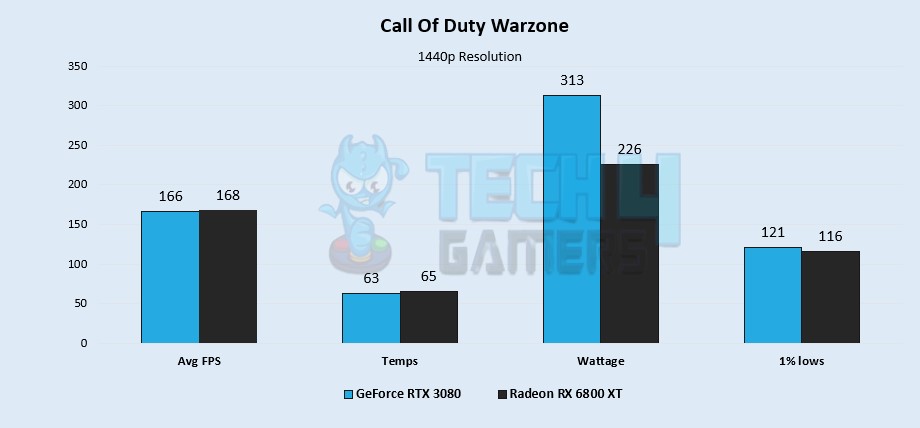
- In Warzone at 1440p, I found that the RTX 3080 and RX 6800 XT both deliver strong performance, with the RTX 3080 averaging 166 FPS and the RX 6800 XT slightly ahead at 168 FPS, giving Team Red a narrow 1.2% lead.
- In terms of temperatures, I saw a similar picture. The RTX 3080 runs slightly cooler at 63°C, while the RX 6800 XT operates at 65°C, resulting in a minor 3% thermal difference.
- However, when it comes to power consumption, the RTX 3080 continues its power-hungry trend by consuming approximately 32.2% more power at 313W, while the RX 6800 XT remains more power-efficient at just 226W, securing another victory in this category.
- Interestingly, the RTX 3080 outperforms the RX 6800 XT in 1% lows, dropping to only about 121 FPS compared to the RX 6800 XT’s 116 FPS.
Red Dead Redemption 2
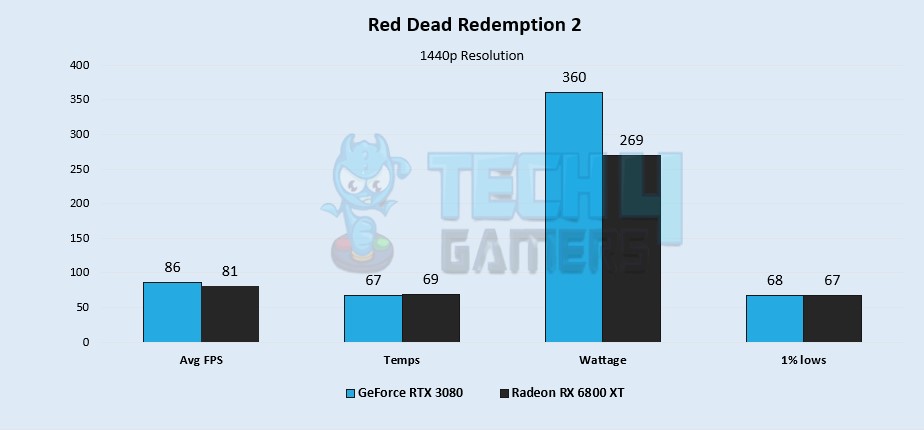
- Over my entire gameplay, the RTX 3080 maintained an average FPS of 86, giving it a lead of approximately 5.9% over the RX 6800 XT, which averages 81 FPS.
- In terms of temperatures, the RTX 3080 once again runs slightly cooler, with a minor difference of about 2.9%, operating at 67°C, while the RX 6800 XT hovers at around 69°C.
- As expected, the RTX 3080 continues its trend of higher power consumption, consuming approximately 28.9% more power than the RX 6800 XT. The RTX 3080 consumes 360W, whereas the RX 6800 XT consumes just 269W.
- Both GPUs perform similarly in 1% lows, with the RTX 3080 and RX 6800 XT dropping to 68 FPS and 67 FPS, respectively.
Similar Comparisons: RX 6700 XT Vs RTX 3080
Watch Dogs: Legion
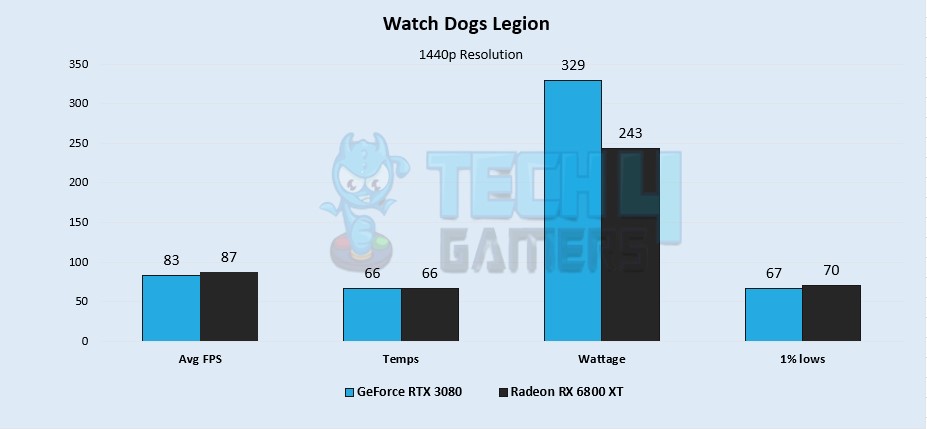
- The RX 6800 XT maintains an average FPS of approximately 87, giving it a lead of approximately 4.7% over the RTX 3080, which averages around 83 FPS.
- Both the RTX 3080 and the RX 6800 XT run at the same temperature, maintaining a consistent 66°C during gameplay.
- As with previous tests, the RTX 3080 continues to consume more power, with a difference of approximately 30%. The RX 6800 XT consumes 243W, while the RTX 3080 consumes 329W.
- In terms of 1% lows, the RX 6800 XT outperforms the RTX 3080 by a slight margin, dropping to 70 FPS compared to the RTX 3080’s 67 FPS.
Assassin’s Creed Valhalla
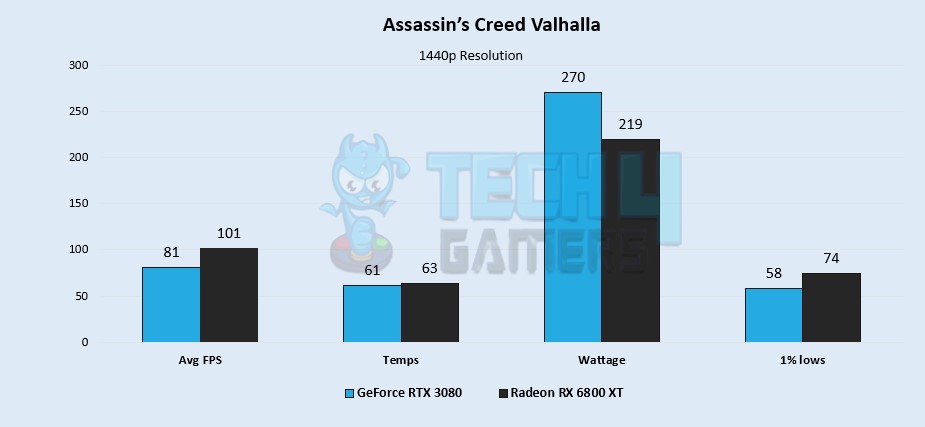
- In this round of testing, the performance difference has decreased to approximately 21.9%. The RTX 3080 achieves an average FPS of 81, while the RX 6800 XT excels at 101 average FPS.
- Despite its slightly lower performance, I saw that the RTX 3080 manages to maintain a slight edge in thermal efficiency. Hovering at 61°C, it is approximately 3.2% cooler than the RX 6800 XT, which runs at 63°C.
- The RTX 3080 continues to consume more power, but the difference has decreased to about 20.8%. The RTX 3080 now consumes 270W, while the RX 6800 XT consumes 219W.
- Examining the 1% lows, the RX 6800 XT maintains a clear advantage, dropping to 74 FPS, while the RTX 3080 falls to 58 FPS.
Also Check: RTX 4070 Ti Vs RTX 3080
Doom Eternal
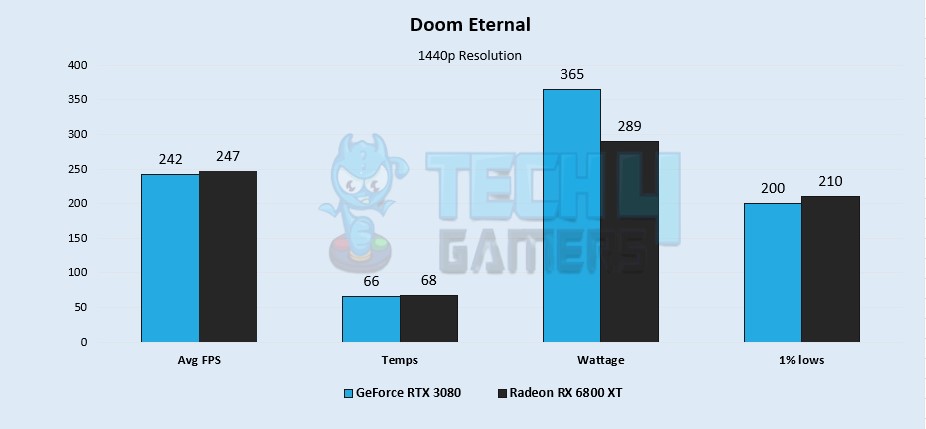
- In this test, the RX 6800 XT maintained a slight lead with an average FPS of 247, while the RTX 3080 achieves 242 average FPS, resulting in just a 2% difference that can be considered negligible.
- The RTX 3080 continues to have a reputation for running a few degrees cooler than its AMD counterpart. This time, the RTX 3080 is at 66°C, while the RX 6800 XT runs at 68°C, with only a minor 2.9% temperature difference.
- Regarding power consumption, the RTX 3080 draws 365W, which is approximately 23.2% more power compared to the RX 6800 XT’s consumption of 289W.
- Examining the 1% lows, the RX 6800 XT dropped to 210 FPS, while the RTX 3080 reached 200 FPS.
Read More: RX 7900 XT Vs RTX 3080
DIRT 5
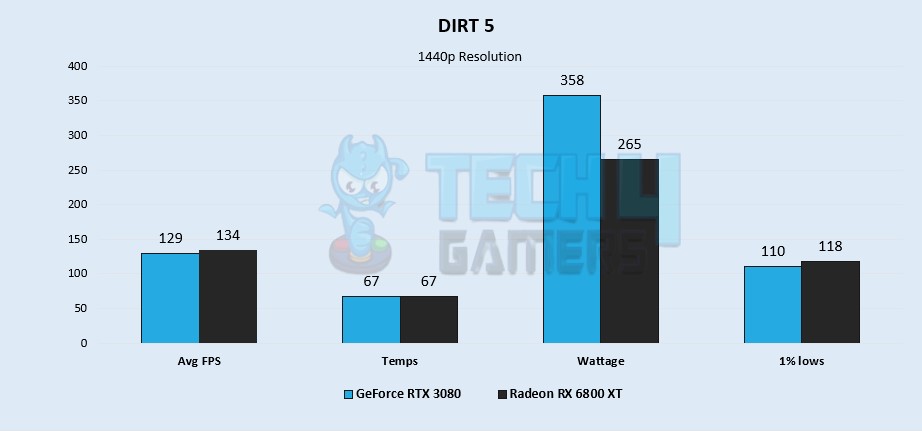
- While testing Dirt 5 at 1440p, my tests showed that the RX 6800 XT has extended its lead to approximately 3.8%, achieving an average FPS of 134, while the RTX 3080 is at 129 average FPS.
- In terms of thermal performance, both the RTX 3080 and the RX 6800 XT maintain a steady 67°C.
- The difference in power consumption has increased once again, with the RTX 3080 consuming 358W, which is approximately 29.8% more than the RX 6800 XT’s power consumption of just 265W.
- The 1% lows show a similar trend, with the RX 6800 XT dropping to 118 FPS and the RTX 3080 to 110 FPS.
Control
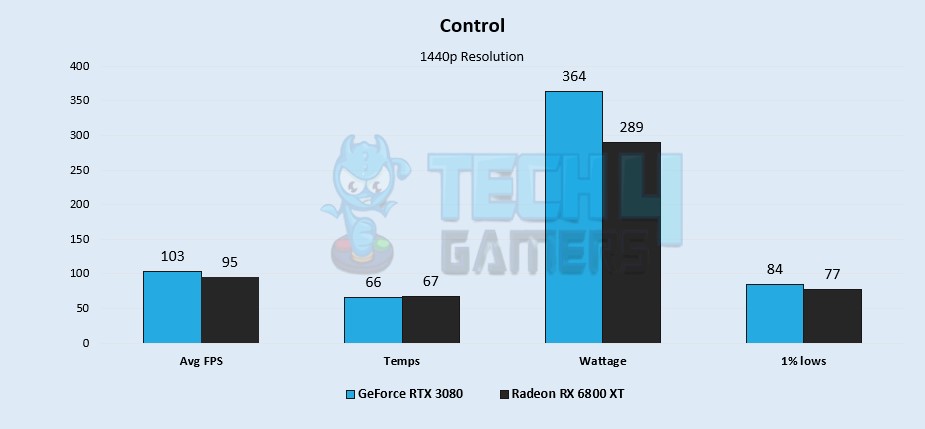
- This time, I observed a different scenario: the RTX 3080 maintained an average of 103 FPS throughout the gameplay, which is approximately 8% better than the RX 6800 XT’s average of 95 FPS.
- The RTX 3080 maintains a slightly cooler temperature at 66°C, while the RX 6800 XT operates at 67°C.
- Power consumption figures remain consistent with previous results, as the RTX 3080 consumes approximately 22.9% more power at 364W, whereas the RX 6800 XT consumes 289W.
- Similarly, when examining the 1% lows, the RTX 3080’s frame rates dropped to 84, while the RX 6800 XT’s frame rates dropped to 77.
Also Check: RTX 4080 Vs RTX 3080
Horizon Zero Dawn
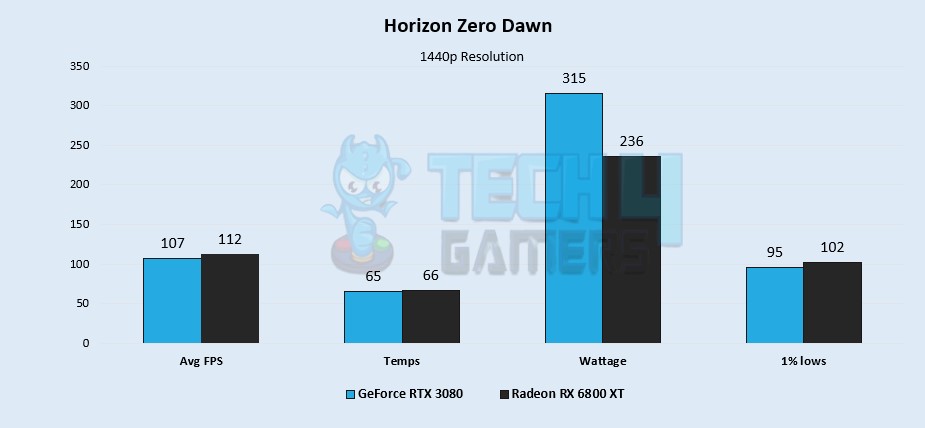
- Once again, the RX 6800 XT takes the lead, this time with a difference of approximately 4.5%. The RX 6800 XT averages 112 FPS, while the RTX 3080 averages 107 FPS.
- Examining temperature data, the RTX 3080 maintains its pattern of running slightly cooler at 65°C, while the RX 6800 XT operates at 66°C.
- The RTX 3080 continues to exhibit high power consumption in this game as well, consuming 315W, compared to the RX 6800 XT’s 236W, making Team Red approximately 28.6% more power-efficient.
- The 1% lows remain consistent, with the RTX 3080 dropping to 95 FPS and the RX 6800 XT to 102 FPS.
Related Article: Radeon RX 6800 Vs RX 6800 XT
Overall Gaming Performance
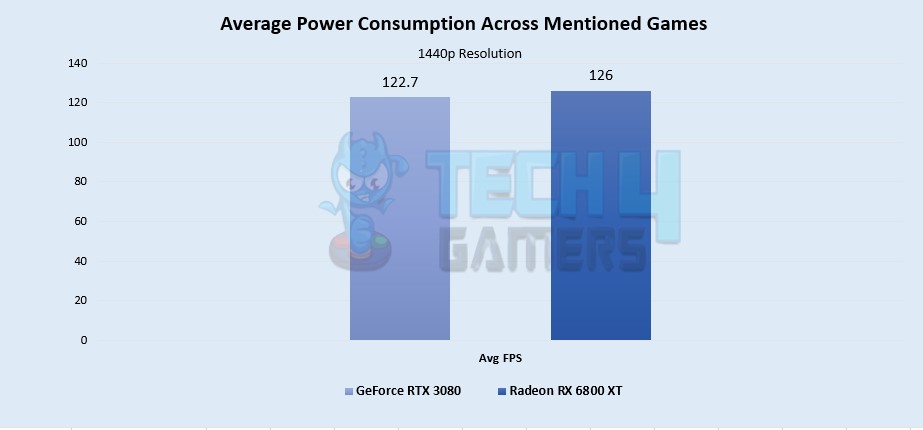
- On average, at 1440p resolution, I observed the RTX 3080 to deliver 122.7 FPS across 10 games, while the RX 6800 XT outperformed it with a slight lead of about 2.65% at 126 FPS.
- It’s worth noting that while the AMD Radeon RX 6800 XT is the superior GPU in terms of gaming performance, the RTX 3080 still performed admirably, consistently delivering good FPS in all the reviewed games.
- In specific titles like Cyberpunk 2077, Control, and Red Dead Redemption 2, the RTX 3080 even held an advantage, offering up to 11.5% higher FPS compared to the RX 6800 XT.
- Overall, the competition between these GPUs is close, with the RX 6800 XT edging out the RTX 3080 by a narrow margin in terms of FPS performance at 1440p resolution.
Also Read: Radeon RX 6800 Vs RX 6800 XT
Average Power Consumption
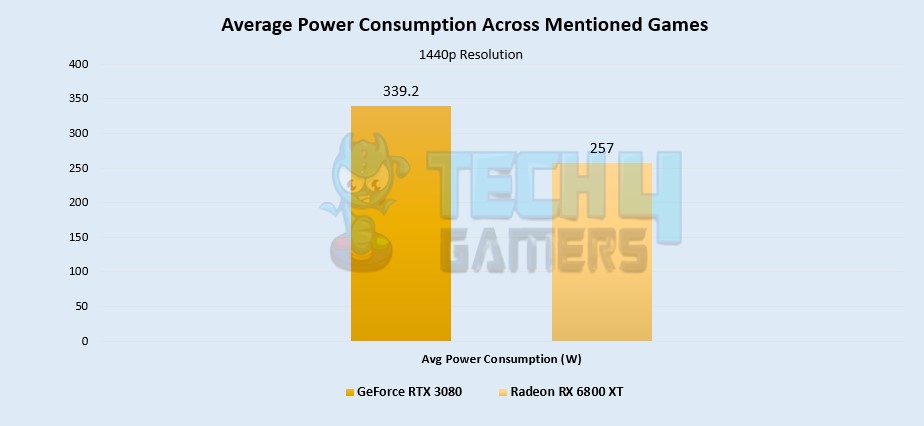
- When testing out power consumption at 1440p, my findings revealed that the RTX 3080 proved to be significantly more power-hungry, consuming an average of 339.2W, whereas the RX 6800 XT exhibited greater power efficiency, with an average consumption of just 257W, marking a substantial 27.5% difference in favor of the RX 6800 XT.
- Impressively, the AMD Radeon RX 6800 XT consistently operated below its rated TDP at 1440p, underscoring its remarkable power efficiency in contrast to the RTX 3080.
Average Thermal Statistics
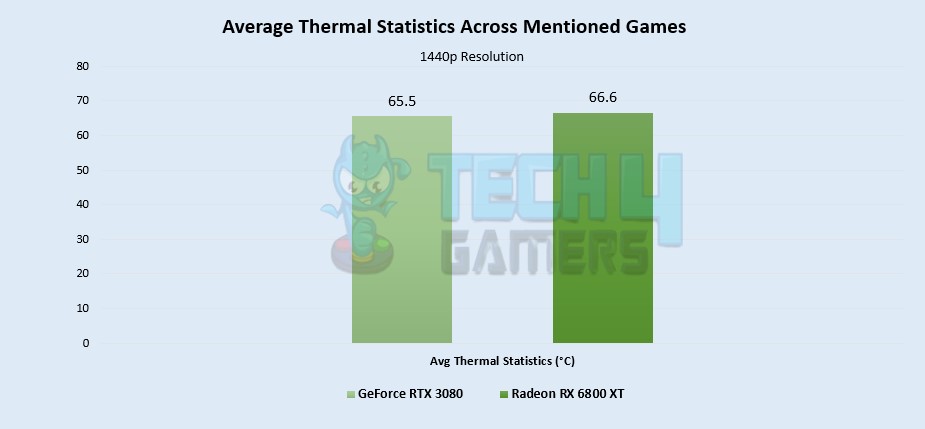
- Despite its high power consumption, the RTX 3080 managed to maintain slightly cooler temperatures. At 1440p, the NVIDIA card averaged about 65.5°C, while the RX 6800 XT reached around 66.6°C.
- Both GPUs demonstrated strong thermal efficiency performance, with only a minor 1.6% temperature difference between them, ensuring there are no thermal-related concerns for either card at this resolution.
Related Article: RX 7900 XT Vs RX 6800 XT
Pricing And Availability
- Based on my experience, the AMD RX 6800 XT stands out as the better value proposition, with prices starting at just $500 on Newegg. In contrast, the RTX 3080 falls on the higher end of the price spectrum, currently available for as low as $800.
- What makes the RX 6800 XT even more appealing is that it not only comes at a lower price point but also offers slightly better performance and significantly improved power efficiency compared to the RTX 3080.
RTX 3080 Vs RX 6800 XT: Which One Would I Recommend?
- When it comes to gaming performance at 1440p resolution, the RX 6800 XT edges ahead of the RTX 3080, offering an average of 126 FPS compared to the RTX 3080’s 122.7 FPS across 10 games.
- In terms of power consumption, the RTX 3080 stands out as notably more power-hungry, consuming an average of 339.2W, whereas the RX 6800 XT showcases superior power efficiency, with an average consumption of just 257W, marking a substantial 27.5% difference in favor of the RX 6800 XT.
- Additionally, both GPUs perform admirably in terms of thermal efficiency, with the RTX 3080 maintaining slightly cooler temperatures at around 65.5°C on average at 1440p, while the RX 6800 XT reaches approximately 66.6°C.
Taking all these factors into consideration, I would recommend the AMD RX 6800 XT as the better value proposition, especially with prices starting at just $500 on Newegg. In contrast, the RTX 3080 falls on the higher end of the price spectrum, currently available for as low as $800.
Similar Comparison: RX 6950 XT Vs RX 6800 XT
Pros And Cons
| GPU | Pros | Cons |
|---|---|---|
| GeForce RTX 3080 |
|
|
| Radeon RX 6800 XT |
|
|
Thank you! Please share your positive feedback. 🔋
How could we improve this post? Please Help us. 😔
[Comparisons Expert]
Abdemanaf is a skilled creative writer who has been honing his craft since 2011. While initially working in different fields, he found a passion for technology and has been exploring the tech world since early 2015. Over the years, he has developed an in-depth knowledge of the latest tech trends and product offerings by various companies.
Abdemanaf’s writing reflects his analytical mindset and ability to think critically. He has a knack for breaking down complex technical information into easily digestible pieces, making his articles engaging and accessible to readers from all backgrounds. In February 2022, he joined Tech4Gamers as a blog and product comparison writer, where he has been able to hone his skills further.
As a writer, Abdemanaf is dedicated to staying up-to-date with the latest technological advancements and trends, enabling him to provide readers with the most relevant and accurate information. He is always eager to learn more and is constantly seeking new challenges to improve his skills.
Get In Touch: manaf@tech4gamers.com


Feedback By: