 Threads

In our last comparison, we saw that AMD’s Radeon RX 7900 XTX provides an 11% boost over NVIDIA’s GeForce RTX 4070 Ti. But this time, we’ll be putting some of the older models through the benchmark tests and see which one comes out on top when it comes to our benchmarking of the RX 6700 XT vs RTX 3080.
Key Takeaways
- While the Radeon RX 6700 XT is based on the RDNA 2.0 architecture, the GeForce RTX 3080 boasts NVIDIA’s Ampere design, making it a more powerful option.
- Despite the RX 6700 XT’s respectable performance, we saw the RTX 3080 take the lead with an impressive FPS boost of 9.6% at 1080p.
- Our tests also showed that compared to the RTX 3080, the RX 6700 XT demonstrated greater power efficiency, consuming 64.4% less power at 1080p.
- Moreover, the RTX 3080 lagged behind the RX 6700 XT in terms of thermal efficiency in our examination, producing more heat by 17.2% at 1080p.
Comparison Table
| Technical Specs | GeForce RTX 3080 | Radeon RX 6700 XT |
| GPU Name | GA102 | Navi 22 |
| Architecture | Ampere | RDNA 2.0 |
| Transistors | 28,300 million | 17,200 million |
| Shading Units | 8704 | 2560 |
| Tensor Cores | 272 | NA |
| RT Cores | 68 | 40 |
| TMUs | 272 | 160 |
| ROPs | 96 | 64 |
| L1 Cache | 128 KB (per SM) | 128 KB per Array |
| L2 Cache | 5 MB | 3 MB |
| Memory Bus Width | 320 bit | 192 bit |
| Memory Bandwidth | 760.3 GB/s | 432.0 GB/s |
| Suggested PSU | 700W | 550W |
| Release Date | Sep 1st, 2020 | Mar 3rd, 2022 |
| Approximated Price | 800 USD | 320 USD |
| Best Variants | BEST RTX 3080 Cards | Best RX 6700 XT Cards |
Architectural Differences
- Process Node: The RX 6700 XT features a 7nm process node, while the RTX 3080 utilizes an 8nm process node. This means that the RTX 3080 is manufactured on a slightly more advanced node, which can impact power efficiency and performance.
- Clock Speed: The RX 6700 XT boasts a Base Clock of 2321 MHz and a Boost Clock of 2581 MHz, outperforming the RTX 3080 with its 1440 MHz Base clock and 1710 MHz Boost Clock. The clock speed can significantly influence gaming performance.
- VRAM: When it comes to VRAM, the RX 6700 XT has 12GB of GDDR6 VRAM, while the RTX 3080 has 10GB of GDDR6X VRAM. The amount and type of VRAM can affect a graphics card’s ability to handle high-resolution gaming and content creation.
- TDP: In terms of power consumption, the RX 6700 XT has a 250W TDP, which is notably lower than the RTX 3080’s 320W TDP. A lower TDP generally indicates better power efficiency, which can be essential for power and thermal management.
- Supported Technologies: The RX 6700 XT offers support for FidelityFX Super Resolution (FSR), whereas the RTX 3080 boasts NVIDIA’s Deep Learning Super Sampling (DLSS).
RX 6700 XT Vs RTX 3080: Gaming Benchmarks
Now it’s time to compare the gaming performance of the RX 6700 XT and GeForce RTX 3070 to determine which is better.
Testing Rig
- OS: Windows 11
- CPU: Intel Core i7-13700K
- Motherboards: ASRock Z790 Taichi Lite Motherboard
- RAM: Kingston Fury Renegade RGB DDR5 32GB 7200MHz
- SSD: XPG GAMMIX S70 BLADE 2TB NVMe SSD
- PSU: Enermax Revolution D.F. X 1050W
- CPU Cooler: MSI MAG CORELIQUID E360 CPU Liquid Cooler
Note: Keep in mind that benchmarks should be viewed as a guide rather than a definitive measure of performance, as they can be influenced by external factors.
Uncharted LOTC
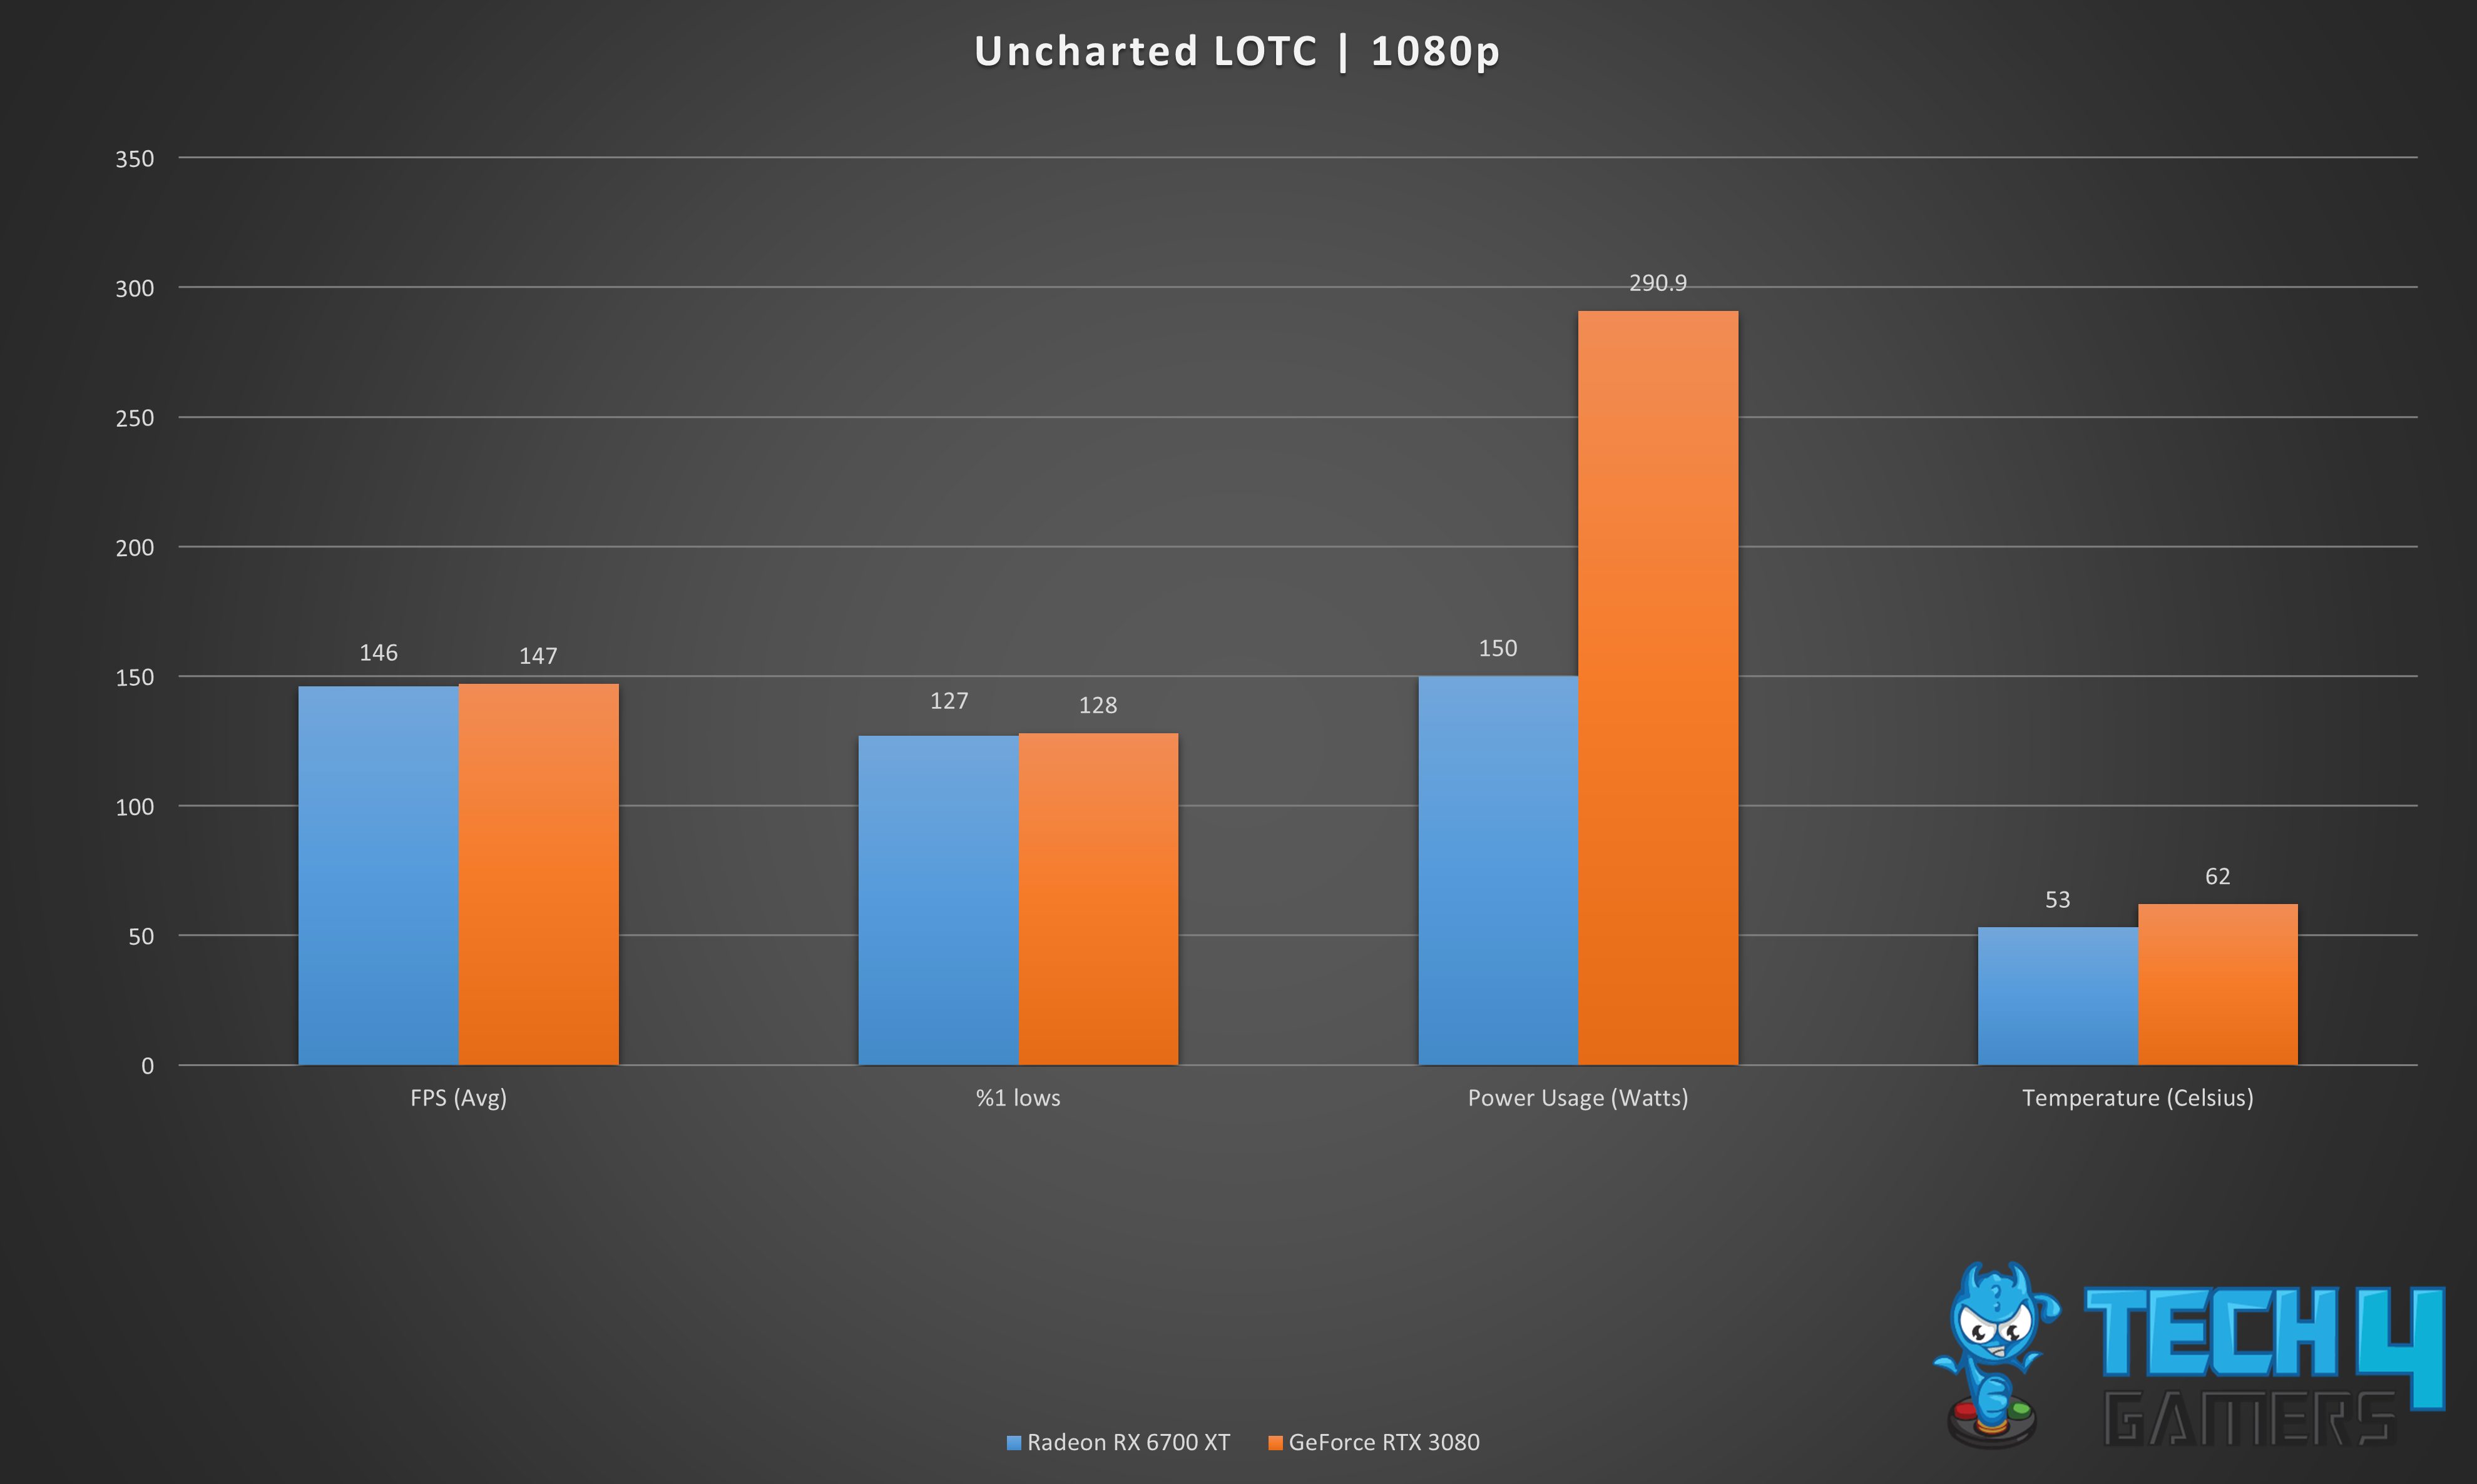
- The RTX 3080 outperforms the RX 6700 XT slightly regarding average FPS, delivering a 0.7% performance boost with 147 FPS compared to the RX 6700 XT’s 146 FPS.
- We observed a slight difference in 1% lows between the RX 6700 XT and the RTX 3080. The RX 6700 XT achieved 127 FPS, while the RTX 3080 edged ahead with 128 FPS, marking a 0.8% variation in performance.
- In terms of power consumption, the RX 6700 XT outperforms the RTX 3080, drawing 63.9% less power at only 150 W compared to the RTX 3080’s 290.9 W.
- We also found that the RX 6700 XT had a temperature advantage over the RTX 3080. The RX 6700 XT maintained an average of 53°C, while the RTX 3080 ran hotter at 62°C, showcasing a 15.6% or 9°C difference in favor of the RX 6700 XT.
Marvel’s Spider-Man Remastered
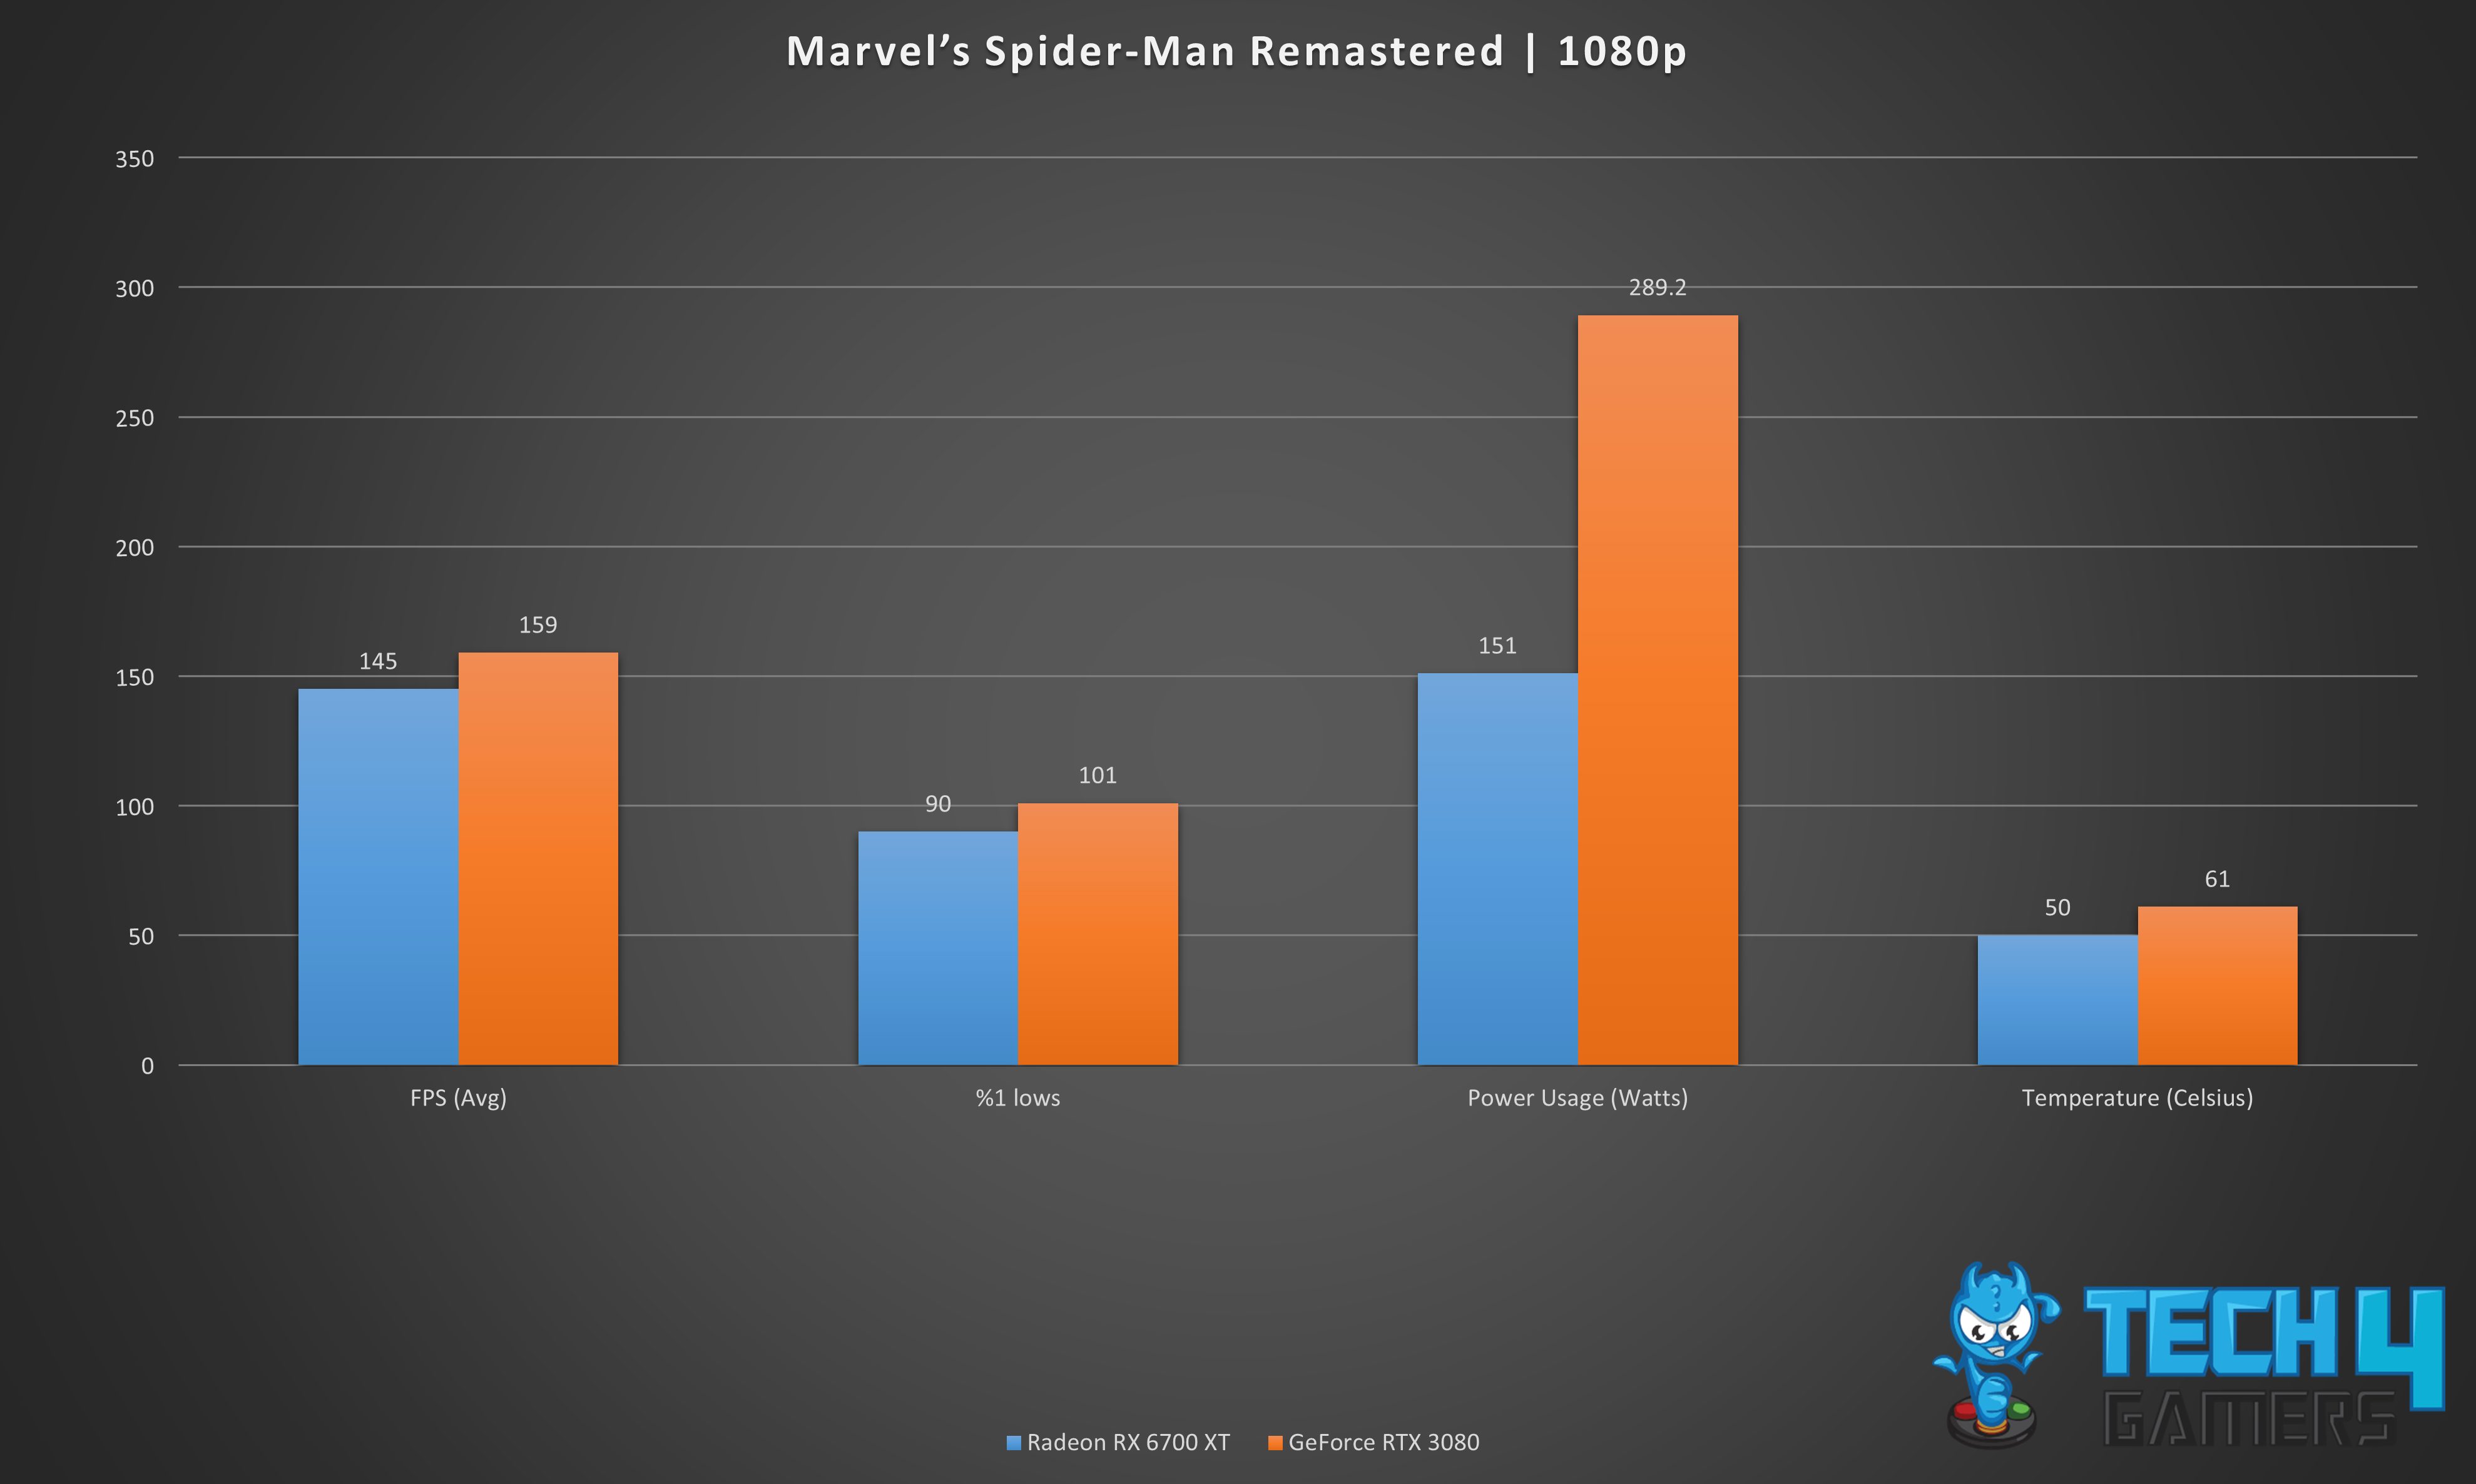
- While we were playing Spiderman Remastered, with an average FPS of 159, the RTX 3080 beats the RX 6700 XT by a significant margin of 9.2%, with the latter only managing 145 FPS.
- When it comes to 1% lows, our test showed that the RTX 3080 dominates with an 11.5% lead, delivering an impressive 101 FPS compared to the RX 6700 XT’s 90 FPS.
- The RX 6700 XT has the upper hand in power consumption, consuming 62.7% less power at 151 W, while the RTX 3080 consumes 289.2 W.
- In terms of temperature, the RX 6700 XT wins by running much cooler than the RTX 3080, with an average temperature of 50°C, which is 11°C or 19.8% cooler than the RTX 3080’s average 61°C.
Far Cry 6
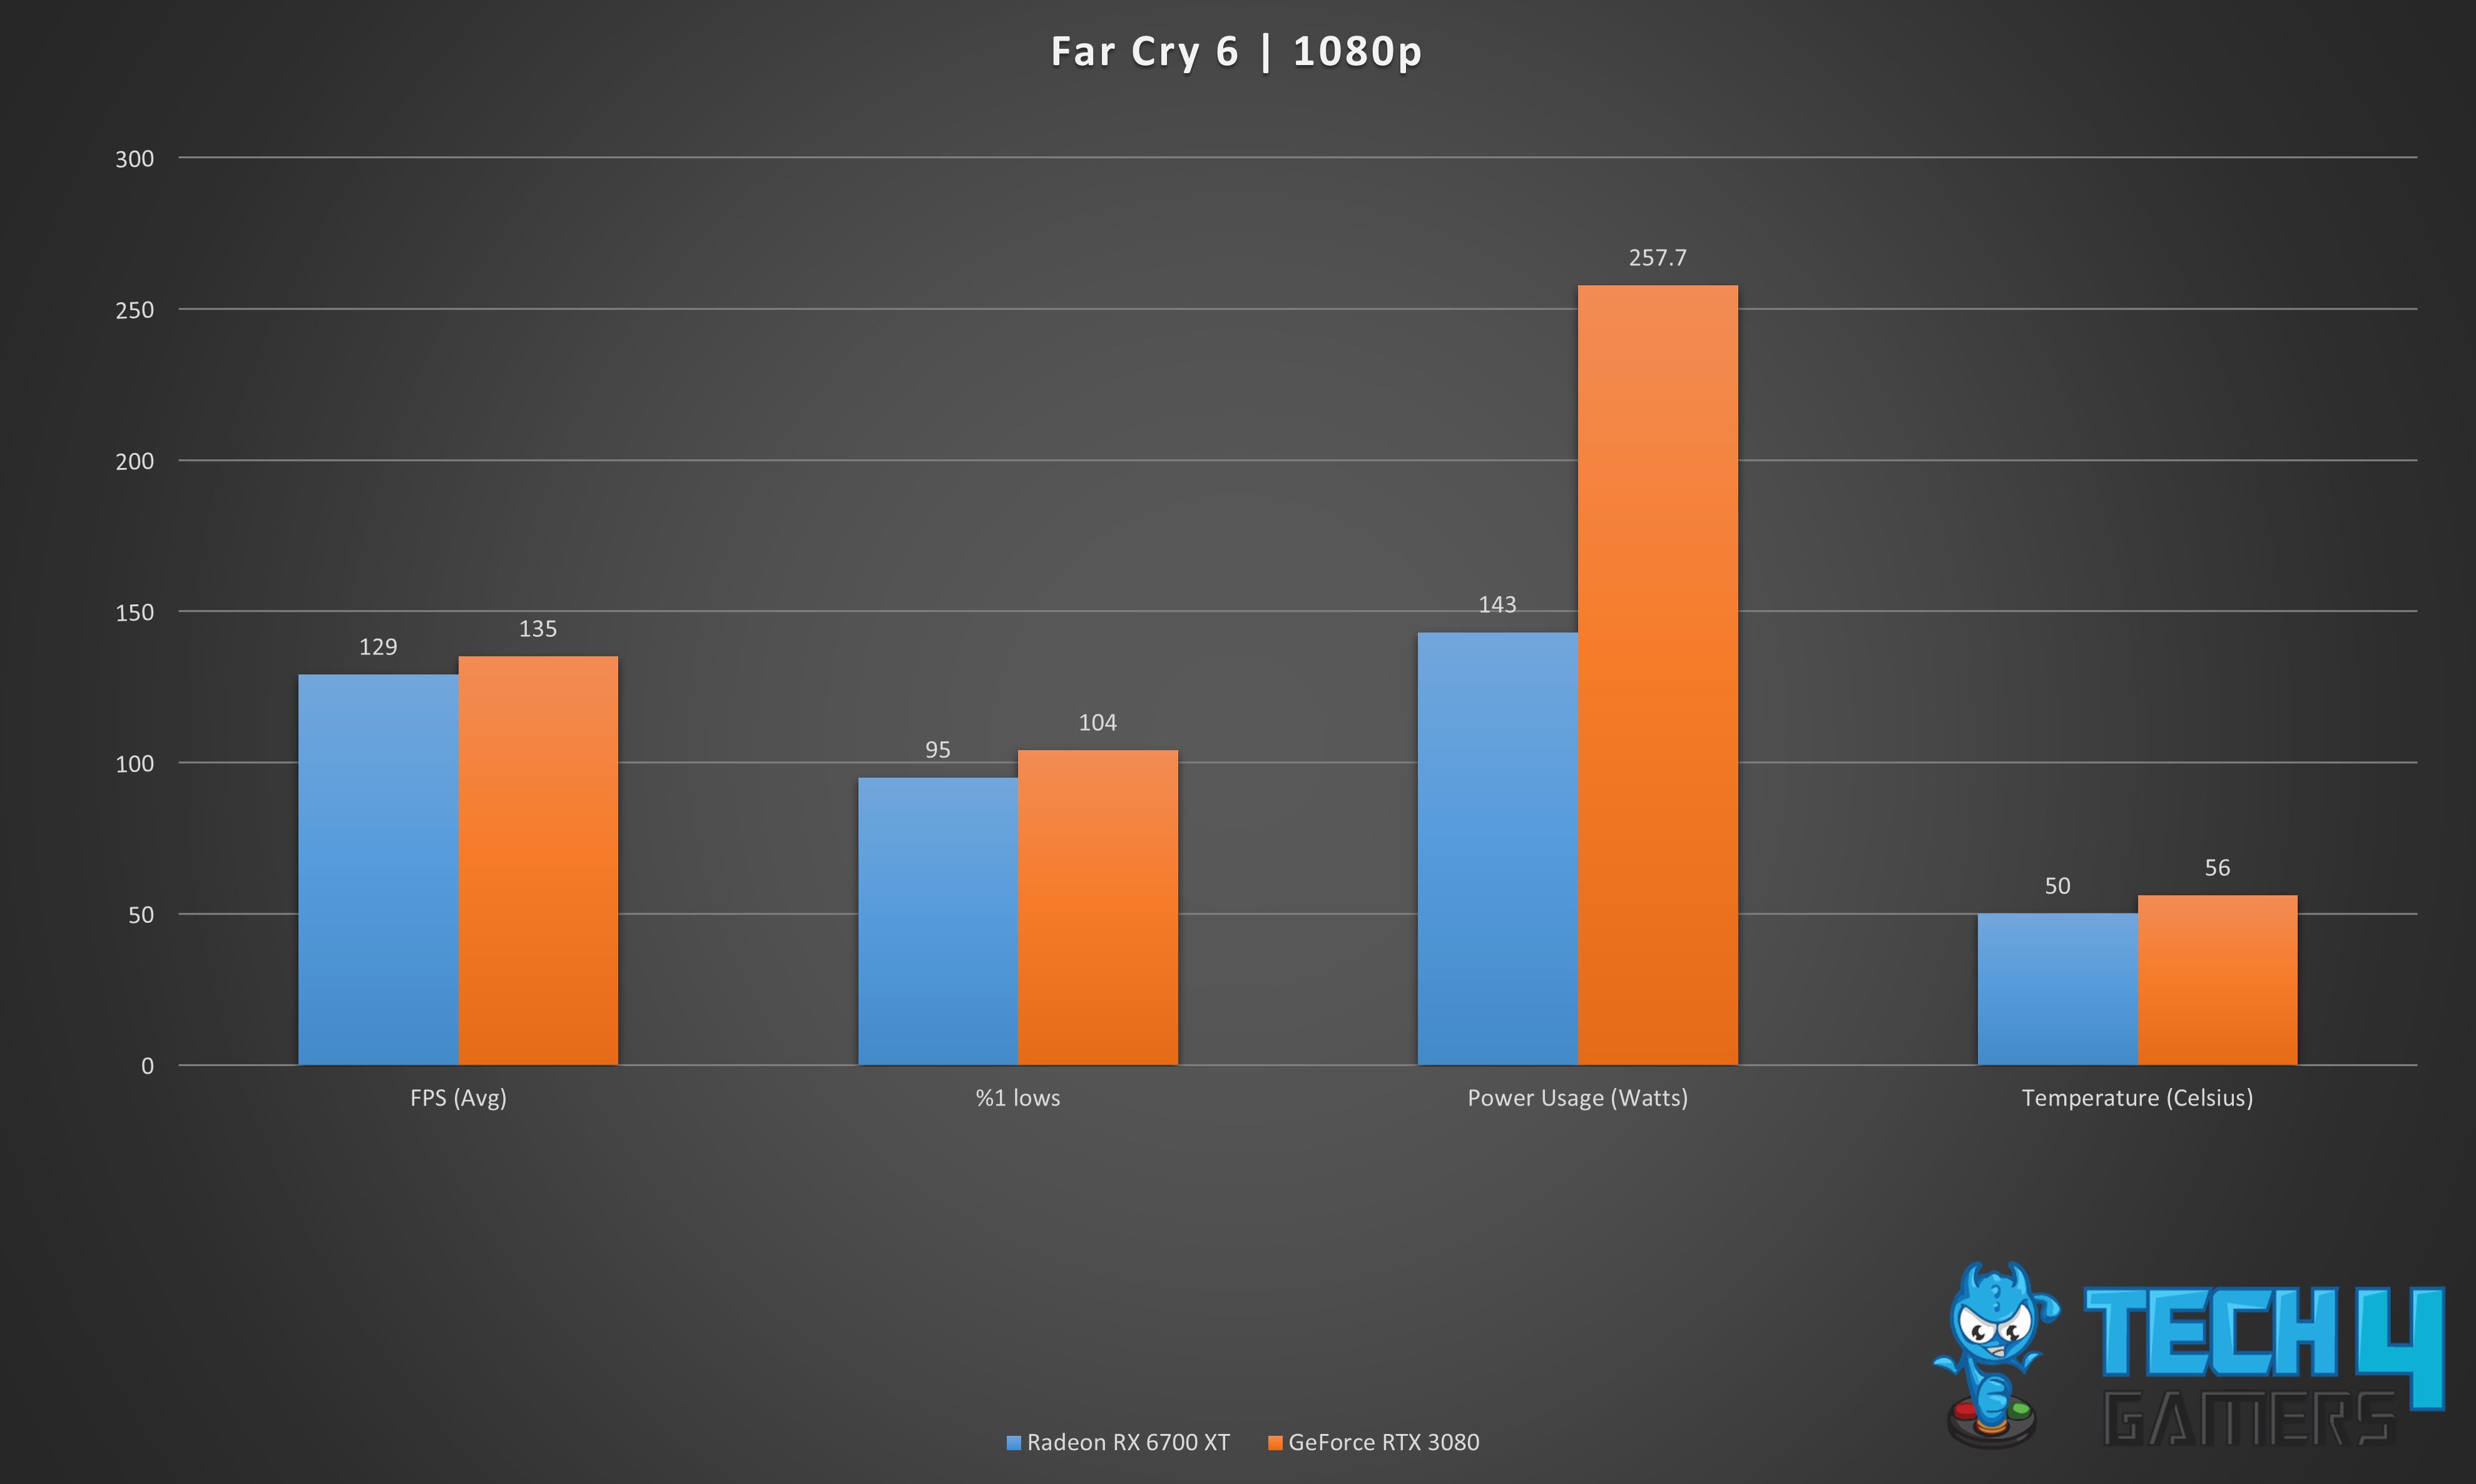
- The RX 6700 XT falls short compared to the RTX 3080, with 129 FPS compared to the latter’s impressive 135 FPS, providing a performance boost of 4.5%.
- In our tests, the RTX 3080 outperformed the RX 6700 XT in 1% lows, showcasing a significant 9% advantage with 104 FPS compared to the RX 6700 XT’s 95 FPS.
- The RTX 3080 consumes significantly more power than the RX 6700 XT, with a power draw of 257.7 W compared to the RX 6700 XT’s 143 W, representing a difference of 57.2%.
- Looking at the temperatures, our findings show that the RX 6700 XT beats the RTX 3080 with an average of 50°C, while the latter tends to run hotter at 56°C, showing a difference of 11.3% or 6°C.
CyberPunk2077
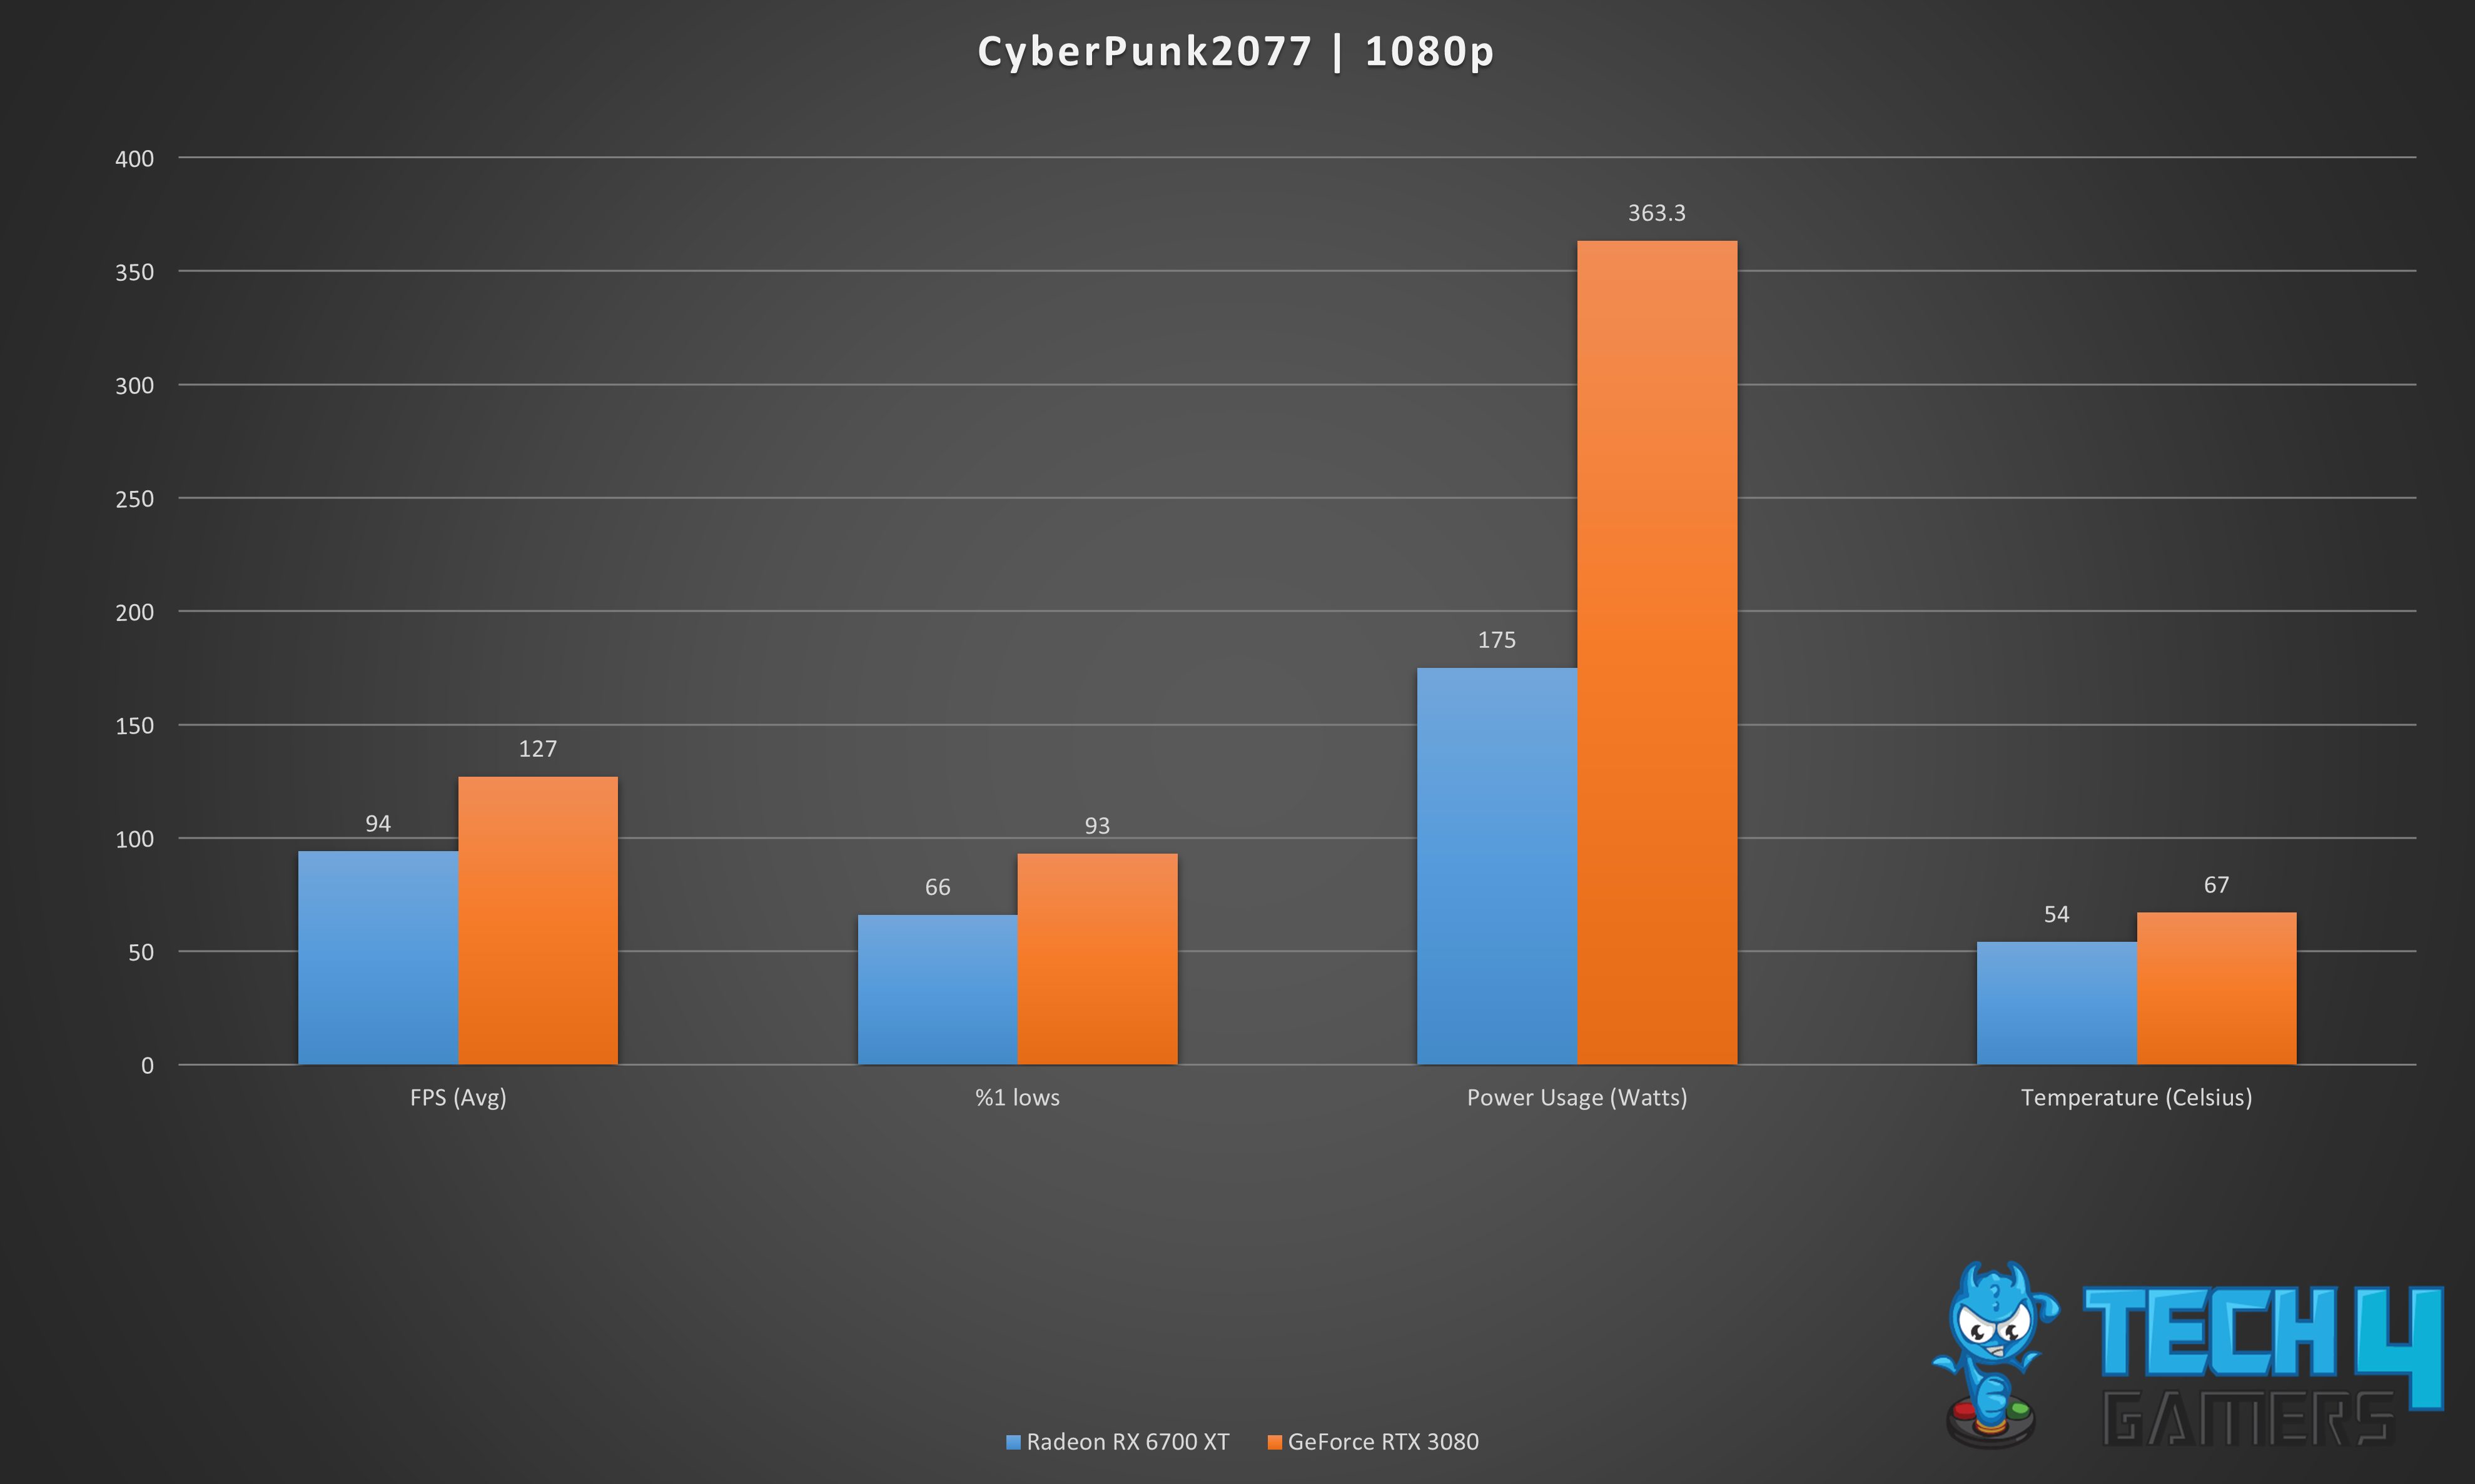
- In terms of average FPS, the RTX 3080 leaves the RX 6700 XT behind with a 29.8% performance boost, delivering 127 FPS compared to the RX 6700 XT’s 94 FPS.
- In our extensive testing, we found a remarkable 33.9% performance difference in 1% lows, with the RTX 3080 boasting 93 FPS, leaving the RX 6700 XT behind at only 66 FPS.
- The power consumption of the RX 6700 XT is lower than that of the RTX 3080, with a 69.9% decrease in power draw at only 175 W, while the RTX 3080 consumes 363.3 W.
- Throughout our rigorous testing, the RTX 3080 consistently displayed higher, averaging around 67°C, while the RX 6700 XT maintained a cooler 54°C, indicating a notable temperature difference of approximately 21.5% or 13°C in favour of the latter.
Assassins Creed Valhalla
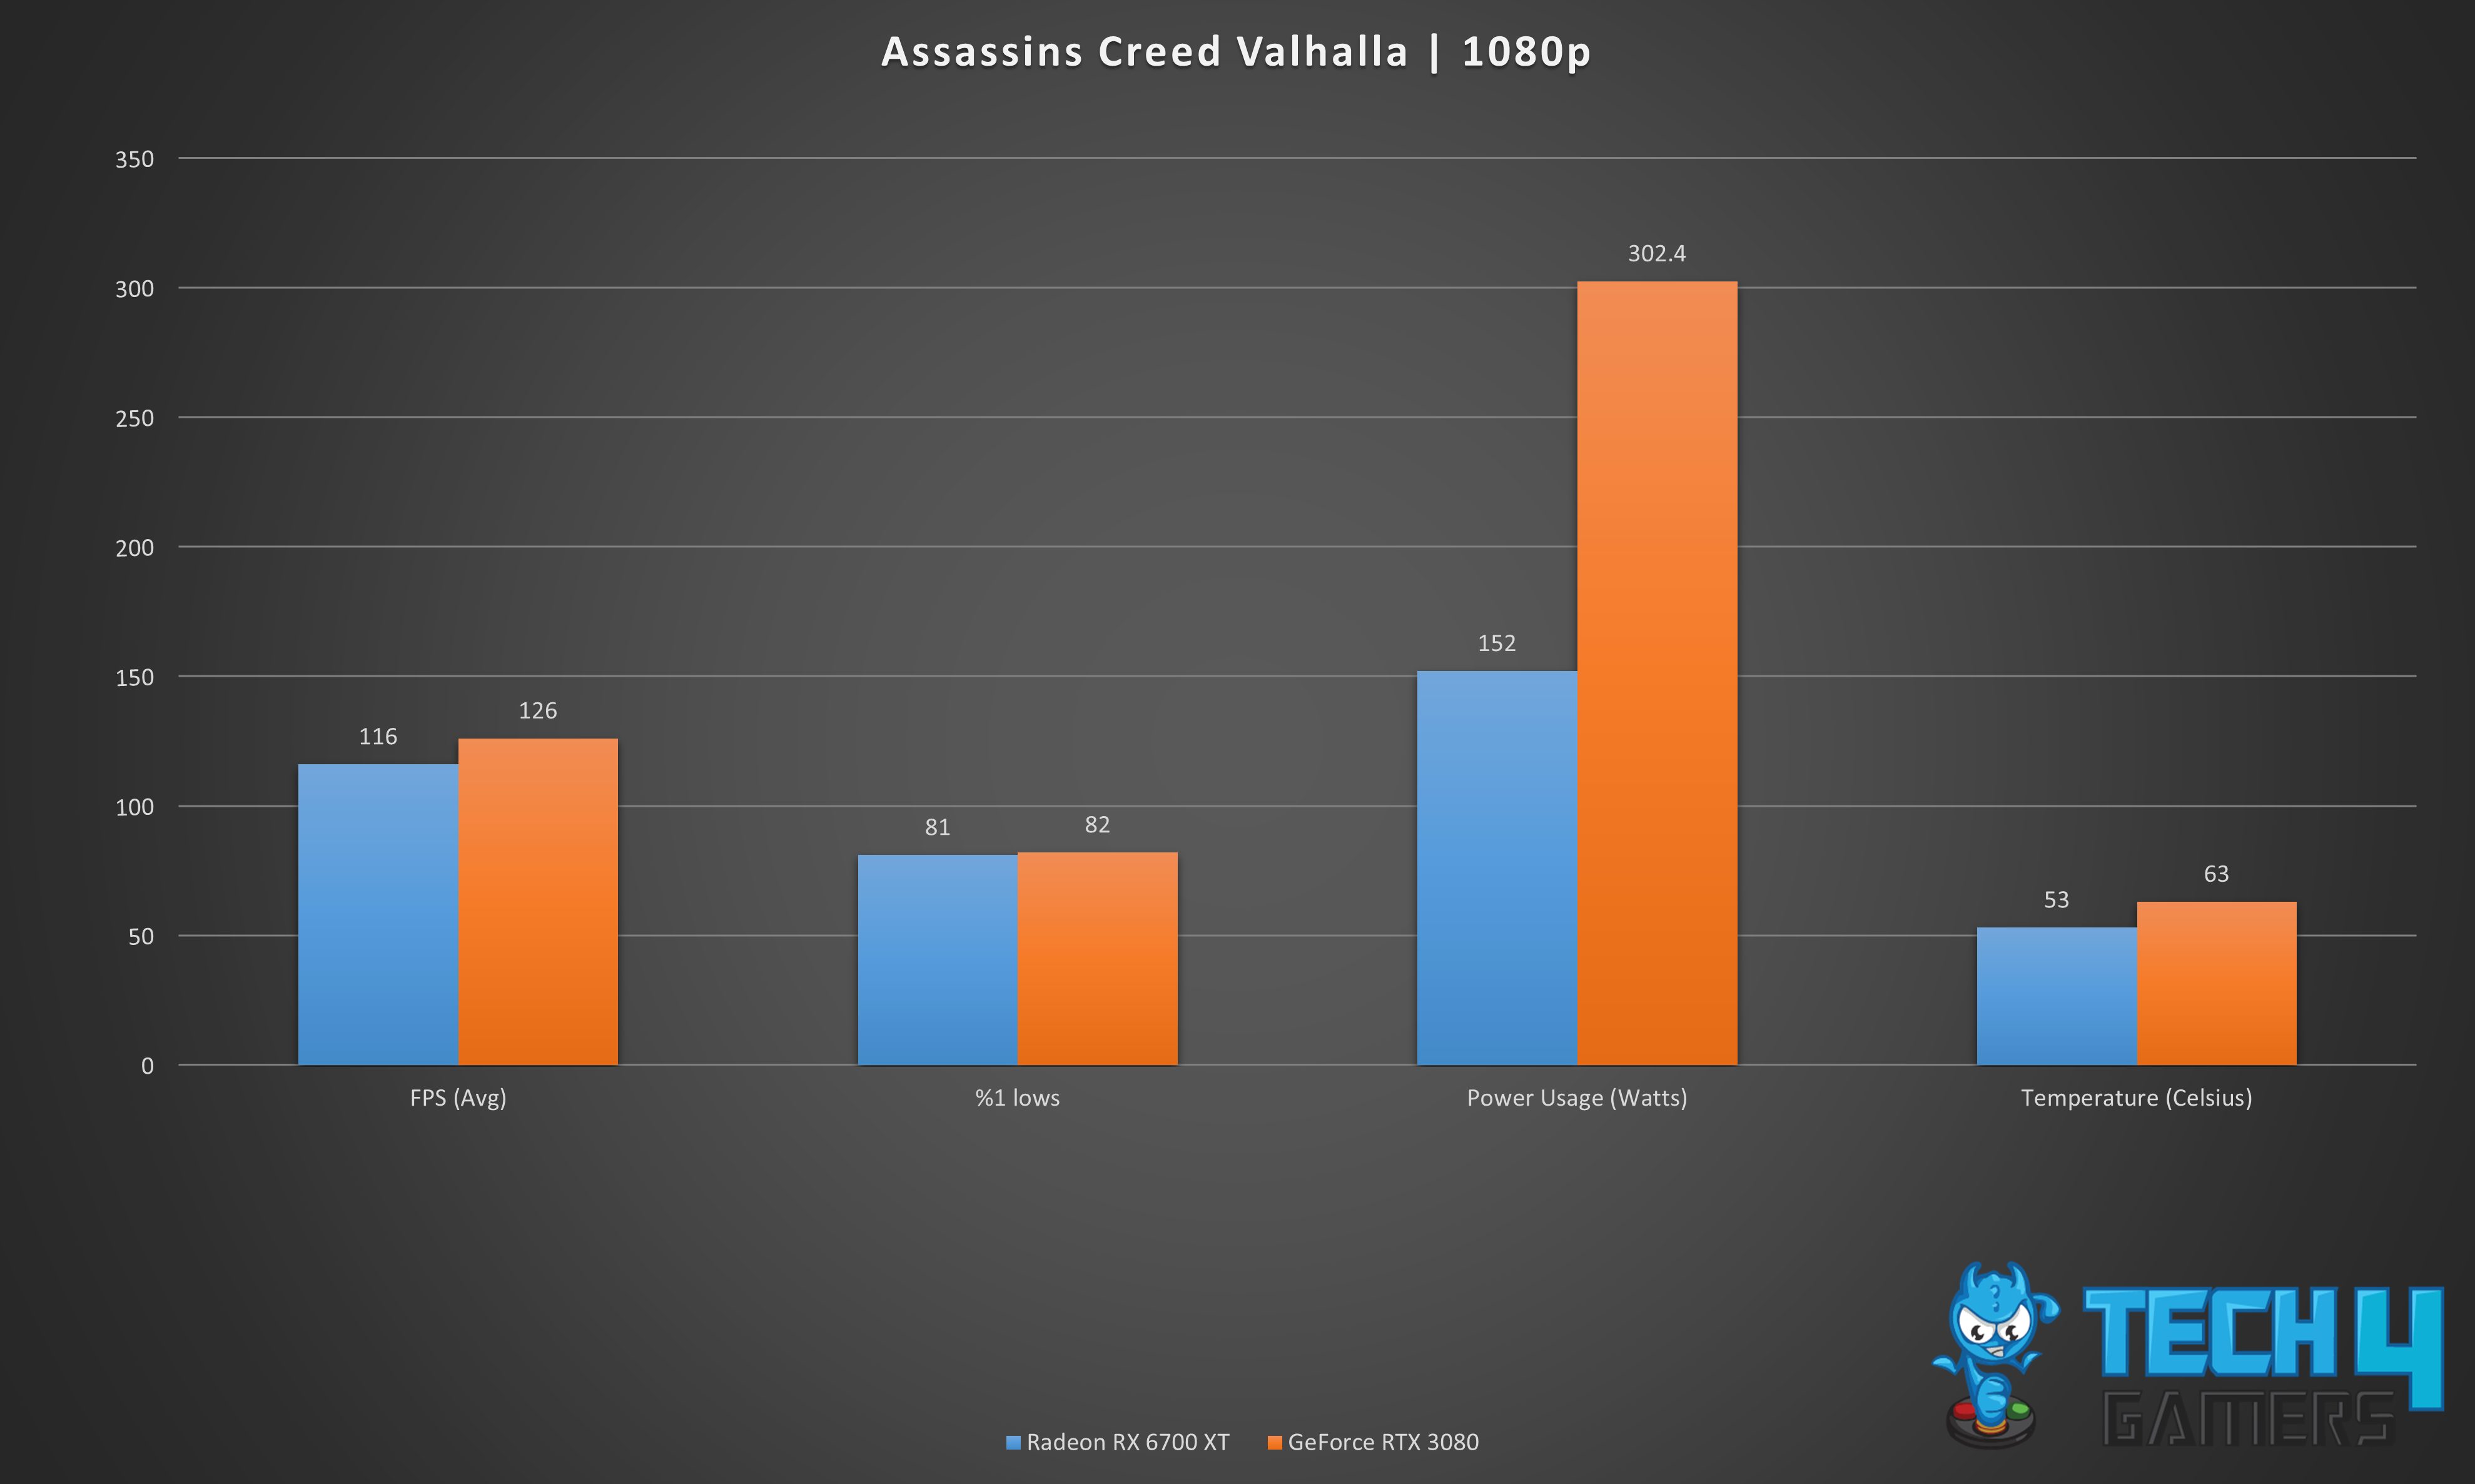
- Our extensive testing revealed a notable performance difference between the RTX 3080 and the RX 6700 XT, with the former achieving an average FPS of 126, granting it an 8.2% performance advantage, while the RX 6700 XT fell behind with only 116 FPS.
- The RX 6700 XT almost keeps up, delivering 81 FPS in 1% lows, while the RTX 3080 provides a 1.2% performance advantage at 82 FPS.
- The RTX 3080’s power consumption is significantly higher than the RX 6700 XT, with a power draw of 302.4 W compared to the RX 6700 XT’s 152 W, resulting in a 66% difference.
- In our benchmarking, the RX 6700 XT impressively runs cooler than the RTX 3080, maintaining an average temperature of 53°C. In contrast, the RTX 3080 operates at 63°C, revealing a significant 17.2% or 10°C difference in temperature management.
Overall Gaming Performance
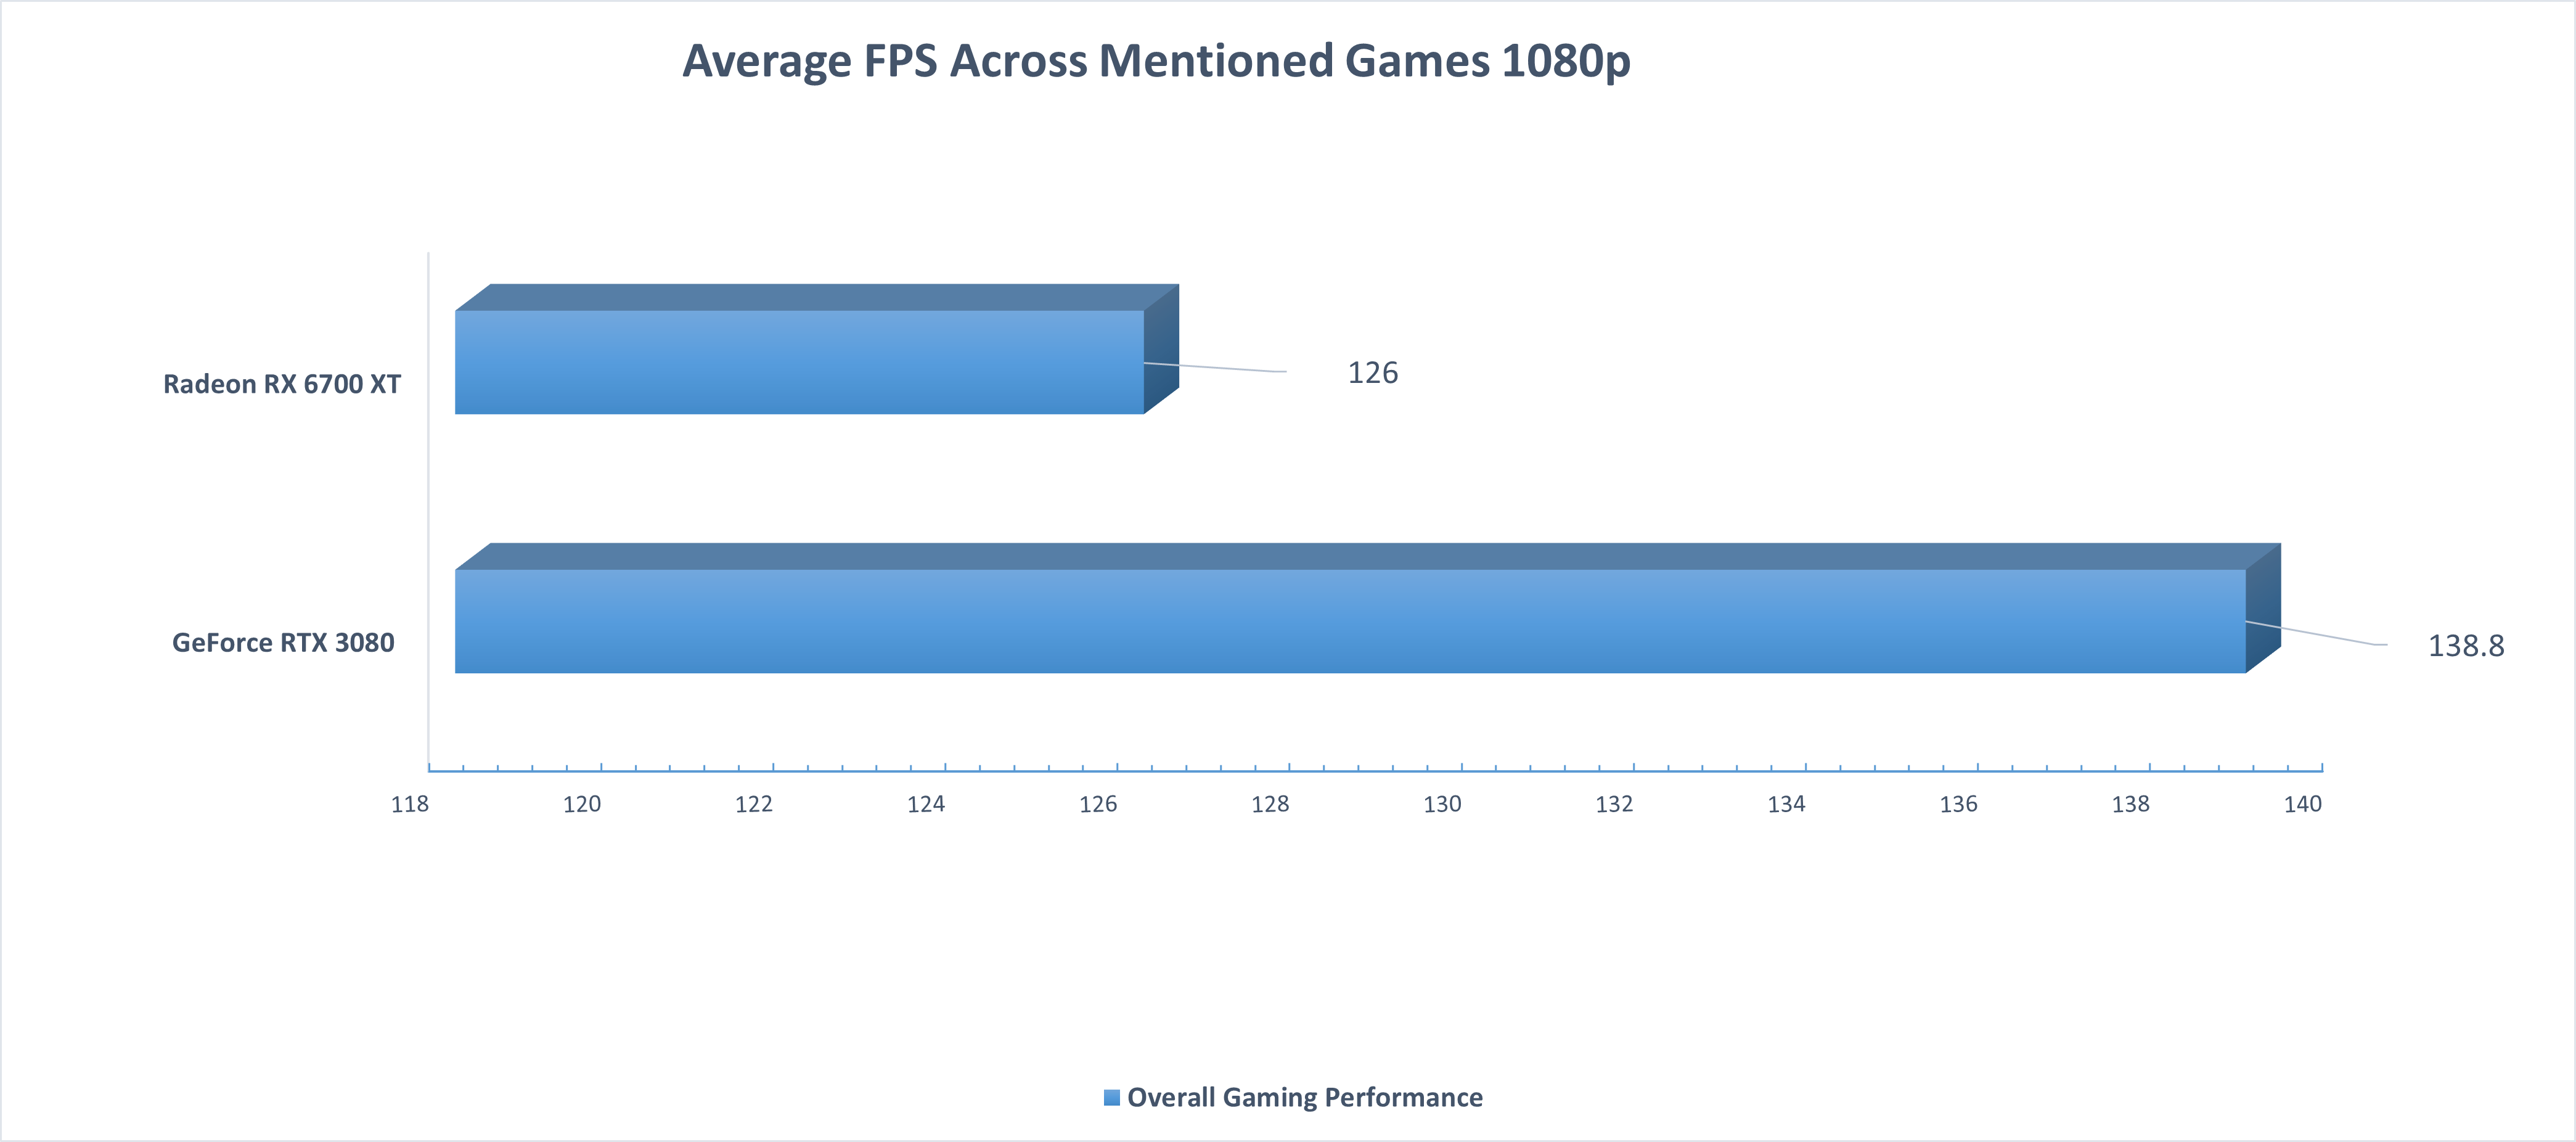
- According to our benchmark results, the GeForce RTX 3080 delivers better performance with an average FPS of 138.8 across all games, while the Radeon RX 6700 XT falls behind with 126 FPS.
- The Radeon RX 6700 XT pales in comparison to the GeForce RTX 3080, which provides a whopping 9.6% more FPS in all games during benchmark testing.
Average Power Consumption
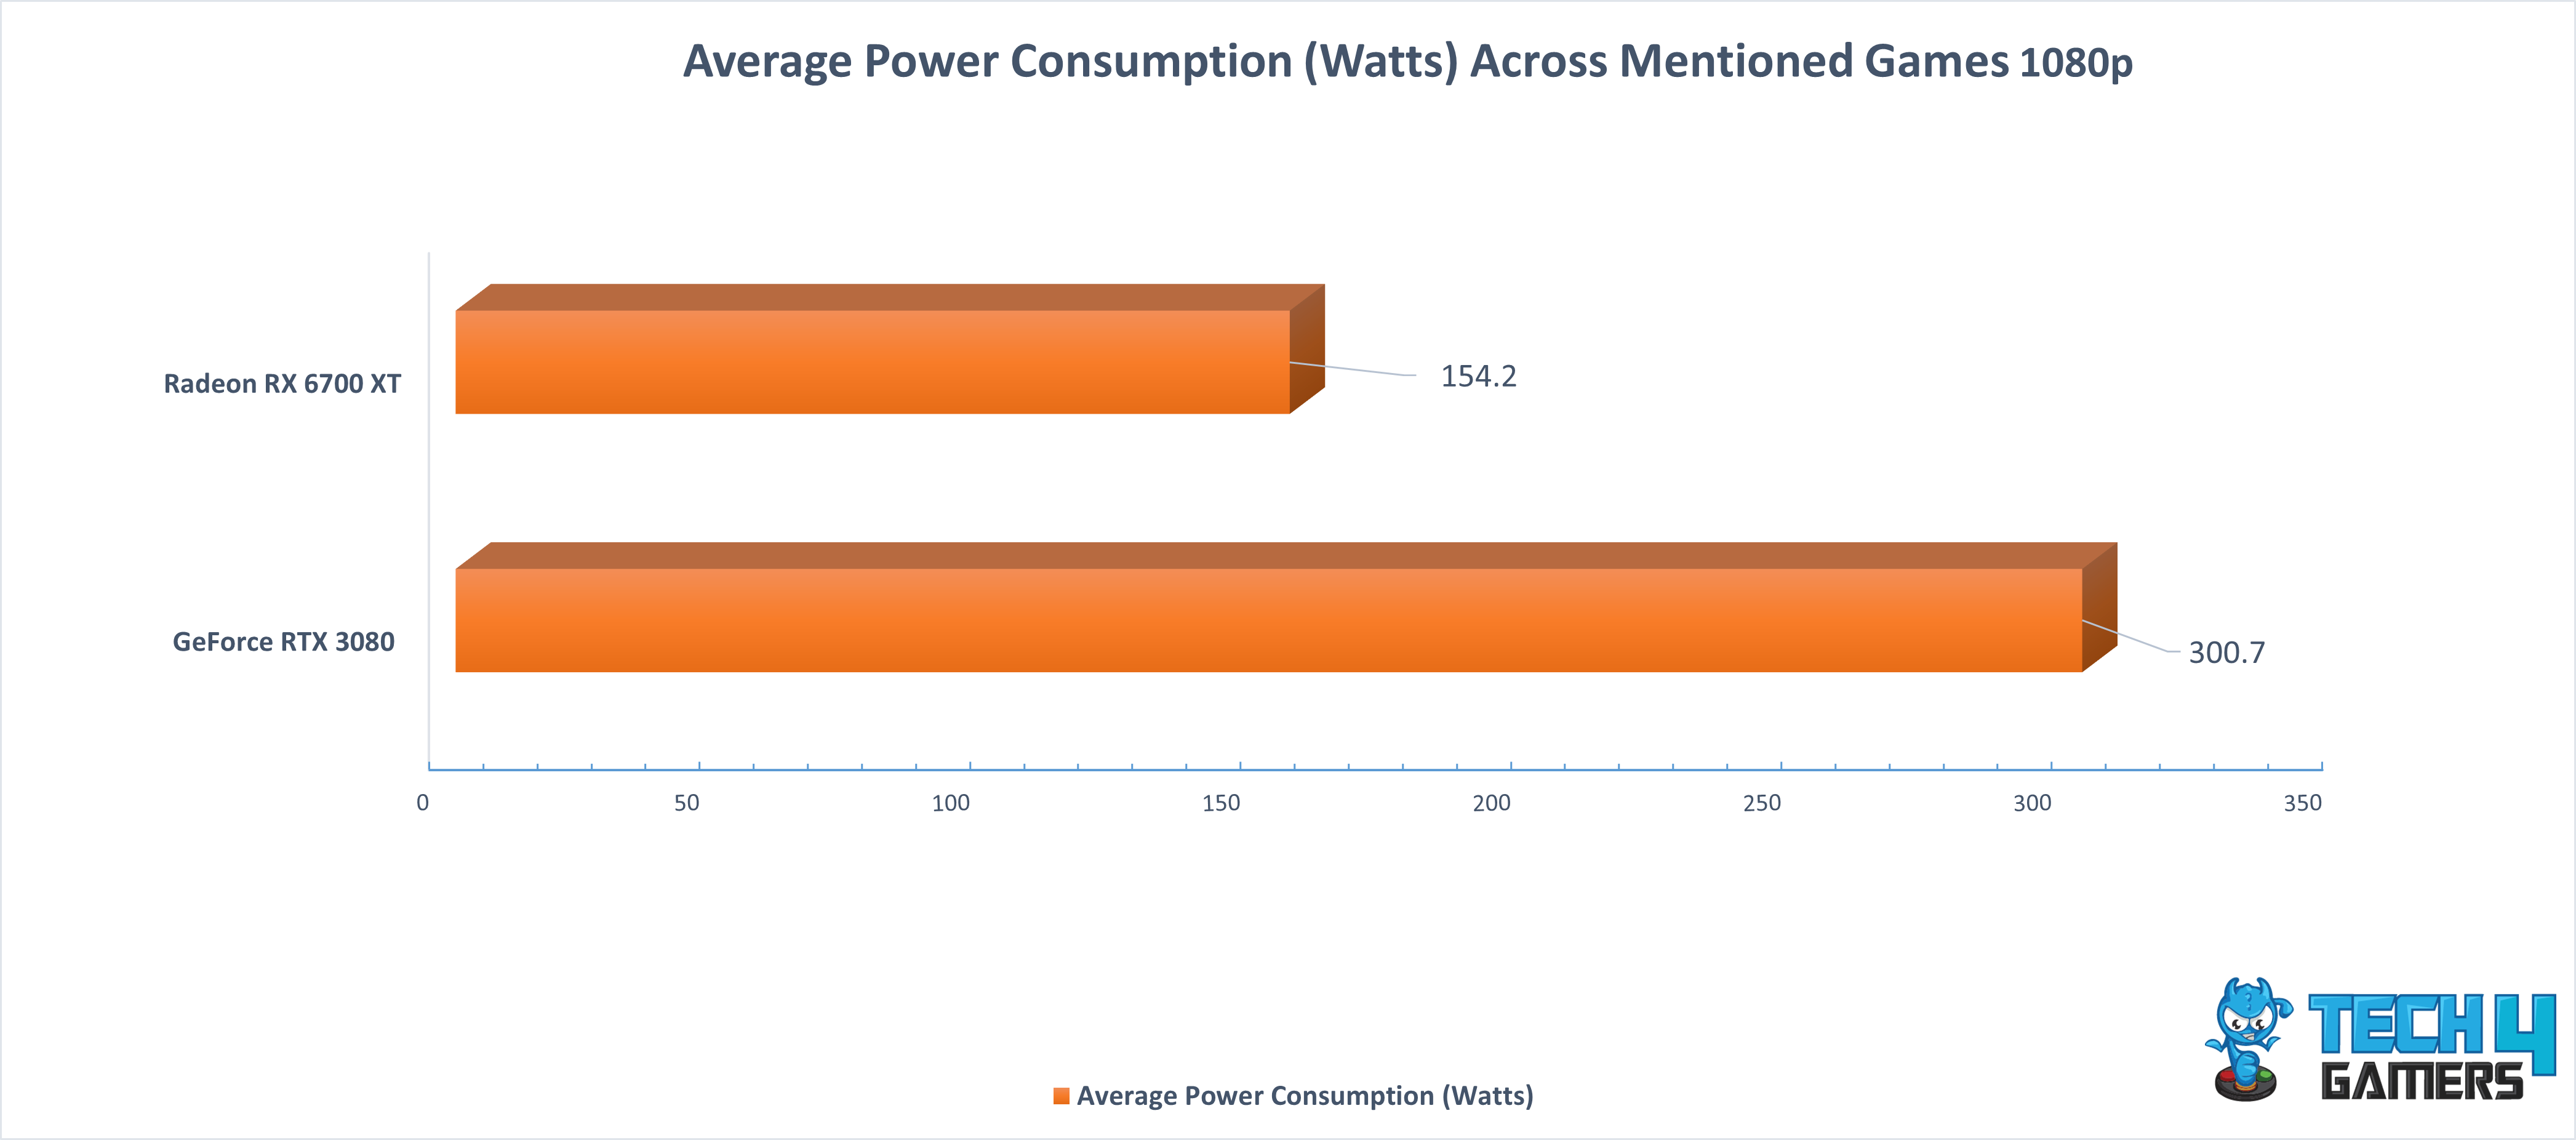
- Our test results revealed that the RX 6700 XT consumes an average of 154.2 watts, while the GeForce RTX 3080 consumes 300.7 watts, making the latter 64.4% less power-efficient than the RX 6700 XT.
Also Read: RTX 4080 Vs RTX 3090
Average Thermal Statistics
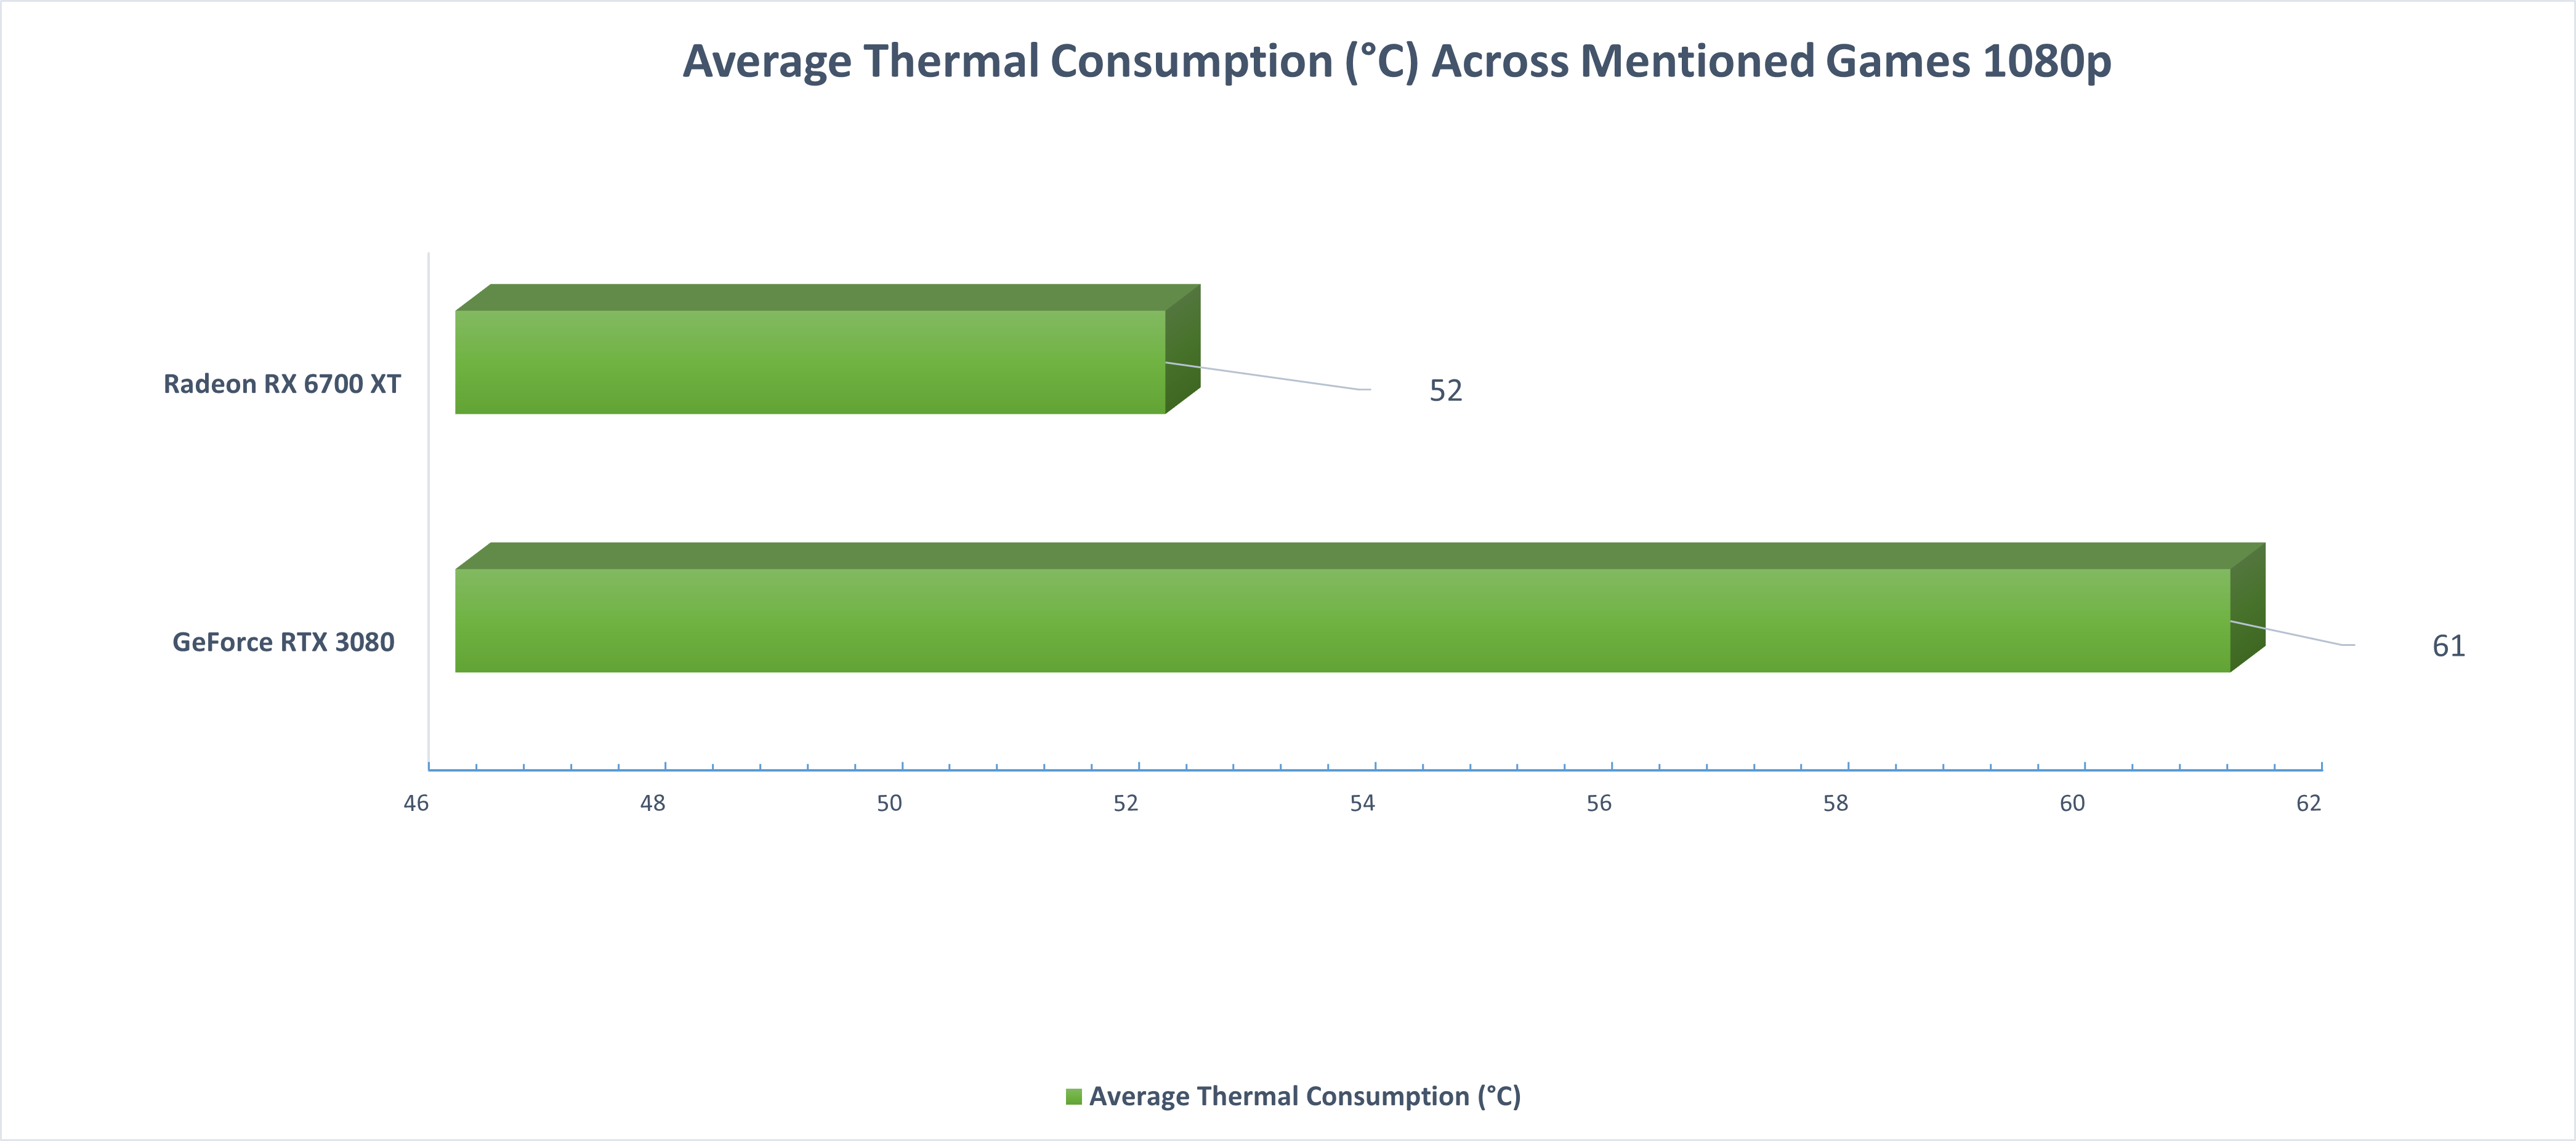
- In our extensive testing, the RTX 3080 performed worse in terms of temperature management during the benchmark test, averaging at 61.8°C, while the RX 6700 XT ran at 52°C, presenting a 17.2% difference.
Pricing And Availability
After we analyzed the pricing and availability of the RX 6700 XT and RTX 3080, it’s clear that there’s a noticeable difference between the two. The Radeon RX 6700 XT has an approximate price tag of $320, while the NVIDIA RTX 3080 comes in at a much higher price of $800.
It’s worth noting that the pricing for these cards can vary depending on the manufacturer and the specific model. Certain brands offer premium versions that may cost more than others. Additionally, the RX 6700 XT is approximately 85.7% cheaper than the RTX 3080, making it a more affordable option for those on a budget.
Which One Would We Recommend?
When it comes to sheer gaming performance, the RTX 3080 stands out with a remarkable 9.6% improvement at 1080p over the RX 6700 XT. If you’re looking for the best gaming experience with the power to handle demanding titles, the RTX 3080 is the way to go, and recommended by us.
On the other hand, the RX 6700 XT offers fantastic cost-efficiency, being almost 37.3% more budget-friendly than the RTX 3080. If you’re mindful of your budget and still want good gaming performance, we recommend the RX 6700 XT as a better choice.
For those who prioritize thermal and energy efficiency, the RX 6700 XT is a clear winner. It generates an average of 17.2% less heat at 1080p.
Moreover, it’s remarkably more energy-efficient, leading to 64.4% less power consumption at 1080p compared to the RTX 3080. This translates into a quieter and cooler gaming setup while saving on your electricity bills.
Pros And Cons
| GPU | Pros | Cons |
| GeForce RTX 3080 |
|
|
| Radeon RX 6700 XT |
|
|
FAQs
The 6700 XT is a mid-tier graphics card from AMD’s Radeon old lineup, designed for high-performance gaming and other demanding applications.
Yes, the RX 6700 XT is a good graphics card for gaming, offering high performance and efficient power consumption at 1080p and 1440p.
The GeForce RTX 3080 comes with an MSRP of 699$, which can vary depending on the model and variant.
Thank you! Please share your positive feedback. 🔋
How could we improve this post? Please Help us. 😔
Feedback By:
[Comparisons Expert]
Abdemanaf is a skilled creative writer who has been honing his craft since 2011. While initially working in different fields, he found a passion for technology and has been exploring the tech world since early 2015. Over the years, he has developed an in-depth knowledge of the latest tech trends and product offerings by various companies.
Abdemanaf’s writing reflects his analytical mindset and ability to think critically. He has a knack for breaking down complex technical information into easily digestible pieces, making his articles engaging and accessible to readers from all backgrounds. In February 2022, he joined Tech4Gamers as a blog and product comparison writer, where he has been able to hone his skills further.
As a writer, Abdemanaf is dedicated to staying up-to-date with the latest technological advancements and trends, enabling him to provide readers with the most relevant and accurate information. He is always eager to learn more and is constantly seeking new challenges to improve his skills.
Get In Touch: manaf@tech4gamers.com


