 Threads

Since the all-new RTX 4090 and the RX 7900 XT are the talks of the town, the price of last year’s flagships cements them to be a deal worth considering. The RTX 3080 vs RX 6900 XT comparison will look at two well-established performers to see which card best suits your needs.
Key Takeaways
- The RTX 3080 consists of a 10GB and a 12GB variant, where both perform much similarly to one another.
- RX 6900 XT cost around $200 more than the RTX 3080 10GB at launch, and it performed around 7.6% better in our performance testing at 1440p.
- The more advanced RT cores of the RTX 3080 promise to give much better ray tracing performance than the RX 6900 XT.
- On average, the RTX 3080 remains around 9°C cooler than the RX 6900 XT, but the RTX 3080 12GB is not as readily available as the RX 6900 XT and RTX 3080 10 GB.
Comparison Table
| Feature | RTX 3080 10 GB | RTX 3080 12 GB | RX 6900 XT |
| CUDA Cores | 8,704 | 8,960 | 5,120 |
| Memory Clock | 1188 MHz (19 Gbps effective) | 1188 MHz (19 Gbps effective) | 2000 MHz (16 Gbps effective) |
| Memory Bandwidth | 760.3 GB/s | 912.4 GB/s | 512.0 GB/s |
| RT Cores | 68 | 70 | 80 |
| Tensor Cores | 272 | 280 | 320 |
| Transistors | 28,300 million | 28,300 million | 26,800 million |
| Memory Bus | 320 bit | 384 bit | 256 bit |
| Interface | PCIe 4.0 x16 | PCIe 4.0 x16 | PCIe 4.0 x16 |
| Launch MSRP | $699 | $799 | $999 |
| Best Variants | RTX 3080 | RTX 3080 | RX 6900 XT |
Architectural Differences
- Clock Speeds: The RTX 3080 has a base clock of 1440MHz and a boost clock of 1710MHz. In contrast, the RX 6900 XT boasts a higher base clock of 1825MHz and a significantly higher boost clock of 2250MHz. This results in the RX 6900 XT having a substantial advantage in clock speeds over the RTX 3080.
- Processing Nodes: Both the RTX 3080 and RX 6900 XT utilize a Samsung 8nm node for their GPU architecture. However, it’s worth noting that the RX 6900 XT’s RDNA 2.0 architecture is manufactured on a more advanced TSMC 7nm process for its computational components.
- Memory: The RTX 3080 comes in two variants, one with 10GB of GDDR6X memory and another with 12GB of GDDR6X memory. In contrast, the RX 6900 XT features a generous 16GB of GDDR6 memory. While the RX 6900 XT leads in terms of VRAM size, it’s also important to consider memory bandwidth and bus width. The RTX 3080 12GB variant boasts a wider 384-bit memory bus.
- TDP: The RTX 3080 has a TDP of 320W, while the RX 6900 XT is rated at 300W. The RTX 3080 12GB variant has a slightly higher TDP at 350W.
Benchmarks
The architecture of these cards makes them seem pretty different, but how do they perform? To answer this, we fixed up a test bench to evaluate their real-world performance, the specs of which you can read below:
- OS: Windows 11
- CPU: Intel Core i7-13700K
- Motherboards: ASRock Z790 Taichi Lite Motherboard
- RAM: Kingston Fury Renegade RGB DDR5 32GB 7200MHz
- SSD: XPG GAMMIX S70 BLADE 2TB NVMe SSD
- PSU: Enermax Revolution D.F. X 1050W
- CPU Cooler: MSI MAG CORELIQUID E360 CPU Liquid Cooler
The tests below have been tested on the 1440p resolution.
Far Cry 6
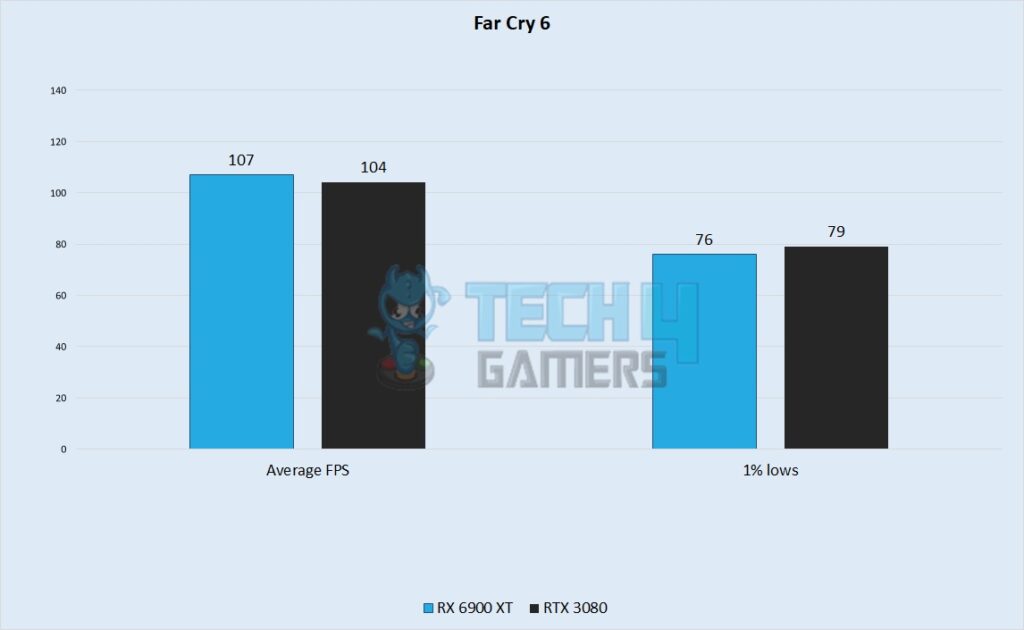
- In our tests of Far Cry 6, the RX 6900 XT came out ahead, but not by a huge margin. AMD’s card churned out an average framerate of 107 FPS, whereas Nvidia’s efforts came out to around 104 FPS.
- The difference in 1% lows was not noticeable in our tests either, with the 6900 XT going down to 76 FPS, whereas the RTX 3080 pulled ahead with a minimum framerate of 79 FPS.
Hitman 3
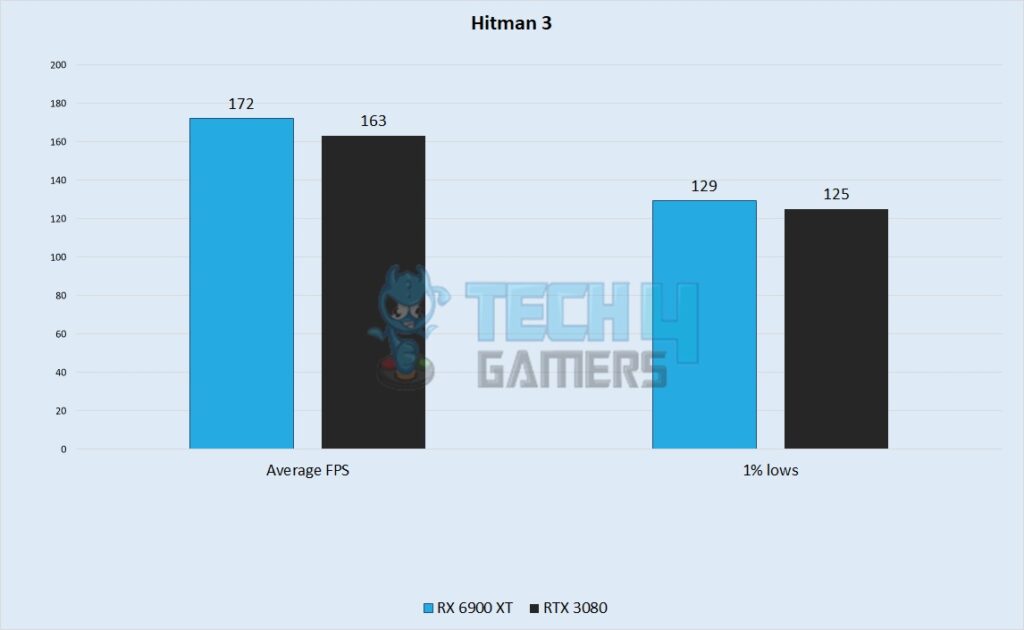
- Hitman 3 had these cards churning out a lot of frames, with the RX 6900 XT having an average of 172 FPS in our test, whereas the RTX 3080 had an average framerate of around 163 FPS.
- These GPUs were proving their similarities with their 1% lows, with the RX 6900 XT dipping down to 129 FPS with the occasional more demanding scene, whereas the RTX 3080 dipped to around 125 FPS.
Rainbow Six Siege
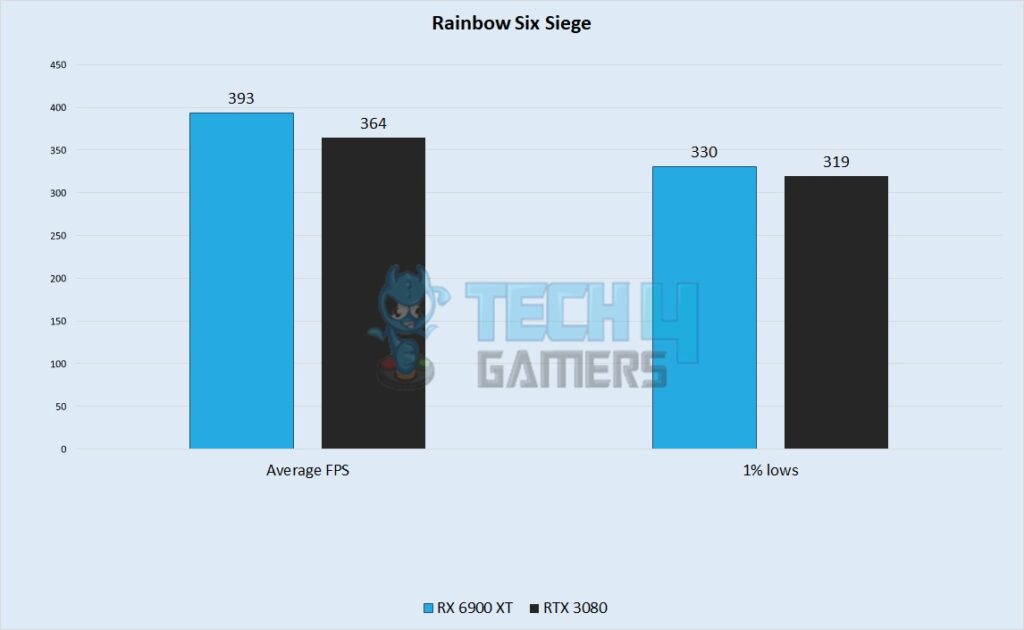
- This game ran pretty great on both cards in our test, with the RX 6900 XT spitting out an average of 392 FPS, whereas the RTX 3080 was around the 364 FPS mark. The difference in this game might seem like a lot, but it doesn’t feel very different as both cards are already at a very high refresh rate.
- 1% lows were around 330 FPS on the RX 6900 XT in our benchmark of this game, whereas the RTX 3080 dipped to around 319 FPS.
Apex Legends
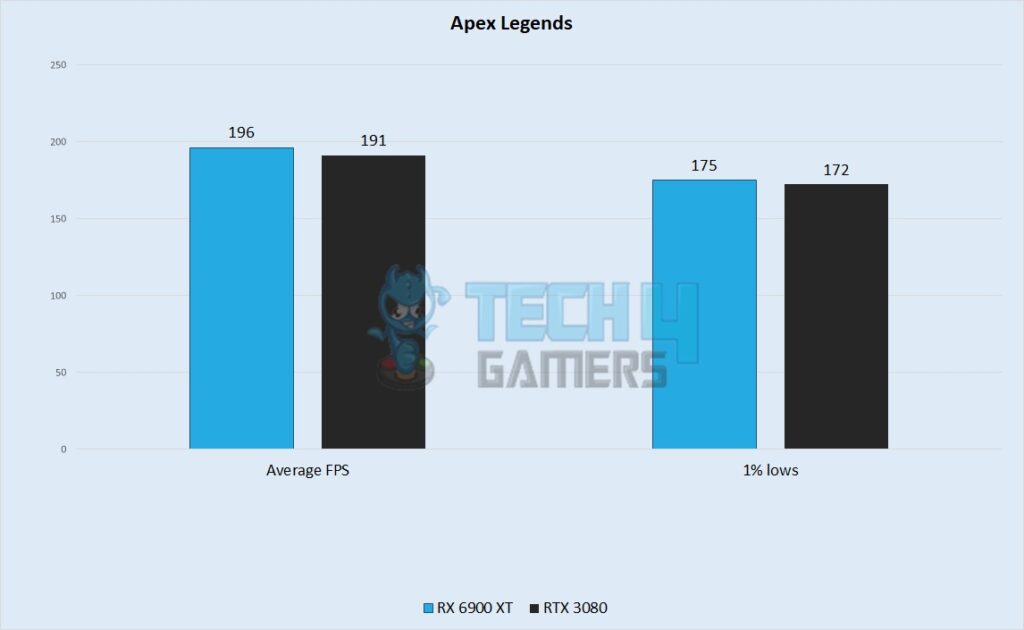
- Keeping on the trend of testing out competitive games, Apex Legends had an average framerate of 196 FPS in our test with the RX 6900 XT, whereas the RTX 3080 managed to get around 191 FPS.
- The 1% lows were nearly identical, with the Radeon card getting 175 FPS in demanding scenes, while the GeForce hovered around 172 FPS.
Assassin’s Creed Valhalla
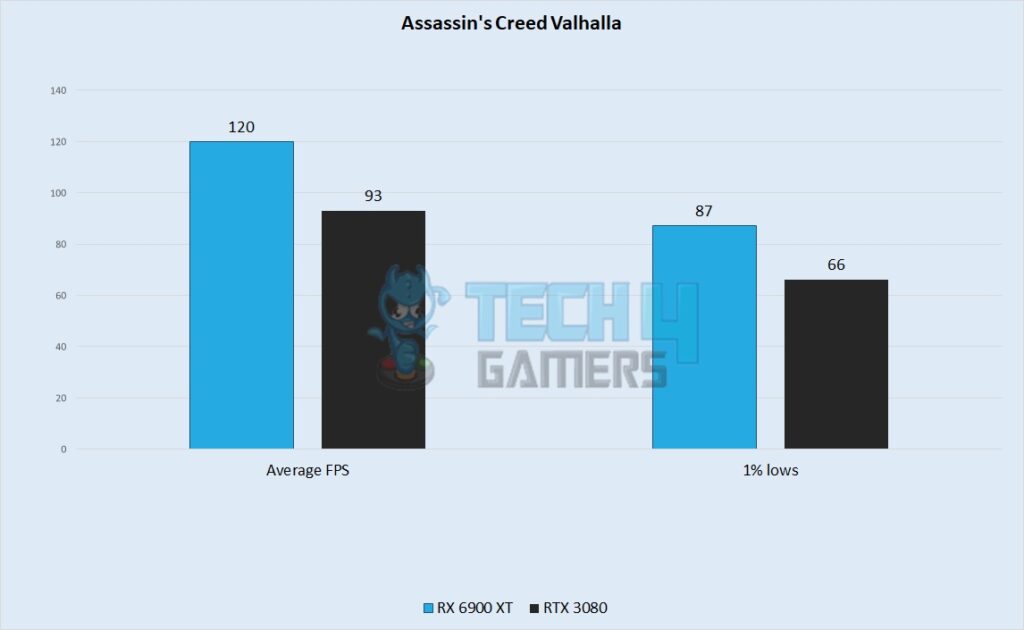
- Switching to a more story-driven game than the ones before, the RX 6900 XT had a much higher framerate of 120 FPS in our benchmark of AC Valhalla, whereas the RTX had an average framerate of around 93 FPS.
- The 1% lows were even more jarring between the two cards, with the RTX 3080 getting lows of around 66 FPS, while the 6900 XT enjoyed a smooth 93 FPS average in our gameplay.
Overall Gaming Performance
Now that we understand the capabilities of both these cards, this part of the comparison will take a broader look at the RTX 3080 vs RX 6900 XT in terms of framerate, power draw, and thermals.
Framerate
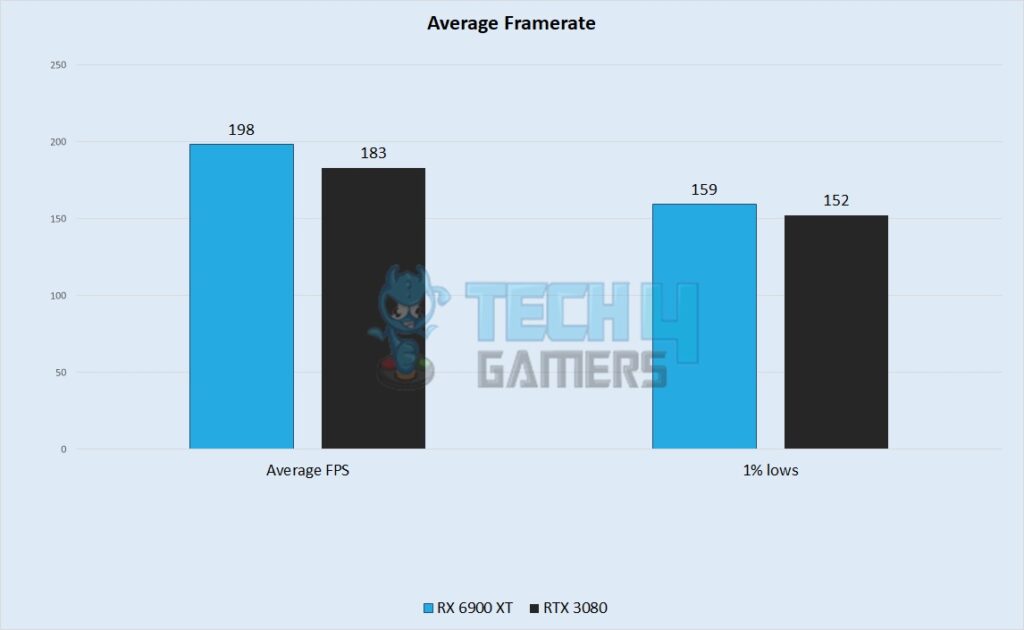
With our tests comparing the performance of these processes without ray tracing enabled, the RX 6900 XT came out ahead with average framerates around 198 FPS, whereas our testing of the RTX 3080 had it at a cumulative average of 183 FPS.
The 1% lows were also quite close between these cards, with the RTX 3080 giving minimums of around 152 FPS in the games that we tested, whereas the RX 6900 XT churned out 159 FPS.
Power Consumption
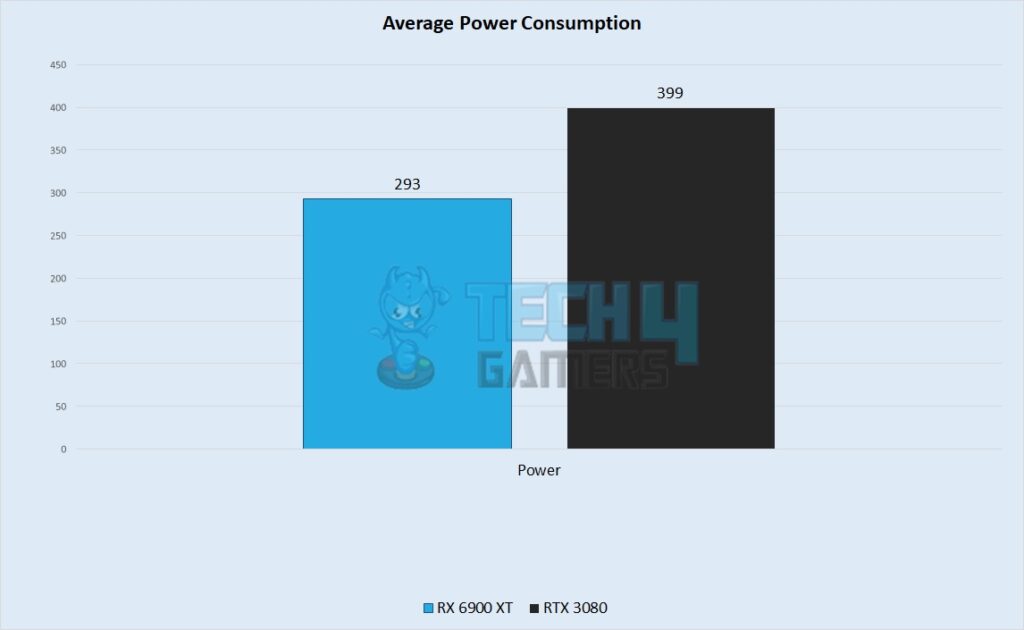
Though our tests showed the RX 6900 XT to give better performance than the RTX 3080, it was also more power efficient than the Geforce card. Gaming at 1440p gave the 6900 XT an average framerate of around 293 watts, whereas the RTX 3080 had an average power consumption of around 399 watts in our tests.
Thermal Efficiency
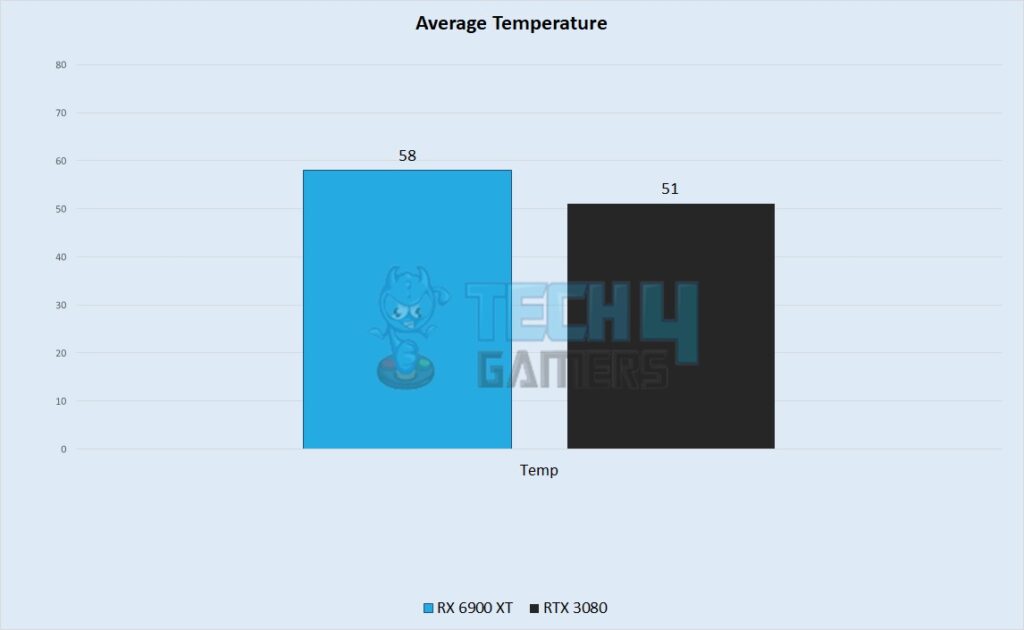
All the power the RTX 3080 was drawing also spilled over to its more robust cooler, giving it an average temperature of 51°Cin our tests, whereas the Radeon stood around 58°C, which is significantly hotter than its rival.
The temperatures of these cards have a very significant relation with a lot of factors like the temperature of your room, the airflow in your case, and the cooler used on your card, so your mileage might vary.
Price And Availability
The model of the RTX 3080 10GB sells for around $500 on Newegg, whereas the RX 6900 XT also goes for around the same price when it is in stock.
Both cards should be readily available at any moderately sized computer parts store around the world.
What We Recommend
The performance uplift of the 12GB 3080 is not worth its increased price, though this might change in the future with how power-hungry modern games are getting.
The price of the RTX 3080 and the RX 6700 XT is around the same, but the Radeon card edges the RTX out in terms of performance.
The difference in framerate between these two cards is not a lot in rasterized games, but the RTX 3080 takes a massive win in terms of ray tracing performance, and it is powerful enough to play games with RT on without getting choppy.
The decision between these two cards depends on the type of gamer the buyer is. If you enjoy ray traced gaming, it might be better to get the RTX card, but for everyone else, the RX 6900 XT is a better option.
Pros And Cons
| GPU | Pros | Cons |
| RX 6900 XT |
|
|
| RTX 3080 |
|
|
FAQs
Yes, the RTX 3080 family consists of the RTX 3080 10GB, RTX 3080 12GB, and RTX 3080Ti. The RTX 3080 10 GB was launched back on 17th September 2020, and the RTX 3080 12GB was launched this year on 11th January 2021.
Both the RTX 3080 and RX 6900 XT are high-performing GPUs. However, the RTX 3080 10 GB falls short in overall performance when compared to the RX 6900 XT. The difference is about 15-20 FPS on games played in normal settings. However, it shows better performance as it leads by 10-20 FPS when Ray Tracing is enabled.
RTX 3080 12 GB is a viable option if we compare it with the RX 6900 XT, as it packs a similar performance as the RX 6900 XT and is relatively cheaper. If you have a stacked wallet, RX 6900 XT should be your call, but if you fall short in terms of money, the RTX 3080 12 GB is the best option for you.
More From RX 6900 XT
More From RTX 3080
Thank you! Please share your positive feedback. 🔋
How could we improve this post? Please Help us. 😔
[Comparisons Expert]
Abdemanaf is a skilled creative writer who has been honing his craft since 2011. While initially working in different fields, he found a passion for technology and has been exploring the tech world since early 2015. Over the years, he has developed an in-depth knowledge of the latest tech trends and product offerings by various companies.
Abdemanaf’s writing reflects his analytical mindset and ability to think critically. He has a knack for breaking down complex technical information into easily digestible pieces, making his articles engaging and accessible to readers from all backgrounds. In February 2022, he joined Tech4Gamers as a blog and product comparison writer, where he has been able to hone his skills further.
As a writer, Abdemanaf is dedicated to staying up-to-date with the latest technological advancements and trends, enabling him to provide readers with the most relevant and accurate information. He is always eager to learn more and is constantly seeking new challenges to improve his skills.
Get In Touch: manaf@tech4gamers.com


