At Tech4Gamers, I contribute as a Senior News Reporter, combining my skills and gaming enthusiasm to keep our audience updated on the latest developments.
Story Highlight
A reliable leaker says Nvidia DLSS 4 is real.
The latest iteration of the AI-based technology is expected to feature neural rendering capabilities.
It may be exclusive to the GeForce RTX 50 lineup, with a reveal expected at CES 2025.
Nvidia’s upcoming series of graphics cards is right around the corner. The GeForce RTX 50 lineup is expected to eclipse its predecessors in terms of performance, with the latest information detailing the TDP of the GeForce RTX 5080.
Continuing the series of leaks, a reliable insider has also suggested that DLSS 4 is real and could be introduced at CES 2025.
Why it matters: Nvidia previously unveiled DLSS 3 as one of the major selling points of the GeForce RTX 40 lineup. Therefore, the next iteration of this AI-based upscaling technology could serve a similar purpose for the new graphics cards.
More Details On Nvidia’s New Technology Have Been Validated | Image via Twitter
As per the reliable Kopite7kimi, DLSS 4 will be one of the new features introduced with Nvidia’s upcoming gaming GPUs. The leaker’s statement came in response to an image that highlighted this iteration of the AI-based upscaling as part of the GeForce RTX 5080’s feature set.
Interestingly, this is not the first time discussions have pointed to DLSS 4. A previous press release from AIB Inno3D hinted at “Advanced DLSS Technology” and “Neural Rendering Capabilities” for the new graphics cards.
Nvidia has also previously discussed the possibility of generating objects for games using AI. Therefore, with Kopite7kimi confirming the existence of DLSS 4, fans can expect to hear more about it at CES 2025 on 6 January.
The Official Blackwell Gaming Reveal Is Right Around The Corner
Because of the company’s history, it will be interesting to see whether this iteration of the technology is exclusive to the new graphic cards. Nvidia used the same approach for DLSS 3, so GeForce RTX 40 owners may not be able to benefit much from the new innovations.
What are your thoughts on DLSS 4? Are you excited to see the new software features that accompany the latest gaming GPUs? Let us know in the comments, and share more of your thoughts on the Tech4Gamers Forums.
I’ve previously worked for eXputer as a Senior News Writer for several years. Now with Tech4Gamers, I love to devoutly keep up with the latest gaming and entertainment industries. I have a Bachelor’s Degree in Computer Science and years of experience reporting on games and breaking exclusive stories. Besides my passion for gaming journalism, I love spending my leisure time farming away in Stardew Valley. VGC, IGN, GameSpot, Game Rant, TheGamer, GamingBolt, The Verge, NME, Metro, Dot Esports, GameByte, Kotaku Australia, PC Gamer, and more have cited my articles.
Story Highlight
AMD CPUs stole a huge part of Intel’s market share in December 2024, boasting over a 4% increase since last two months.
The difference during the same time in December 2023 was quite small in comparison.
Such a huge increase shows that AMD CPUs have gained immense popularity in recent years.
Intel has held a long leash over the CPU market shares ever since PC gaming became a huge thing. AMD has been the only close competitor to challenge the giant openly, forcing both to innovate for the benefit of gamers. The price-to-performance ratio offered by the Ryzen series is almost unmatched, and having more cores and threads has also made it a popular choice in recent years.
However, a new report suggests that AMD might be on its way to not only rival Intel CPUs but also overtake them in the future.
Steam published its hardware and software survey for December 2024, confirming that the company stole a huge chunk of Intel’s market shares with a 3% boost compared to December.
Why it matters: The user perception regarding the AMD Ryzen CPU series has continued to shift over the years, now even affecting Intel’s market shares in official reports. The competition is only expected to grow.
AMD CPUs saw a staggering increase of over 4% in market share over Intel last month.
As seen in the report, AMD CPUs leaped from 35.71% to 38.73% in two months, while Intel’s CPU market share declined from 66.17% to 63.43% instead. Such a massive jump by AMD has not been observed for a long time.
In comparison, AMD CPUs in December 2023 were in the low thirties and saw a decrease in market share instead.
This tidbit has excited many users who have been switching over from Intel to AMD CPUs. However, some argue AMD still needs to catch up with Intel in the GPU department.
Do you think this increase in AMD’s market share compared to last year suggests that gamers prefer it more over Intel CPUs? Let us know your thoughts in the comments below, or join the discussion on the official Tech4Gamers forum.
At Tech4Gamers, I mainly cover new gaming news, leaks, and rumours. Aside from that, I love to write features about my favourite games while inserting my opinion about their different aspects.
Story Highlight
During The Game Awards 2024, Elden Ring Nightreign, a spin-off in the franchise, was revealed, surprising a massive fandom.
The game features bosses from different FromSoftware games, possibly connecting Elden Ring to the Dark Souls franchise.
Due to the intense reveal, the game is already among the top 10 wishlists on Steam.
Elden Ring surprised everyone back in 2022, and to this date, this game hasn’t lost its popularity. Several YouTubers and gamers do different challenge runs because it has infinite replayability.
Shortly after, fans started demanding FromSoftware to release another DLC. The developer listened to the fandom’s demand, but instead of releasing another DLC, it announced a whole new game in the series, Elden Ring Nightreign.
The spin-off Elden Ring title is already among the top 10 wishlisted titles on Steam.
Why it matters: FromSoftware exceeded everyone’s expectations with the Elden Ring DLC, and the reveal of Elden Ring Nightreign caught the fans by surprise, making them way more excited about the game.
The Upcoming Elden Ring Spin-Off Is Already Among The Top 10 Wishlists On Steam
As you can see in the image above, Nightreign is in seventh place and is likely to climb even higher. FromSoftware has yet to confirm its release date, but it is confirmed to launch in 2025.
The game is expected to be ranked among the top 5 most wishlists in just a couple of weeks as its excitement will keep on increasing. FromSoftware seems to have connected the Dark Souls world with Elden Ring, so both franchise players would want to play this.
The top 3 best wishlists are Monster Hunter Wilds, Deadlock, and Hollow Knight: Silksong, respectively. It may be hard for Elden Ring Nightreign to become the most wishlisted title until MHW is released, but it isn’t impossible.
Elden Ring Nightreign Features Bosses Like Nameless King From The Dark Souls Franchise
Perhaps one more trailer with a release date would make it climb the ranks way quickly.
What do you think about the upcoming Elden Ring Spin-off so far? Are you excited to fight The Nameless King in the Elden Ring Verse, or is it a hard miss for you? Share your thoughts with us in the comments section below or join the discussion at the official Tech4Gamers forums.
As a News Reporter at Tech4Gamers, I bring the latest findings from the tech industry to our readers. Specializing in processors, graphics cards, and more, I strive to deliver detailed insights that keep our audience well-informed and engaged. Periodically, I also delve into the vibrant world of gaming to share captivating stories.
Story Highlight
The RTX 5090 is expected to have a 575W TDP, up from the 450W of the RTX 4090.
The RTX 5080, with the GB203 GPU and 10,752 CUDA cores, will have a TDP of 360W, 40W higher than the RTX 4080.
GeForce RTX 5090 & RTX 5080 are expected to be the most expensive cards from Nvidia yet.
Although a 600W TDP was anticipated for NVIDIA’s next-generation GeForce RTX 5090, recent reports indicate that the company’s upcoming enthusiast graphics card would instead have a 575W TDP.
Why it matters: The increased power draw on the GeForce RTX 5090 and RTX 5080 highlights NVIDIA’s goals for better performance but also raises concerns on the efficiency of next-gen.
Reputable leaker “kopite7kimi” responded to the statement “next-gen 90 > 575W” made by leaker “hongxing202” in a recent post on X by adding, “and RTX 5080360W.” Given that the current-generation flagship RTX 4090 from NVIDIA has a TDP of 450W, the new RTX 5090 has 125W more power at 575W TDP, resulting in a significant increase.
The RTX 5090 is rumored to use the GB202 GPU with 21,760 CUDA cores , making it the first of its kind to go over 20,000. Furthermore, with twice as much memory the GeForce RTX 5090 will reportedly come with 32 GB of GDDR7 memory on a 512-bit interface.
The GeForce RTX 5080, on the other hand, is based on GB203 GPU Core, 24GB GDDR7 memory featuring 10752 CUDA cores. Regarding power draw, the new 80 series card from Nvidia at 360W is 40W greater than the RTX 4080 and 4080 SUPER, featuring 16GB of GDDR7 RAM.
The new 50 series cards from Nvidia, including PCIe 5.0 and DisplayPort 2.1a, are anticipated to support some of the biggest changes since the Ada Lovelace architecture. However, leaked packaging suggests that there aren’t any significant changes.
NVIDIA is expected to make its pricing announcement next week, with GeForce RTX 5080 expected to make an appearance. The GeForce RTX 5090 and GeForce RTX 5070 Ti are set to launch at a later date.
What are your thoughts on the power draw of Nvidia’s next flagship card? Let us know in the comments or join the discussion over on Tech4Gamers forums.
Lead the comparison and blog writing teams at Tech4Gamers.
Oversee teams with a keen eye for detail and precision.
Ensure hands-on writing, with benchmarks and testing as guiding principles.
Guarantee the delivery of the best possible results in concise yet impactful tech tales.
Abde Manaf
At Tech4Gamers, I began as a comparison writer, analyzing GPU and CPU performance. Now, I focus on writing reviews and contributing to the best-ofs section, sharing personal insights after hands-on testing.
Ryzen 7 5800X3D
Rated: 8.5/10
Core i9-14900K
Rated: 9.1/10
Pros And Cons
CPU
Pros
Cons
Intel Core i9-14900K
✅ Excellent gaming performance
✅ Wi-Fi 7 support
❌ High power consumption
❌ Sometimes, it gets overheated
AMD Ryzen 7 5800X3D
✅ High power efficiency
✅ Low price
❌ Not unlocked for overclocking
❌ No integrated graphics
Key Takeaways
After conducting hands-on assessments, I concluded that the Intel Core i9-14900K provides a 21.5% advantage in gaming performance at 1080p resolution.
Based on my testing, the Ryzen 7 5800X3D delivers an impressive 67.3% higher power efficiency and a 17.8% greater thermal efficiency than the Core i9-14900K.
As per the market prices in December 2023, the Ryzen 7 5800X3D is priced at $322, providing a compelling alternative to the $576 Core i9-14900K.
The Core i9-14900K is a better option for gaming enthusiasts pursuing top-tier performance, while the Ryzen 7 5800X3D is a cost-effective, efficient processor.
Why Trust Tech4Gamers
Abde Manaf is our comparison expert who has been benchmarking graphics cards, and processors.
100+ components tested and reviewed by our team of hardware experts (Tech4Gamers Team).
100+ hours spent testing different components for our comparisons.
At Tech4Gamers, ensuring you get reliable information is our priority. That’s why every hardware round-up undergoes a meticulous review process by our team of experts and editors. Each review is carefully examined against our strict editorial guidelines, guaranteeing you trustworthy insights you can depend on.
Architecture: Intel has integrated its avant-garde Raptor Lake Resume hybrid architecture in the Core i9-14900K, while the Ryzen 7 5800X3D boasts AMD’s slightly older Zen 3 (Vermeer) architecture.
Process Node: The Core i9-14900K is developed on Intel’s cutting-edge 10nm fabrication process, whereas the Ryzen 7 5800X3D is produced using the TSMC’s 7nm FinFET node.
CPU Socket: The Ryzen 7 5800X3D operates with AMD’s AM4 socket containing 1331 pins, while the Core i9-14900K employs Intel’s FCLGA1700 socket, featuring a higher count of 1700 pins for improved data rate and cooling.
Clock Speed: Considering the base clock, the Ryzen 7 5800X3D has about 6.25% faster frequency than Core i9-14900K’s performance cores. However, the Core i9-14900K offers a 33.3% higher CPU turbo clock than the Ryzen 7 5800X3D.
CPU Memory: The Ryzen 7 5800X3D only supports DDR4, while the Core i9-14900K is also compatible with DDR5. The Core i9-14900K has a memory bandwidth of 89.6 GB/s, whereas the Ryzen 7 5800X3D has a 47.68 GB/s bandwidth.
Integrated Graphics: Intel offers UHD Graphics 770 with the Core i9-14900K. This iGPU has 2 cores and a dynamic frequency of 1.65 GHz. Contrarily, the Ryzen 75800X3D lacks an integrated GPU, requiring a dedicated graphics card.
The Core i9-14900K is the top processor of Intel’s state-of-the-art 14th generation, while the Ryzen 7 5800X3D has been the best gaming processor of early 2022. Today, I will evaluate the technical features and gaming abilities of the Core i9-14900K vs Ryzen 7 5800X3D.
Gaming Benchmarks – 1080p
After comprehensively analyzing the technical specifications and architectural distinctions between the Core i9-14900K and Ryzen 7 5800X3D, let’s focus on their performance in demanding gaming scenarios. I played 12 intensive games at 1080p to compare the gaming performance of the Core i9-14900K vs Ryzen 7 5800X3D.
Test Bench
The specifications of my gaming system are as follows.
A Plague Tale: Requiem Benchmarks at 1080p – Image Credits (Tech4Gamers)
Starting with A Plague Tale: Requiem, I got an 11.1% greater performance with the Core i9-14900K, providing 150 FPS on average compared to the Ryzen 7 5800X3D’s 135 FPS.
About the low 1% performance, I observed that the Ryzen 7 5800X3D provided only 118 FPS, whereas the Core i9-14900K provided a superb 136 FPS at its worst 1%.
Assassin’s Creed Mirage
Assassin’s Creed Mirage Benchmarks at 1080p – Image Credits (Tech4Gamers)
During my gameplay of Assassin’s Creed Mirage at 1080p, the Core i9-14900K provided about 7.1% better performance with its 197 FPS average, while the Ryzen 7 5800X3D delivered 184 FPS on average.
Regarding the low 1% performance, the Core i9-14900K achieved an amazing 164 FPS, while the Ryzen 7 5800X3D could only manage 154 FPS.
Assetto Corsa Competizione
Assetto Corsa Competizione Benchmarks at 1080p – Image Credits (Tech4Gamers)
While playing Assetto Corsa Competizione, the Core i9-14900K provided me 172 FPS on average, defeating the Ryzen 7 5800X3D’s 161 FPS by 6.8%.
For the low 1% performance, I noticed that the Core i9-14900K exhibited an impressive 149 FPS, outshining the Ryzen 7 5800X3D, which could only muster a modest 128 FPS.
Baldur’s Gate 3
Baldur’s Gate 3 Benchmarks at 1080p – Image Credits (Tech4Gamers)
During my Baldur’s Gate 3, the Core i9-14900K outperformed the Ryzen 7 5800X3D, averaging 155 FPS compared to 132 FPS, marking a 17.4%advantage.
Examining the worst 1% performance, I observed that the Ryzen 7 5800X3D struggled with only 100 FPS, while the Core i9-14900K delivered an outstanding 132 FPS under similar conditions.
Cyberpunk 2077
Cyberpunk 2077 Benchmarks at 1080p – Image Credits (Tech4Gamers)
In my gameplay of Cyberpunk 2077, the Core i9-14900K showcased superior performance, averaging 169 FPS, surpassing the Ryzen 7 5800X3D’s 142 FPS by 19.0%.
Regarding the low 1% performance, I noted that the Ryzen 7 5800X3D delivered only 120 FPS, whereas the Core i9-14900K excelled with an impressive 142 FPS during its lowest 1%.
Hitman 3
Hitman 3 Benchmarks at 1080p – Image Credits (Tech4Gamers)
In my testing of Hitman 3, the Core i9-14900K delivered an average of 282 FPS, outpacing the Ryzen 7 5800X3D’s performance at 234 FPS by 20.5%.
About the low 1% framerates in this game, I observed that the Core i9-14900K beat the Ryzen 7 5800X3D, which only managed 203 FPS, with a whopping 253 FPS.
Hogwarts Legacy
Hogwarts Legacy Benchmarks at 1080p – Image Credits (Tech4Gamers)
Coming to my Hogwarts Legacy’s gameplay results, the Core i9-14900K achieved an average of 76 FPS, surpassing the Ryzen 7 5800X3D’s 60 FPS by 21.0%.
Regarding the 1% performance dip, the Core i9-14900K excelled with an impressive 50 FPS, while the Ryzen 7 5800X3D recorded a modest 36 FPS at its lowest point.
Spider-Man Remastered
Spider-Man Remastered Benchmarks at 1080p – Image Credits (Tech4Gamers)
When I played Spider-Man Remastered at 1080p, the Ryzen 7 5800X3D could only provide 122 FPS on average, while the Core i9-14900K led the performance by 27.9% with a 156 FPS fantastic average.
Looking at the worst 1% performance, the Ryzen 7 5800X3D struggled at 93 FPS, in contrast to the Core i9-14900K’s exceptional performance, reaching 128 FPS.
Star Wars Jedi: Survivor
Star Wars Jedi: Survivor Benchmarks at 1080p – Image Credits (Tech4Gamers)
In my experience, the Core i9-14900K delivered a competitive performance in Star Wars Jedi: Survivor, maintaining an average of 168 FPS, surpassing the Ryzen 7 5800X3D by 30.2% at 129 FPS.
Examining the low 1% performance of 2 CPUs in this game, I observed that the Ryzen 7 5800X3D yielded only 111 FPS, whereas the Core i9-14900K showcased star performance with a peak of 152 FPS.
Starfield
Starfield Benchmarks at 1080p – Image Credits (Tech4Gamers)
My Starfield gameplay revealed the Core i9-14900K’s prowess, averaging 108 FPS and defeating the Ryzen 7 5800X3D, which managed only 69 FPS with a 56.5% difference.
Coming to the worst 1% performance of these processors in Starfield, the Core i9-14900K provided an excellent 91 FPS, whereas the Ryzen 7 5800X3D turned only 58 FPS.
The Last of Us Part I
The Last of Us Part I Benchmarks at 1080p – Image Credits (Tech4Gamers)
In my session of The Last of Us Part I, the Core i9-14900K stood out, offering an average of 182 FPS and surpassing the Ryzen 7 5800X3D by 19.7%, which lagged behind at 151 FPS.
The low 1% performance of the two CPUs showed that the Core i9-14900K performed well, reaching an incredible 169 FPS, while the Ryzen 7 5800X3D scored only 129 FPS.
Watch Dogs Legion
Watch Dogs Legion Benchmarks at 1080p – Image Credits (Tech4Gamers)
While playing Watch Dogs Legion, I observed the Core i9-14900K’s superior performance, achieving an average of 168 FPS and beating the Ryzen 7 5800X3D by 8.4%, which managed only 155 FPS.
Regarding the 1% performance shortfall in this gameplay, the Ryzen 7 5800X3D lagged with 95 FPS, while the Core i9-14900K demonstrated remarkable prowess by achieving 124 FPS.
Editor`s Note
The Ryzen 7 5800X offers outstanding performance for its price coupled with a remarkable 67% less power consumption in my testing, making the Core i9-10900K hard to recommend solely for gaming. Consider the Core i9-14900k if you have a good budget and need the best for gaming and content creation. but also make sure to check Core i9-14900K Vs Ryzen 9 7950X3D.
– Abde Manaf
Overall Gaming Performance
Average and Low 1% frame rates provided by two CPUs at 1080p – Image Credits (Tech4Gamers)
Average FPS
Based on my examination of the Core i9-14900K vs Ryzen 7 5800X3D, I have concluded that the Core i9-14900K has unmatched gaming performance, achieving a commendable average frame rate of 158.0 FPS at 1080p. On the contrary, the performance demonstrated by the Ryzen 7 5800X3D was limited to achieving an average frame rate of 130.0 FPS.
In my testing of various gaming scenarios, the Ryzen 7 5800X3D consistently fell short of achieving the performance levels demonstrated by the Core i9-14900K. Accordingly, the Core i9-14900K outperforms the Ryzen 7 5800X3D by a substantial 21.5% edge when gaming at 1080p resolution.
Take a look at the testing we conducted for this comparison:
Low 1% FPS
Coming to low 1% performance, the Ryzen 7 5800X3D processed a low 1% frame rate of 102.0 FPS, surpassed by the Core i9-14900K’s low 1% of 132.0 FPS. As a result, in 1% down performance scenarios, the Core i9-14900K defeats the Ryzen 7 5800X3D with a 29.4% implementation advantage.
Winner: Intel Core i9-14900K
Gaming Power Consumption
Game
Intel Core i9-14900K (W)
AMD Ryzen 7 5800X3D (W)
A Plague Tale: Requiem
99
63
Assassin's Creed Mirage
104
61
Assetto Corsa Competizione
102
58
Baldur's Gate 3
109
60
Cyberpunk 2077
95
55
Hitman 3
98
59
Hogwarts Legacy
101
66
Spider-Man Remastered
109
68
Star Wars Jedi: Survivor
107
65
Starfield
97
57
The Last of Us Part I
106
64
Watch Dogs: Legion
102
59
Average Power Draw
102.4
61.2
Winner: AMD Ryzen 7 5800X3D
In my gaming experiences, the Ryzen 7 5800X3D showcases a remarkable 67.3% greater power efficiency than the Core i9-14900K, when addressing the requirements of 1080p gaming.
Let’s also calculate the performance-to-power consumption ratio to evaluate efficiency. The Ryzen 7 5800X3D beat the Core i9-14900K by yielding 2.124 FPS per watt or 37.65% superior performance compared to 1.543 FPS per watt by the Core i9-14900K.
Gaming Temperatures
The table below presents the temperature data I noted for two processors in my gaming sessions.
Game
Intel Core i9-14900K (°C)
AMD Ryzen 7 5800X3D (°C)
A Plague Tale: Requiem
70
58
Assassin's Creed Mirage
71
61
Assetto Corsa Competizione
71
58
Baldur's Gate 3
67
56
Cyberpunk 2077
69
59
Hitman 3
74
60
Hogwarts Legacy
66
59
Spider-Man Remastered
68
62
Star Wars Jedi: Survivor
69
59
Starfield
71
60
The Last of Us Part I
73
61
Watch Dogs: Legion
75
63
Average Gaming Temperature
70.3
59.7
Winner: AMD Ryzen 7 5800X3D
In my CPU gaming temperature analysis, the Core i9-14900K ran hotter than the Ryzen 7 5800X3D. These figures from my table lead me to the end that the Ryzen 7 5800X3D surpasses the Core i9-14900K in terms of thermalefficiency by 17.8%.
The table clearly shows that the Ryzen 7 5800X3D is a more economical choice. Regarding availability, the Core i9-14900K can be procured through Intel’s official store, while the Ryzen 7 5800X3D is attainable for purchase on Amazon, NewEgg, and various other online retail outlets.
Which One Do I Recommend?
Intel Core i9-14900K: I highly recommend considering the Core i9-14900K for exceptional gaming performance and proficiency in content creation. The increased number of cores and threads significantly enhances the overall processing performance.
AMD Ryzen 7 5800X3D: If you are looking for an efficient yet budget-friendly high-performance CPU, consider the Ryzen 7 5800X3D. It consumes 67.3% less power than the Core i9-14900K, resulting in substantial savings on your electricity bills.
The points above can guide you in deciding between the Core i9-14900K and Ryzen 7 5800X3D, but your choice ultimately depends on your requirements and budget.
Lead the comparison and blog writing teams at Tech4Gamers.
Oversee teams with a keen eye for detail and precision.
Ensure hands-on writing, with benchmarks and testing as guiding principles.
Guarantee the delivery of the best possible results in concise yet impactful tech tales.
Intel Core i5 13400
Rated: 9/10
AMD Ryzen 5 5600
Rated: 8/10
Pros & Cons
Processor
Pros
Cons
Intel Core i5 13400
✅ Lower price tag than the 5600X
✅ Overall higher performance
❌Slightly higher power consumption
❌ Has not been discounted substantially
AMD Ryzen 5 5600
✅Very low price tag
✅Lower power consumption
❌Noticeably worse performance
Key Takeaways
The average metrics from our gaming tests showed the Core i5 13400 to be around 6% faster than the Ryzen 5 5600 on average, though our game-to-game testing showed it much more performant in most popular games.
The power consumption of the Core i5 13400 was around 10% higher than the Ryzen 5 5600.
As of late January 2023, the price of the Core i5 13400 is significantly higher than that of the Ryzen 5 5600, putting these two processors in different price categories.
Anyone who can stretch their budget enough should go for the Core i5 13400, though the Ryzen 5 5600 does also pull its weight considering its price tag.
Why Trust Tech4Gamers
Shehryar is our comparison expert who has been benchmarking graphics cards, and processors.
100+ components tested and reviewed by our team of hardware experts (Tech4Gamers Team).
100+ hours spent testing different components for our comparisons.
At Tech4Gamers, ensuring you get reliable information is our priority. That’s why every hardware round-up undergoes a meticulous review process by our team of experts and editors. Each review is carefully examined against our strict editorial guidelines, guaranteeing you trustworthy insights you can depend on.
Comparison Table
Feature
AMD Ryzen 5 5600
Intel Core i5 13400
Architecture
Vermeer
Alder Lake S Refresh
PL1 TDP
65W
65W
Socket
AM4
LGA 1700
Release Date
Q2/2022
Q1/2023
Max Memory Bandwidth
51.2 GB/s
76.8 GB/s
Max. Memory
64 GB
128 GB
PCIe Version
4.0
5.0
Hperthreading
Yes
Yes
iGPU
-
Intel UHD 730
Overclocking
Yes
No
Architectural Differences
Process Node: The Core i5 13400 uses a 10nm processing node, which Intel has been using in their processors for a while now. On the other hand, the Ryzen 5 5600 uses a more advanced 7nm process, bringing some market competition.
Core Count: The Intel processor flexes its hybrid core architecture using 6 performance cores and 4 efficiency cores, which all total 16 threads. On the other hand, the 5600 keeps things simple using 6 performance cores, which total 12 threads.
Clock Speed: The performance cores of the Core i5 13400 have a base clock of around 2.5GHz, which is significantly lower than the 3.5GHz base clock of the Ryzen 5 5600. The boost clocks, however, are slightly higher on the 13400 at around 4.6Ghz, while the Ryzen 5 5600 maxes out around 4.4GHz.
L3 Cache: The Ryzen takes the win in terms of L3 cache with 32MB of super-fast memory onboard, while the Core i5 has 20MB.
Memory: The Intel processor boasts support for both DDR4 and DDR5 memory, while the AMD chip can only run in conjunction with DDR4 RAM.
The barrage of chip releases from AMD and Intel recently has left much to be desired for most consumers, leaving the value-for-money proposition of older chips behind a memory of yesteryears. The Core i5 13400 vs Ryzen 5 5600 comparison will detail the difference between these two chips to help you get the best-performing budget processor out there.
Gaming Benchmarks – 1080p
These subsequent benchmark tests will paint a picture of the difference in performance between the Core i5 13400 vs Ryzen 5 5600. We have performed all tests on our trusty test bench, the specifications of which you can glace at below:
The Core i5 13400 started off strong with an average framerate of 121 FPS in our test of Watch Dogs: Legion, while the Ryzen 5 5600 was a few steps behind with an average framerate of 113 FPS. The difference between the two chips was around 7% in this game.
Coming to the 1% lows, the Core i5 13400 managed to snag another win with minimums of around 90 FPS, noticeably higher than the lows of the Ryzen 5 5600, which sat at around 86 FPS.
Total War: Warhammer III
Total War Warhammer III @1080p (Image By Tech4Gamers)
The difference swelled up to 21.5% in Total War: Warhammer III, with the Ryzen 5 5600 getting an average framerate of around 200 FPS, while the Core i5 flew past it with an average framerate of 243 FPS.
The 1% lows were also a world apart on these two chips, with the Ryzen hovering around 148 FPS, while the Core i5 had minimums of around 169 FPS.
Hitman 3
Hitman 3 @1080p (Image By Tech4Gamers)
The losses of the Ryzen continued in Hitman 3 with an average framerate of 149 FPS, 9% lower than the budget CPU from Intel, which had an average framerate of around 163 FPS.
The Ryzen 5 5600 had 1% lows of around 91 FPS, while the Core i5 13400 maintained a minimum framerate of around 97 FPS in graphically challenging scenes.
A Plague Tale: Requiem
A Plague Tale Requiem @1080p (Image By Tech4Gamers)
Our testing of this game showed that the Core i5 had an average framerate of around 105 FPS, which was leagues above the average framerate of the Ryzen 5 5600 at around 87 FPS. This game contributed to a 20% lead for the Intel processor.
The minimum framerates of the Core i5 were around 92 FPS, which was also significantly higher than that of the Ryzen, which sat at around 76 FPS.
Call Of Duty: Modern Warfare II
Call Of Duty Modern Warfare II @1080p (Image By Tech4Gamers)
The Ryzen finally got a break in this game with an average framerate of 202 FPS, 5% higher than the Core i5’s average framerate of around 192 FPS.
The 1% lows were also substantially smoother on the AMD processor at around 153 FPS, while the Intel chip managed lows of around 127 FPS.
Spider-Man Remastered
Spider-Man Remastered @1080p (Image By Tech4Gamers)
The Ryzen 5 5600 lost once again in our test of Spider-Man Remastered by a margin of around 14% with a framerate of around 82 FPS on average, while the Intel chip had an average closer to around 94 FPS.
As for the 1% lows, the 13400 maintained a minimum framerate of around 80 FPS, significantly higher than the 72 FPS of the 5600. The framerates were relatively low in this game because of the inclusion of Ray Tracing, which is why the difference in framerate was especially noticeable.
Shadow Of The Tomb Raider
Shadow Of The Tomb Raider @1080p (Image By Tech4Gamers)
The average framerate of the Core i5 13400 was around 181 FPS, once again significantly higher than the Ryzen 5’s average framerate of around 170 FPS, specifically around the 6.5% mark.
Minimum framerates fell short of the Ryzen once again at around 133 FPS, while the Core i5 13400 had minimums of 141 FPS.
Horizon Zero Dawn
Horizon Zero Dawn @1080p (Image By Tech4Gamers)
AMD got another big break in the PC port of Horizon Zero Dawn with an average framerate of 200 FPS, 16% higher than the 172 FPS average of the Core i5 13400. This makes sense, as the original version of this game was optimized for the PlayStation, which utilizes AMD hardware.
The 1% lows were also significantly smoother on the AMD processor at around 141 FPS instead of the 124 FPS of the Core i5 13400.
Cyberpunk 2077
Cyberpunk 2077 @1080p (Image By Tech4Gamers)
The Ryzen 5 lost its magic once again with an average framerate of around 138 FPS, over 8% lower than the 150 FPS of the Core i5 13400.
The 1% lows followed a similar pattern, with the Ryzen 5 getting a minimum of around 124 FPS when the going got tough, while the Core i5 was significantly faster with a minimum of around 136 FPS.
CS: GO
CS:GO @1080p (Image By Tech4Gamers)
Finally, we decided to test CS: GO to see the performance of these chips on an older game engine, and the Ryzen 5 5600 came out significantly ahead with an average framerate of 362 FPS, almost 9% higher than the 333 FPS average of the Core i5 13400.
The 1% lows had even more difference between the two, with the Ryzen 5 5600 hanging out around 229 FPS, while the Intel went all the way down to around 170 FPS.
Overall Gaming Performance
Average FPS @1080p (Image By Tech4Gamers)
Average Framerate
The total difference between the two chips came out to around 6%, which does not seem like a lot, but the Core i5 13400 came out ahead by a much greater margin at a greater frequency compared to the Ryzen 5 5600. There were multiple games with a double-digit advantage percentage of the 13400, making its gameplay feel much smoother on most games we tested. Bear in mind these averages do not include CS: GO, as the large difference in that game can skew our data findings.
1% Lows
The minimum framerates were closer on both chips with an advantage of around 3% for the Core i5 13400, but the Intel had some very substantial advantages in some games like A Plague Tale: Requiem.
Because the Intel processor gave much more consistent advantages in our testing, we have to crown it as the victor, at least regarding performance.
Winner: Intel's Core i5 13400
Power Consumption
Game
Core i5 13400(W)
Ryzen 5 5600(W)
Watch Dogs Legion
65
63
Total War: Warhammer III
72
62
Hitman 3
78
69
A Plague Tale: Requiem
73
67
Call Of Duty: MW II
76
65
Spider-Man Remastered
74
60
Shadow Of The Tomb Raider
80
74
Horizon Zero Dawn
68
74
Cyberpunk 2077
74
60
CS: GO
76
73
Average Power Consumption
73.6
66.7
Winner: AMD's Ryzen 5 5600
The average power consumption of these two processors differs by around 10% or about 7 watts, which isn’t a massive difference at such low wattages. For most people, this rather minor difference between the two processors does not play massively to the ultimate purchasing decision.
Price And Value
Processor
MSRP
Current Price
Ryzen 5 5600
💲199
💲134
Core i5 13400
💲221
💲210
Difference
11%
57%
Though both processors started their lifecycle with a relatively close price, the delta has grown larger. The Core i5 13400 is currently 57% more expensive than the Ryzen on Amazon, which makes a head-to-head comparison of such differently priced processors very hard. Still, the difference in price does not equal the increase in performance of the 13400, making the Ryzen 5 5600 the better value processor.
What We Recommend
Core i5 13400: For people on a tight budget, the Core i5 13400 is quite a capable little chip. It gives impressive performance in several games without putting too much stress on your wallet or your power supply. If you have the luxury of choosing between these two processors, we recommend the Core i5 13400.
Ryzen 5 5600: If you find yourself in a place where you cannot stretch your budget to get a Core i5 13400, the Ryzen offers something similar while being even better budget and power consumption-wise. The cherry on top of the deal this processor provides is how cheap it is on the used market, making it ideal for a budget build.
To encapsulate our findings, the performance of the Core i5 13400 is worth the extra money you would spend on this processor, but if you’re on a tighter budget, the Ryzen 5 5600 is a very good processor to spec in.
FAQs
Do either of these processors come with an iGPU?
Yes, the Core i5 13400 comes with Intel UHD Graphics 730, which can do some very light gaming at lower resolutions.
Do these budget processors limit the maximum memory capacity to cut costs?
The Core i5 13400 supports up to 128 GB of memory, which is standard for most processors. The Ryzen 5 5600, however, can only support up to 64 GB of memory, which is fair as most people buying this budget processor should not exceed that limit.
Is the Core i5 13400 better for productivity workloads?
Yes, the Core i5 13400 scores around 20% higher than the Ryzen 5 5600 in Cinebench 2024, indicating better performance in productivity workloads.
At Tech4Gamers.com, I cover the latest news and rumours in the gaming industry, from new game releases to hidden gems and video game leaks. Furthermore, I occasionally write tech articles about video game consoles, providing insights into the hardware and software that powers our gaming experiences.
Story Highlight
Ubisoft is experiencing a significant financial downturn, drastically decreasing its stock value.
Its stock value has gone down by over 45%, which is a new one-year low.
Experts warn that if upcoming releases, especially Assassin’s Creed Shadows, underperform, Ubisoft could face bankruptcy or be acquired soon.
It’s nothing new that Ubisoft is facing a severe financial crisis at the moment. The new year hasn’t been too kind to the French company, as its stock has plummeted by over 45%, reaching a historic one-year low.
Why it matters: This one-year low points to bigger problems within the company, such as weak game sales, delayed projects, and internal struggles.
Regaining investor confidence will decide the French company’s future in the competitive gaming industry.
In the past year, Ubisoft’s share price has dropped by over 45%. This sharp decline has raised concerns among investors and analysts, showing a lack of confidence in the company’s future. In 2023, Ubisoft reported a net loss of €494 million, with its share price falling 79.38% over the last five years.
Many of Ubisoft’s recent game releases have not done well, adding to its financial troubles. For example, Star Wars Outlaws didn’t meet sales expectations, forcing the company to lower its fiscal 2025 revenue forecast from €2.3 billion to €1.95 billion.
Ubisoft has also struggled with internal issues, such as layoffs and studio closures. In December 2024, the company announced it was shutting down its free-to-play shooter XDefiant.
This led to the closure of its San Francisco and Osaka studios and caused major job losses. These actions seem part of a wider effort to reduce costs amid falling revenues.
Ubisoft’s current financial position is similar to a Watchdog that lost its bite. If you know, you know.
In response to the crisis, there have been talks about a possible buyout to make Ubisoft a private company. The Guillemot family, who founded Ubisoft, and Chinese tech company Tencent are exploring their options.
Tencent currently holds over 9% of voting rights, while the Guillemot family owns over 20%.
Meanwhile, Joost van Dreunen, founder of SuperData, warns that Ubisoft could be close to bankruptcy and might be bought by another company as soon as 2025. The company’s market value has dropped significantly, from $12.17 billion in 2021 to just $1.71 billion in January 2025, a decline of 85%.
The next few months will be crucial for Ubisoft as it deals with the financial crisis. Assassin’s Creed Shadows is Ubisoft’s last hope, and if it doesn’t sell well, the company’s future could be in jeopardy.
Do you believe Ubisoft will turn things around, or is it over for the French company? Drop your thoughts in the comments section or join the discussion on the Tech4Gamers forum.
At Tech4Gamers, I contribute as a Senior News Reporter, combining my skills and gaming enthusiasm to keep our audience updated on the latest developments.
[Press Release] G.Skill’s latest memory targets the low CAS latency market, offering compatibility with AMD EXPO profiles for the Ryzen 9000 lineup and X870 chipset motherboards. As per the company, these memory kits will be sold under the Trident Z5 Royal Neo, Ripjaws M5 RGB Neo, and Trident Z5 Neo series.
For PC enthusiasts using the Ryzen 9000 series, G.Skill offers DDR5-6000 CL26-36-36-96 kits with capacities as high as 64GB(2x32GB). These memory kits also support AMD EXPO overclocking.
Memtest Memory Stress Test via G.Skill
Content creators and professionals can look toward the DDR5-6000 CL28 memory. Users can pick between 2x24GB and 2x48GB DDR5-6000 CL28-36-36-96 kits that are ideal for high-performance AM5 systems.
The DDR5-6000 CL28 Memory Was Tested With The ROG Crosshair X870E Hero Motherboard And Ryzen 9 9900X CPU
Both low-latency memory kits will be available to purchase this month. AMD will also roll out a new BIOS update for EXPO support to enable seamless overclocking. Find more details on the official website at this link.
Lead the comparison and blog writing teams at Tech4Gamers.
Oversee teams with a keen eye for detail and precision.
Ensure hands-on writing, with benchmarks and testing as guiding principles.
Guarantee the delivery of the best possible results in concise yet impactful tech tales.
Uzair Qureshi
At Tech4Gamers, I proudly wear the title of Comparisons Specialist. Focused on CPUs and GPUs, I bring forth a wealth of hands-on experience and a keen eye for detail to provide our audience with the latest insights and analyses.
RTX 4070 Super
Rated: 8.5/10
RTX 3080 Ti
Rated: 7.5/10
Pros And Cons
Graphics Card
Pros
Cons
RTX 4070 Super
✅Better Power Efficiency
✅ Lower Price
❌Limited Availability
RTX 3080 Ti
✅ Wider Availability
✅ Strong Used Market Presence
❌ Slightly Lower Performance
Key Takeaways
Our gaming benchmarks showed no impactful performance between the RTX 4070 Super and the RTX 3080 Ti. However, the RTX 4070 was better overall than the 3080 Ti by approximately 1.65%.
The RTX 3080 Ti drew approximately 32.58% more power than the RTX 4070 Super, improving power consumption. The more the GPU is power efficient, the more performance it gives.
As of February 2024, the price of the RTX 4070 Super is around 82.15% lower than the RTX 3080 Ti. Where the 4070 gives a better performance-to-cost ratio, the 3080 Ti is more readily available.
No massive performance difference appeared as we tested both GPUs. But if you are looking for an option that draws less power and produces less temperature, the 4070 Super is the one.
Why Trust Tech4Gamers
Uzair is our comparison expert who has been comparing graphics cards, and processors.
500+ components tested and compared by our team of comparison experts (Tech4Gamers Team).
1000+ hours spent testing different components for our comparisons.
At Tech4Gamers, ensuring you get reliable information is our priority. That’s why every comparison undergoes a meticulous review process by our team of experts and editors. Each comparison is carefully examined against our strict editorial guidelines, guaranteeing you trustworthy insights you can depend on.
Clock Speed: The base clock speed of the RTX 4070 Super is 1.98 GHz, and the RTX 3080 Ti is 1.37 GHz. The boost clock speeds of both GPUs are 2.48 GHz and 1.67 GHz, respectively.
TDP: The RTX 4070 Super has a TDP of 220 W, while the RTX 3080 Ti works on 450 W, nearly double the 4070 Super.
VRAM: The RTX 3080 Ti has 12 GB memory, and the RTX 4070 Super has the same 12 GB virtual random access memory. The difference is in their memory interface.
Other differences: The RTX 4070 Super’s ray-tracing potentially performs better and more efficiently than the 3080. While both cards support NVENC, NVDEC, DirectX 12 Ultimate, Vulkan, OpenGL, etc, the DLSS technology version is 3.0 in 3080 Ti while 3.5 in 4070 Super.
Gamers seeking the ultimate edge crave the newest technology. The newer RTX 4070 Super boasts cutting-edge architecture, but can it dethrone the battle-tested, established RTX 3080 Ti? We compared both graphic cards and real-time tested them in popular gaming titles to reveal the true champion.
Gaming Benchmarks – 1440p
We tested the RTX 4090 Super vs the RTX 3080 Ti in 8 popular video games to analyze the muscles of these cards. It is a way to compare the real-world performances of these GPUs. We selected the following testing rig for the benchmarks to get the most accurate data.
Avatar Frontiers of Pandora @1440p (Image By Tech4Gamers)
We noticed that the RTX 4070 Super gave an average FPS of 41 while the RTX 3080 Ti gave 40 FPS, with a difference of only 2.5%.
There was minimal difference between the 1% low FPS of the RTX 3080 Ti (28 FPS) and the RTX 4070 Super (30 FPS), suggesting a negligible impact on the actual gameplay experience.
Forza Horizon 5
Forza Horizon 5 @1440p (Image By Tech4Gamers)
In Forza Horizon 5, the 4070 Super gave 115 FPS on average, while the 3080 Ti gave 114, with a negligible difference of 0.9%.
We found the RTX 3080 and 4070 performed similarly regarding 1% low FPS. While both achieved high FPS, the 4070 edged out the 3080, reaching 109 FPS compared to 108 FPS of the 3080.
Assassin’s Creed
Assassin’s Creed @1440p (Image By Tech4Gamers)
So far, we haven’t seen any significant difference in average FPS. In this game, the RTX 4070 Super gave approximately 2.67% higher 77 FPS than the RTX 3080 Ti’s 75 FPS.
The RTX 3080 Ti delivered a 1% low FPS of 69. This is slightly better than the RTX 4070 Super, which managed 68 FPS at the same 1% low threshold.
God Of War
God of War @1440p (Image By Tech4Gamers)
In our testing, we noticed that the 4070 Super gave 90 FPS on average while the other gave 86 FPS in God Of War, with a difference of approximately 4.65%.
The newer RTX 4070 Super slightly improved the 1% low FPS compared to the RTX 3080 Ti. While the 3080 Ti delivered 77 FPS, the 4070 Super edged it out with 82 FPS.
The Last of Us Part I
The Last of Us I @1440p (Image By Tech4Gamers)
The minimal difference continues. The RTX 4070 Super gave 43 FPS on average, while the 3080 Ti gave 44 FPS, which is approximately 2.33% higher than the first.
In our benchmarks, looking at the 1% low FPS of these cards, the new 4070 Super came in at 32 FPS, while the well-established 3080 Ti managed 33 FPS.
Cyberpunk 2077
Cyberpunk 2077 @1440p (Image By Tech4Gamers)
The average FPS of the RTX 3080 Ti was 42 FPS, and the RTX 4070 Super was 41 FPS, with a difference of only 2.44%.
The 1% low FPS for the RTX 4070 Super came in at 28 FPS in our testing. Interestingly, the well-established RTX 3080 Ti managed a slightly higher 1% low of 30 FPS.
Hogwarts Legacy
Hogwarts Legacy @1440p (Image By Tech4Gamers)
In Hogwarts Legacy, the RTX 4070 Super gave an average FPS of 57, while the RTX 3080 Ti gave 55 FPS, approximately 3.64% lower.
We saw the RTX 3080 Ti giving 45 FPS and the RTX 4070 Super giving 48 FPS as 1% lows in our benchmarks.
Remnant 2
Remnant 2 @1440p (Image By Tech4Gamers)
The difference wasn’t huge in terms of average FPS. The 4070 Super gave 50 FPS, while the 3080 Ti gave 49 FPS FPS, approximately 2.04% lower.
Our testing found the 1% low FPS for the RTX 3080 Ti to be 36, while the RTX 4070 Super managed 39 FPS.
Editor`s Note
The RTX 4070 Super might benefit more from advancements in AI functionalities within the Ada Lovelace architecture. This could lead to features like enhanced in-game character behaviour, improved game world simulation, and even AI-powered upscaling beyond just DLSS.
– Uzair Qureshi
Overall Gaming Performance
Featured
RTX 4070 Super
RTX 3080 Ti
Average FPS
64.25 📈
63.12 📈
1% Lows
54.5 📉
53.25 📉
Winner: RTX 4070 Super
Our testing found the RTX 4070 Super winner, beating the established RTX 3080 Ti. Although the difference in frame rates is not massive, the 1.8 % difference in average FPS and 2.35% difference in 1% low FPS makes the 4070 Super relatively better than the 3080 Ti.
Power Consumption
Game
RTX 4070 Super (W)
RTX 3080 Ti (W)
Avatar Frontiers of Pandora
213
333
Forza Horizon 5
204
309
Assassin's Creed
211
320
God Of War
212
326
The Last of Us Part I
207
327
Cyberpunk 2077
210
321
Hogwarts Legacy
213
233
Remnant 2
212
326
Average Power Consumption
⚡210.25
⚡311.88
Winner: Nvidia's RTX 4070 Super
The RTX 3080 Ti is more power-hungry than the RTX 4070 Super. With a difference of approximately 48%, the 4070 Super drew less power and gave less temperature. This makes the RTX 4070 Super more durable by preventing other components from overheating against the RTX 3080 Ti.
Price And Value
GPU
MSRP
Current Price
RTX 4070 Super
💲599
💲549
RTX 3080 Ti
💲1199
💲1000
Difference
100%
82.15%
While the 4070 Super and the 3080 Ti have seen price drops from their MSRP, the RTX 4070 Super offers a more affordable option at its current price point. However, the RTX 3080 Ti is more available in the market due to its established presence. The RTX 4070 Super is a newer GPU, so users in the used market may not benefit.
What Do We Recommend?
RTX 4070 Super: For gamers seeking the best value and efficiency, the RTX 4070 Super emerges as the winner. It boasts slightly better performance than the 3080 Ti, consumes significantly less power, and carries a lower price tag.
RTX 3080 Ti: Conversely, the RTX 3080 Ti offers easier accessibility and maintains a slight edge in maintaining a consistent 1% low FPS. However, its higher power consumption, steeper price points, and older architecture make it less attractive in the long run.
Ultimately, it depends on the user’s priorities. Prioritize readily available performance with a potential trade-off in efficiency and cost or opt for the newer, more efficient option with the caveat of potential availability challenges. However, beyond the GPU itself, it’s essential to consider potential bottlenecks in your system. This will help you ensure a balanced and optimized gaming setup, regardless of your GPU.
Frequently Asked Questions
Which GPU is newer, the 4070 Super or the 3080 Ti?
The RTX 4070 Super is the newer GPU launched in Q1 2024. Meanwhile, the RTX 3080 Ti was launched in Q2 2021.
Which GPU has better ray tracing performance
The RTX 4070 Super might have a slight edge in ray tracing due to its newer architecture, but the difference is often minimal.
Is the RTX 4070 Super worth the upgrade from the RTX 3080 Ti?
It depends on your needs and budget. If you’re looking for the absolute best performance and have a system that can handle the higher power draw, the RTX 4070 Super might be worth it. However, upgrading might not be necessary if you’re happy with the RTX 3080 Ti’s performance and prioritize value.
As a News Reporter at Tech4Gamers, I bring the latest findings from the tech industry to our readers. Specializing in processors, graphics cards, and more, I strive to deliver detailed insights that keep our audience well-informed and engaged. Periodically, I also delve into the vibrant world of gaming to share captivating stories.
Story Highlight
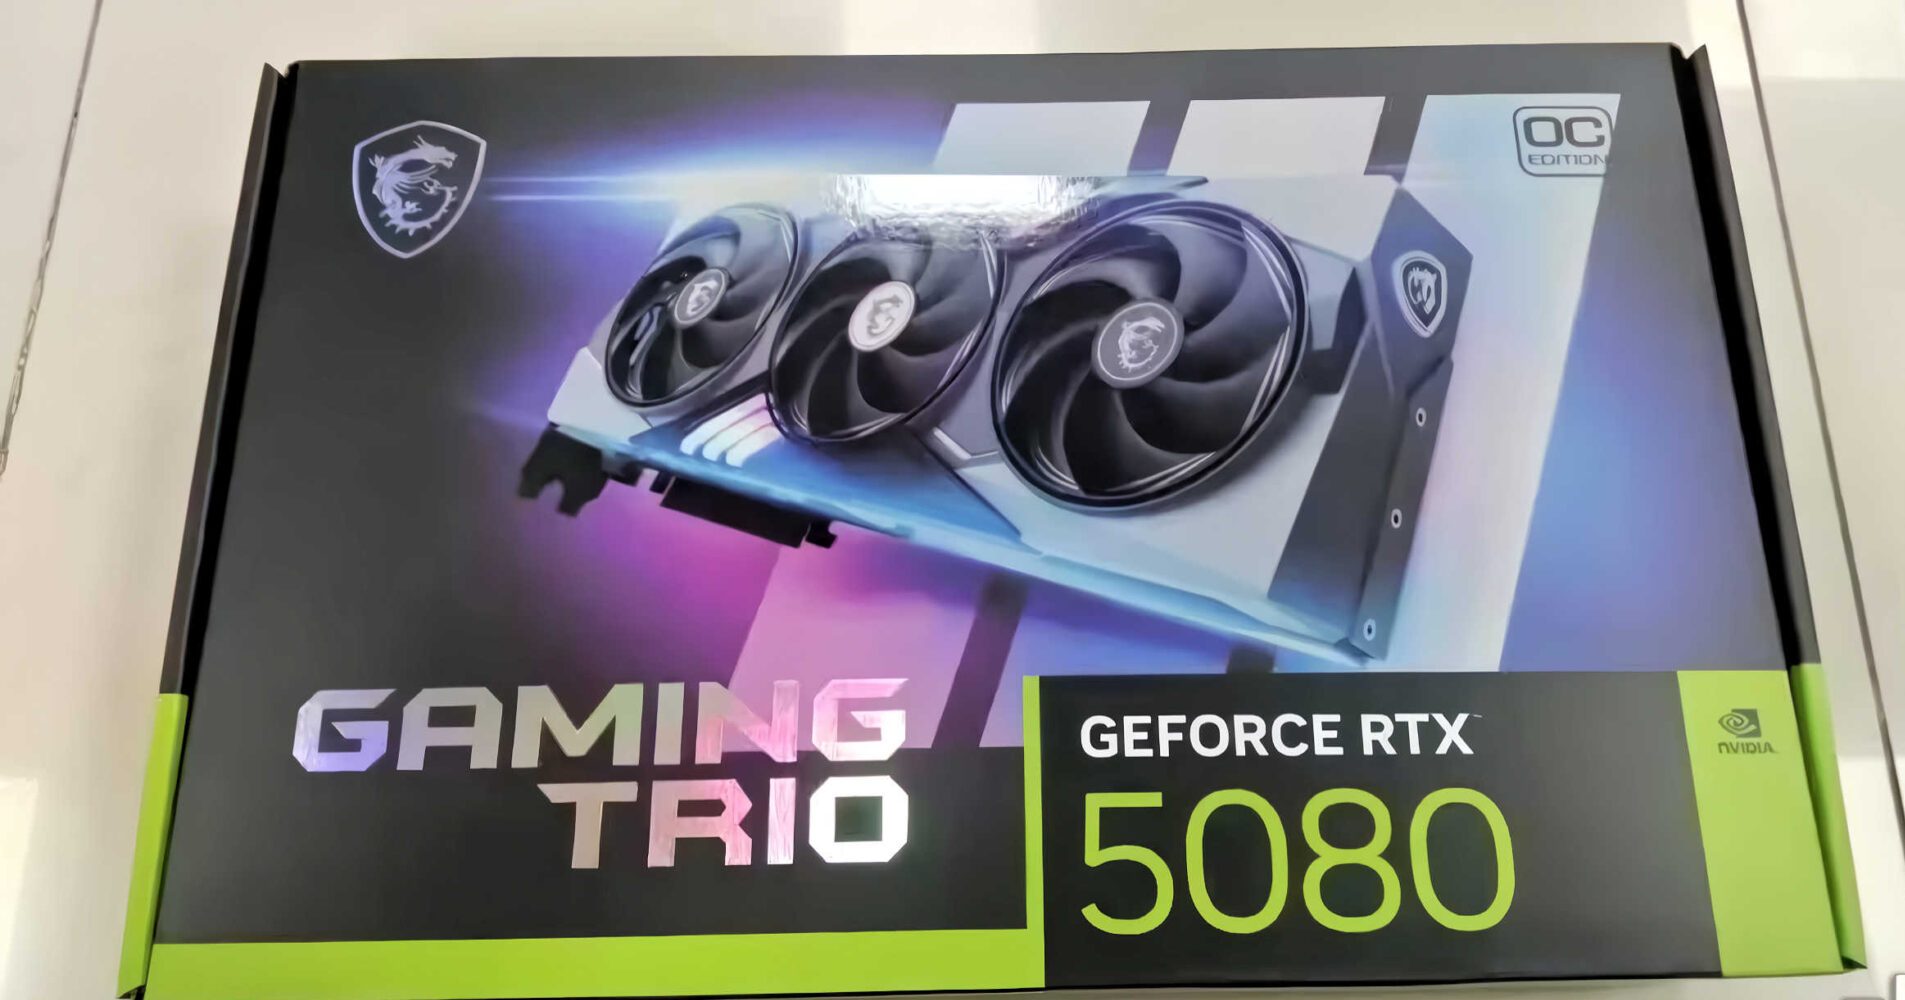
MSI GeForce RTX 5080 features 16GB GDDR7 RAM on a 256-bit memory bus.
The variant appears to have a design that’s strikingly different from its predecessor.
The official announcement for the RTX 5080 is scheduled for CES 2025.
Numerous leaks have surfaced on the internet as the launch of the new GeForce RTX 50 series from Nvidia draws near. The latest in question is that of the GeForce RTX 5080 from one of Nvidia’s AIB partners.
Why it matters: Leaked images of GeForce RTX 5080 from MSI offers early insights into the graphics card’s new design and specs, building excitement ahead of the official announcement.
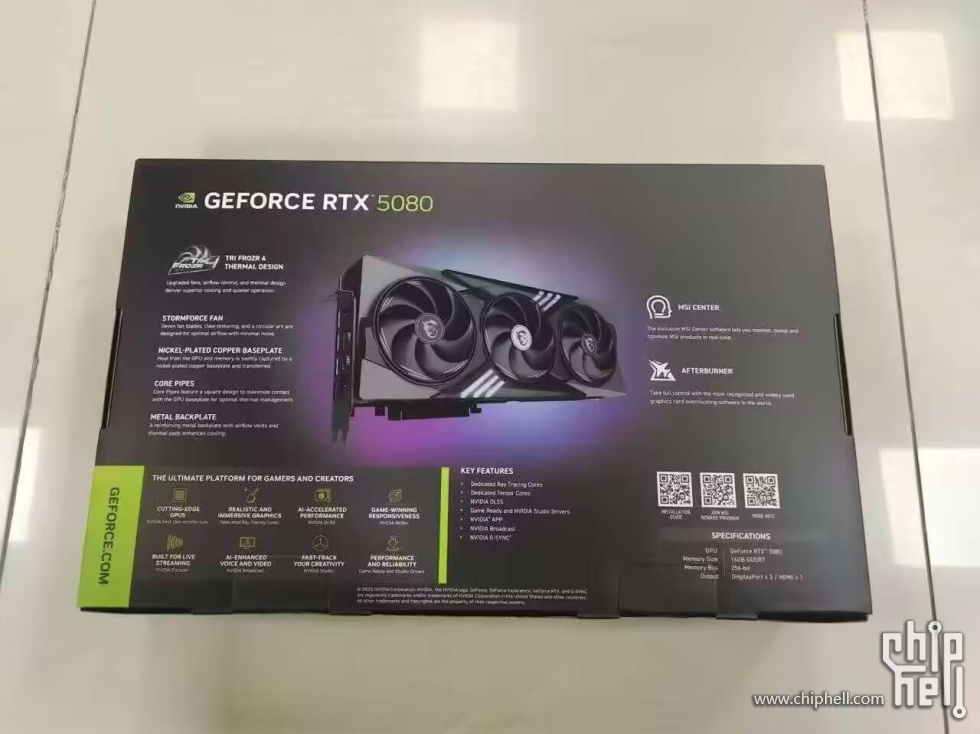
Source: Chiphell
1 of 2
RTX 5080 Leaked Review Benchmarks
We can see that MSI is working on the GeForce RTX 5080GAMING TRIO variant. The card comes with a 256-bit memory bus and 16GB of GDDR7 memory, according to the box. Furthermore, the new 50 series card looks quite different from its predecessor, although they do share a lot of similarities.
The MSI RTX 5080 GAMING TRIO OC will come equipped with three fans in a 2.5-3 slot configuration, featuring the GB203-400 GPU, with 10,752 CUDA cores and a PCIe 5.0 interface.
The official announcement for the RTX 5080 is scheduled for CES 2025, with availability expected by January 21st, 2025. The leaked images suggest that the card is already shipping to distributors ahead of the release.
Currently there is no information on how much the flagship card is expected to sell for. What do you think would be the right price for the new series? Let us know your thoughts in the comments or visit the official Tech4Gamers forums.
I’ve previously worked for eXputer as a Senior News Writer for several years. Now with Tech4Gamers, I love to devoutly keep up with the latest gaming and entertainment industries. I have a Bachelor’s Degree in Computer Science and years of experience reporting on games and breaking exclusive stories. Besides my passion for gaming journalism, I love spending my leisure time farming away in Stardew Valley. VGC, IGN, GameSpot, Game Rant, TheGamer, GamingBolt, The Verge, NME, Metro, Dot Esports, GameByte, Kotaku Australia, PC Gamer, and more have cited my articles.
Story Highlight
The RTX 5090 laptop GPU will allegedly have 24 GB of GDDR7 VRAM, as claimed by a prolific industry leaker.
Such a massive VRAM upgrade is possible over 4090 because the GPU will feature 3 GB GDDR7 memory modules.
All this can be achieved despite only having a 256-bit memory bus. Take the rumors with a pinch of salt.
Nvidia is expected to reveal its RTX 50 series line-up of GPUs in the upcoming CES 2025 event, so the hype is through the roof. Gamers are also excited to see the specs of the new laptops that will utilize the flagship GPU in the Blackwell series. However, a massive leak might have unveiled one of the most exciting and unexpected upgrades for the RTX 5090 mobile variant over the 4090.
An insider has revealed that the 5090 laptop GPU could have 24 GB of VRAM instead of only 16 GB, which has become a huge possibility thanks to an unexpected upgrade in the memory modules.
Why it matters: RTX 5090 laptop GPU utilizing the 3 GB GDDR7 memory modules could enhance its performance by a mile, making 24 GB GDDR7 VRAM possible instead of only 16 GB memory.
The leaker Golden Pig Upgrade mentions on Weibo that the RTX 5090 mobile GPU’s VRAM can rise to 24 GB because it will use 3 GB GDDR7 memory modules. This can make the GPU reach as high as desktop RTX 4090 in VRAM while using the same 256-bit memory bus.
The massive VRAM upgrade will likely not make much of a difference in games, except for some extreme AAA exceptions at 4K resolution.
Of note is that no other GPU has been confirmed or rumored to be utilizing the 3 GB GDDR7 memory module configuration, making the laptop RTX 5090 the only one for now. It is also rumored to use the GB203 die instead of the GB202.
The mobile RTX 5090 is also expected to have about 10,752 cores, only half the amount of the desktop variant. It is best to take these speculations with a pinch of salt despite the track record of the Chinese leaker.
Do you think RTX 5090 laptop GPUs will take advantage of the increased memory modules to use 24 GB of VRAM? Let us know your thoughts in the comments below, or join the discussion on the official Tech4Gamers forum.
At Tech4Gamers, I mainly cover new gaming news, leaks, and rumours. Aside from that, I love to write features about my favourite games while inserting my opinion about their different aspects.
Story Highlight
Black Myth: Wukong, the biggest launch of 2024, was not released on Xbox Series S|X.
The game’s director confirmed the reason, revealing that the Xbox Series S had been the real culprit all along.
However, Microsoft previously failed to acknowledge that the Series S was the issue, and an insider recently reiterated that PlayStation had an exclusivity deal in place.
Black Myth: Wukong, the biggest release of 2024, was released on PlayStation and PC. Unfortunately, the game wasn’t released on Xbox Series S|X. There were many speculations regarding why the title was not released on Xbox, the most popular one being the exclusivity deal with PlayStation.
Recently, the game’s director shed some light on the topic, saying that Black Myth: Wukong’s delay was caused by the Xbox Series S. The insider who previously said that there was an exclusivity deal with PlayStation has reiterated his statement amid the director’s comment.
Why it matters: Xbox fans missed out on one of the best releases of 2024. The game surely would have gained more success had it been released on the missing platform, too.
A Reliable Insider Still Thinks The Exclusivity Deal With PlayStation Was The Real Reason For The Delay | Source: Twitter
Jez Corden, one of the reliable insiders, has again commented on the situation, saying that there was a deal in the place, and that’s what Xbox believes, too.
All I know for certain is: they told Xbox there’s a deal in place, and Xbox believes there’s a deal in place. I’m reporting what Xbox believed to be the case at least back when I did my original report. They have so far declined to refute that.
-Jez Corden
While the director has framed Series S as the real culprit here, Jez still seems to believe that there still was a deal in place. The director has also not commented on the exclusivity deal, which calls for speculation that maybe something really happened.
What do you think is the real reason why Black Myht: Wukong was delayed on Xbox? Do you think the insider is onto something? Share your thoughts with us in the comment section below or join the discussion at the Tech4Gamers official forums.