

The RTX 4090 is a massive, high-performing, and power-hungry graphics card from NVIDIA. It’s designed to outperform the RTX 3090. In this guide, I’ll provide a detailed comparison between the RTX 4090 vs RTX 3090 to determine how much better the new graphics card really is.
Key Takeaways
- During my gaming benchmarks analysis, the RTX 4090 left the RTX 3090 in the dust with over 53.6% better performance on average.
- Not only that, but the Ada Lovelace GPU also ran 0.6% cooler on average in the 10 games I tested.
- The RTX 4090 also consumed about 16.8% more power on average than the RTX 3090.
Comparison Table
| Technical Specs | GeForce RTX 4090 | GeForce RTX 3090 |
| GPU Name | AD102 | GA102 |
| Architecture | Ada Lovelace | Ampere |
| Transistors | 76,300 million | 28,300 million |
| Shading Units | 16384 | 10496 |
| Tensor Cores | 512 | 328 |
| RT Cores | 128 | 82 |
| TMUs | 512 | 328 |
| ROPs | 176 | 112 |
| L1 Cache | 128 KB (per SM) | 128 KB per Array |
| L2 Cache | 72 MB | 6 MB |
| Memory Bus Width | 384 bit | 384 bit |
| Memory Bandwidth | 1,008 GB/s | 936.2 GB/s |
| Suggested PSU | 850W | 750W |
| Release Date | Sep 20th, 2022 | Sep 1st, 2020 |
| Approximated Price | 1,599 USD | 1200 USD |
| Best Variants | BEST RTX 4090 Cards | BEST RTX 3090 Cards |
Architectural Differences
- Process Node: The RTX 4090 utilizes a more advanced 5nm process node, while the RTX 3090 employs an 8nm process node. This indicates a significant improvement in power efficiency and performance for the RTX 4090.
- Clock Speed: The RTX 4090 operates at a base clock of 2235 MHz and a boost clock of 2520 MHz, marking a substantial increase over the RTX 3090’s 1395 MHz base clock and 1695 MHz boost clock. This results in a notable performance boost for the RTX 4090.
- VRAM: Both the RTX 4090 and RTX 3090 feature 24GB of GDDR6X VRAM, offering ample memory for high-resolution gaming, content creation, and demanding workloads.
- TDP: The RTX 4090 has a higher TDP of 450W compared to the RTX 3090’s 350W TDP. This means that the RTX 4090 may require a more robust power supply and cooling solution.
- Supported Technologies: Both the RTX 4090 and RTX 3090 support DLSS (Deep Learning Super Sampling), an AI-driven technology that enhances gaming performance and image quality. However, the RTX 4090 might benefit from DLSS improvements due to its newer architecture, potentially offering better results.
Also Learn: In-depth MSI GeForce RTX 3090 Review
RTX 4090 Vs. RTX 3090 Gaming Benchmarks
The GeForce RTX 4090 clearly outpaces its predecessor, the RTX 3090, in terms of performance and capabilities. Let’s dive into a detailed analysis of their gaming benchmarks to quantify the extent of this upgrade.
The following rig is used in the gaming benchmarks:
- CPU: Core i9 13900K
- Operating System: Windows 11
- Motherboard: ASUS TUF Gaming Z690-Plus
- RAM: G.Skill Trident Z5 RGB 32GB DDR5-6600 CL34
- SSD: Sabrent Rocket 4 Plus 1TB NVMe SSD
- Cooler: Xigmatek Aurora 360mm Cooler
- Power Supply: ENERMAX REVOLUTION D.F. X 1050W
Forza Horizon 5
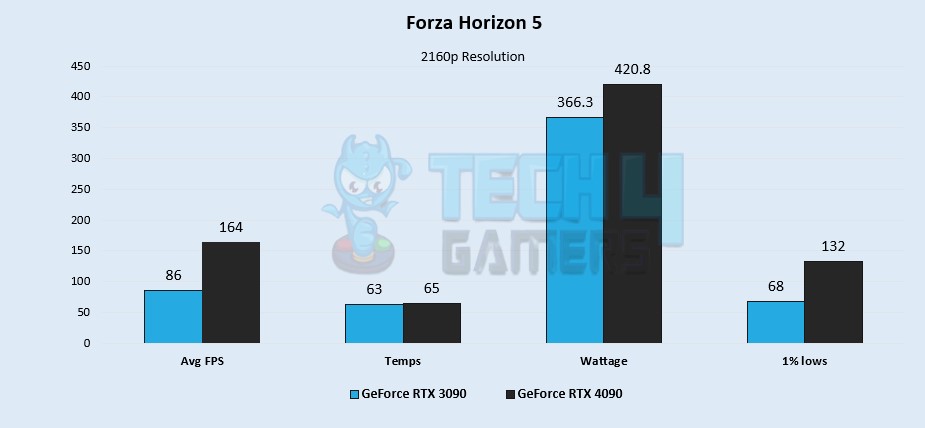
- The RTX 4090 outperforms the RTX 3090 by an impressive 62.4% in FPS, averaging 164 FPS in Forza Horizon 5 compared to the RTX 3090’s 86 FPS.
- Thermal efficiency remains similar in my testings, with the RTX 4090 at 65°C and the RTX 3090 at 63°C, a negligible 3.1% difference.
- The RTX 4090 consumes approximately 13.8% more power than the RTX 3090, with a 420.8W power draw compared to the RTX 3090’s 366.3W at 98% usage.
- Even with 1% low performance, the RTX 4090 maintains a 64% lead, dropping to 132 FPS, while the RTX 3090 dips to 68 FPS.
Learn More: RTX 4090 Vs RTX 3090 Ti
Watch Dogs: Legion
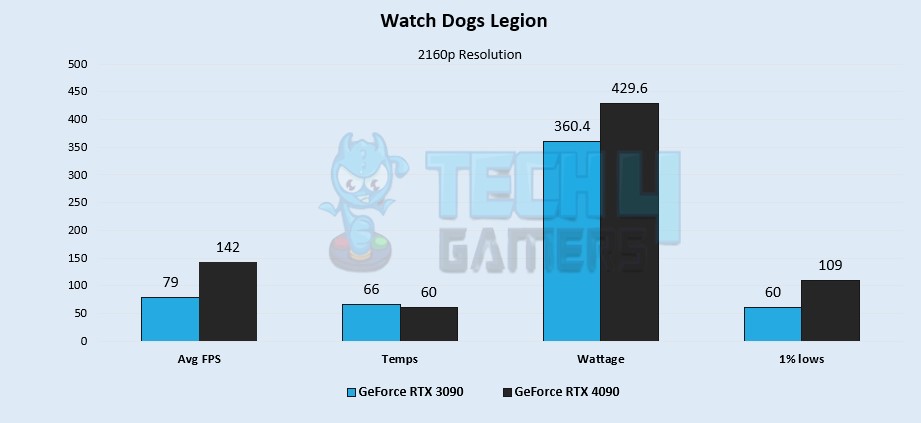
- While I was testing this AAA title, the RTX 4090 continued to dominate, averaging 142 FPS in the game, leaving the RTX 3090 far behind at 79 FPS, a remarkable 57% lead in favor of the RTX 4090.
- Surprisingly, the RTX 4090 runs cooler than the RTX 3090 during Watch Dogs: Legion, with temperatures of 60°C compared to the RTX 3090’s 66°C. This 9.5% temperature advantage highlights the thermal efficiency of the Ada Lovelace microarchitecture.
- As expected, the power consumption aligns with the GPUs’ TDP. The RTX 4090 consumes 429.6W, while the RTX 3090 draws approximately 17.5% less power at 360.4W due to the RTX 4090’s higher TDP.
- The performance gap widens to 57.9% in 1% lows, with the RTX 4090 achieving 109 FPS and the RTX 3090 only managing 60 FPS.
Also Check: RTX 4070 Ti Vs RTX 3090
Shadow Of The Tomb Raider
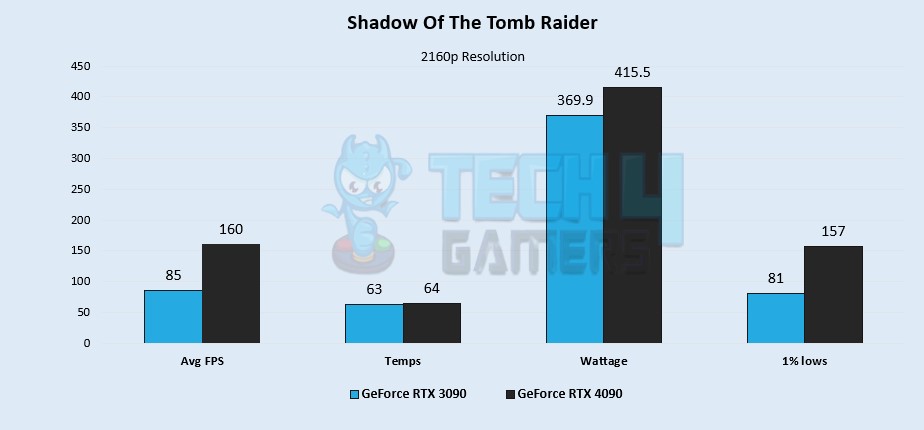
- Again, my test showed the RTX 4090 continues its dominance, delivering an average of 160 FPS in the game, leaving the RTX 3090 lagging behind at 85 FPS, a significant 61.2% performance advantage for the RTX 4090.
- Despite its outstanding performance, the RTX 4090 maintains a slight edge in thermal efficiency, running just 1.5% hotter than the RTX 3090 in Shadow of the Tomb Raider, with temperatures of 64°C and 63°C, respectively.
- Even with a 96% usage rate, the RTX 4090 falls below its 450W TDP at 415.5W. In contrast, the RTX 3090 exceeds its 350W TDP at 369.9W with 97% usage, leading to the RTX 4090 consuming approximately 11.6% more power.
- The performance disparity extends to 1% lows, with the RTX 4090 achieving an impressive 157 FPS, while the RTX 3090 lags at 81 FPS, resulting in a remarkable 63.8% difference.
Red Dead Redemption 2
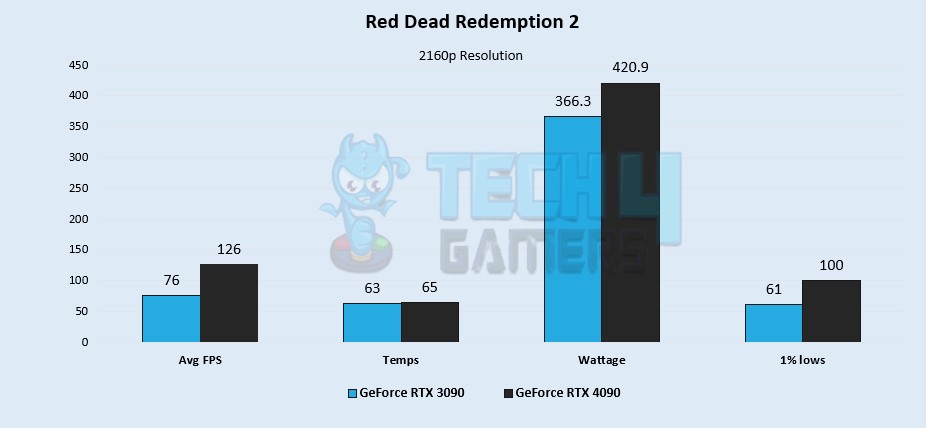
- My Red Dead Redemption 2 benchmark shows a performance gap between the RTX 4090 and RTX 3090, but the RTX 4090 maintains a notable 49.5% advantage. It achieves an average of 126 FPS, surpassing the RTX 3090’s 76 FPS.
- The temperature difference remains marginal, with the RTX 4090 at 65°C and the RTX 3090 slightly cooler at 63°C, representing a mere 3.1% variation.
- Power consumption aligns with expectations, with the RTX 4090 consuming 420.9W and the RTX 3090 using 366.3W. The RTX 4090, despite its higher performance, consumes approximately 13.8% more power but remains within its TDP.
- In 1% lows, the trend continues, with the RTX 4090 experiencing drops to approximately 100 FPS, while the RTX 3090 lags at around 61 FPS, resulting in a 48.4% lead for the RTX 4090.
Learn More: RTX 3080 Vs RTX 3090
Horizon Zero Dawn
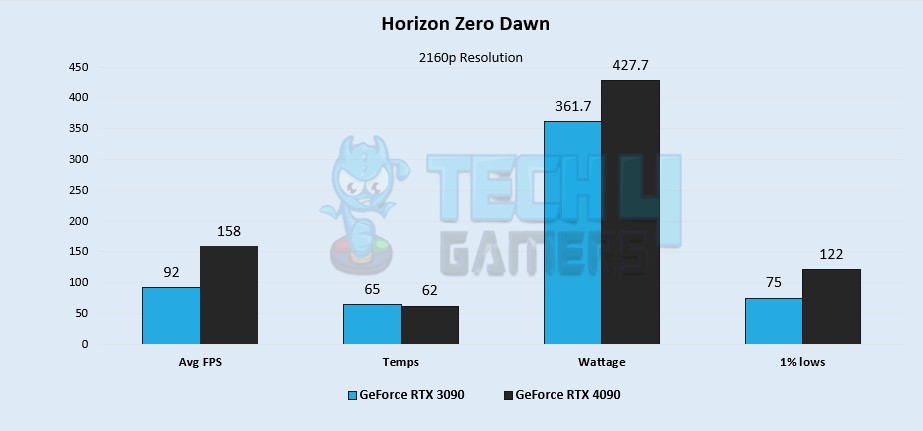
- In this test, the RTX 4090 delivers as expected, with a remarkable 52.8% better average FPS. The RTX 4090 boasts an impressive 158 FPS on average, while the RTX 3090 struggles to break the 100 FPS barrier, running at 92 FPS.
- In Horizon Zero Dawn, the RTX 4090 demonstrates superior thermal efficiency, running at 62°C, while the RTX 3090 operates at 65°C. Although the 4.7% temperature difference may seem modest, it underscores the RTX 4090’s excellent thermal performance.
- Similar to before, my testing revealed the power-hungry RTX 4090 drew 427.7W of power during Horizon Zero Dawn, marking a 16.7% increase compared to the RTX 3090’s 361.7W power consumption.
- The 1% lows mirror the same trend, with the RTX 4090 dropping only to 122 FPS, while the RTX 3090 lags behind by about 47.7%, reaching 75 FPS.
Also Read: RTX 4070 Vs RTX 3090
Hitman 3
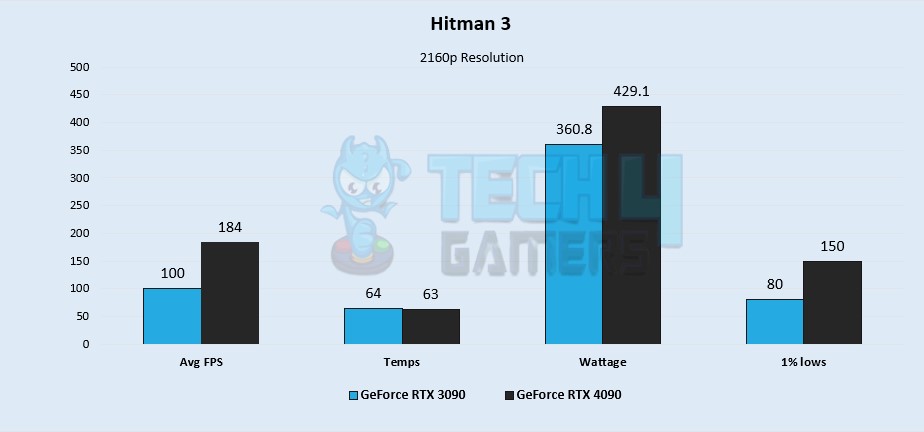
- As observed throughout my analysis, the RTX 4090 continues to dominate its predecessor. In Hitman 3, the RTX 4090 delivers an impressive 59.1% lead in average FPS, running the game at 184 FPS compared to the RTX 3090’s 100 FPS.
- The difference in thermals remains minimal, with a mere 1°C distinction; the RTX 4090 runs at 63°C, and the RTX 3090 at 64°C.
- In terms of power consumption, the RTX 4090 consumes approximately 17.2% more power at 429.1W, while the RTX 3090 draws around 360.8W, in line with expectations.
- In my benchmarking, the performance gap widens in the 1% lows, with the RTX 4090 dropping to 150 FPS and the RTX 3090 lagging behind by approximately 60.8%, reaching only 80 FPS.
Aslo Check: RTX 4080 Vs RTX 3090
Far Cry 6

- In Far Cry 6, the RTX 4090 delivers an average FPS of 165, while the RTX 3090 struggles to reach triple digits, with an average of 103 FPS. The performance gap exceeds 46.2%, marking the lowest margin we’ve encountered in my analysis.
- Similar to Hitman 3, the thermal performance in Far Cry 6 is almost identical, with a slight 1°C difference. The RTX 4090 operates at 63°C, while the RTX 3090 runs at 64°C.
- Regarding power consumption, the RTX 4090, with its recommended 850W PSU, consumes around 421.3W, which is approximately 14% more power than the RTX 3090, drawing 365.9W, in alignment with expectations.
- The 1% lows reveal a 41.9% difference, with the RTX 4090 dropping to 124 FPS and the RTX 3090 plummeting to as low as 81 FPS, again, the lowest margin we’ve observed so far, just like the average FPS.
Also Read: RTX 4090 Vs RX 6900 XT
Dying Light 2

- Throughout my test of Dying Light 2, the RTX 4090 maintained an average of 104 FPS at 4k, outshining its predecessor, the RTX 3090, which only reached 60 FPS. This translates to a substantial 53.6% difference in FPS, securing another substantial win for the RTX 4090.
- In terms of temperatures, the RTX 3090 consistently ran a degree hotter at 64°C compared to the RTX 4090, which maintained a temperature of 63°C, despite delivering significantly superior average FPS.
- The most significant power consumption difference encountered was in Dying Light, with a substantial 19.8% gap. The RTX 3090 drew around 356.7W, while the RTX 4090 exhibited higher power consumption, consuming a substantial 435.1W.
- In the 1% lows, the RTX 3090 dipped below by 52.1%, down to about 51 FPS. Meanwhile, the RTX 4090 demonstrated notably better performance, with a drop to 87 FPS.
Also Check: RTX 4080 vs RTX 4090
Cyberpunk 2077
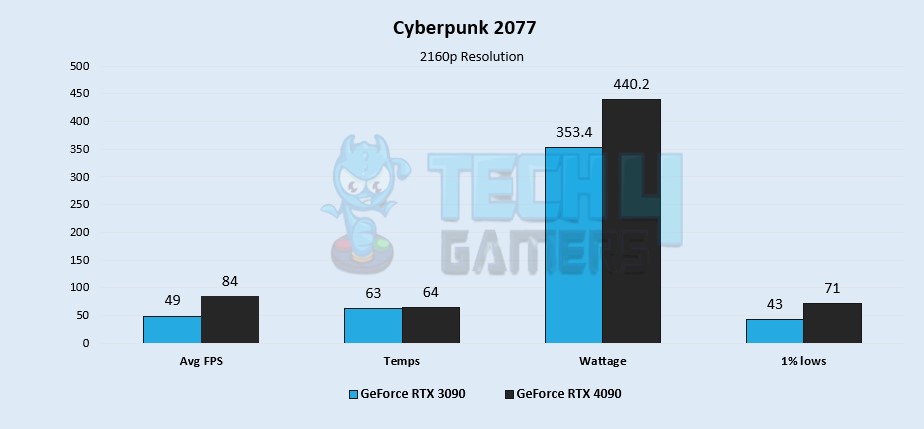
- Running Cyberpunk 2077 at 4K, the RTX 4090 maintains a smooth performance with an average of 84 FPS, while the RTX 3090 falls significantly behind with only 49 average FPS, marking a substantial 52.6% performance advantage for the RTX 4090.
- Despite the minor temperature variation in Cyberpunk 2077, both GPUs maintain a similar level of thermal efficiency. The RTX 4090 runs at 64°C, just one degree hotter than the RTX 3090’s 63°C.
- In this title, the power consumption gap widened further during my tests, with the RTX 4090 drawing 440.2W and the RTX 3090 displaying greater power efficiency, consuming approximately 21.8% less power at 353.4W.
- In the 1% lows, the RTX 4090 impressively records 71 FPS, which is still approximately 49.1% higher than the RTX 3090’s 43 FPS.
Also Read: RTX 4090 Vs RTX 3090 Ti
Assassin’s Creed Valhalla
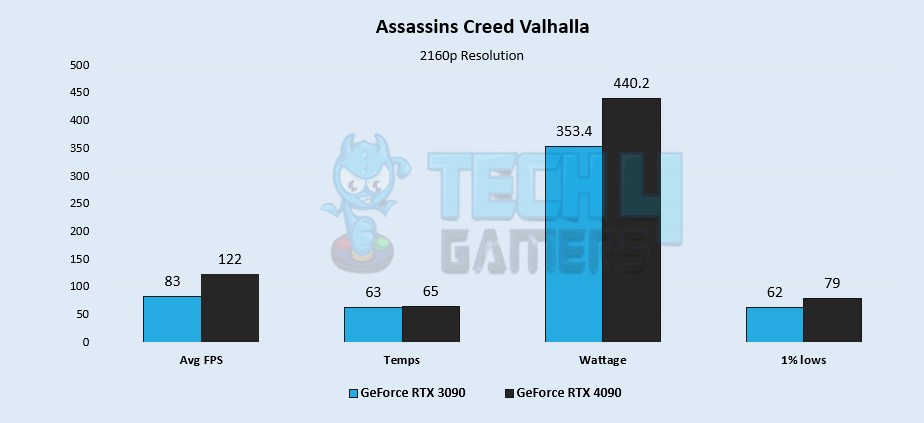
- Running Far Cry 6, the RTX 4090 consistently delivers a strong performance with an average of 122 FPS. In comparison, the RTX 3090 lags behind at 83 average FPS, marking a notable 38% performance advantage for the RTX 4090.
- Similar to what I observed before, there is minimal difference in thermal performance. The RTX 4090 runs at approximately 65°C, which is only around 3.1% hotter than the RTX 3090’s temperature of 63°C, making the difference virtually negligible.
- Interestingly, the power consumption remains consistent with the figures seen in Cyberpunk 2077. The RTX 3090 draws 353.4W, while the RTX 4090 consumes approximately 21.8% more power at 440.2W.
- The performance gap between the two GPUs diminishes even further in the 1% lows. The RTX 4090 experiences a slight dip to 79 FPS, while the RTX 3090 drops to 62 FPS, resulting in an overall 49.1% improvement in favor of the RTX 4090.
Also Check: RTX 4090 Vs RTX 3080 Ti
Overall Gaming Performance
- After evaluating the benchmark performance of 10 games at 4K resolution, it’s evident that the GeForce RTX 4090 stands in a league of its own with an impressive average of 140.9 FPS.
- The RTX 4090 started with a substantial lead, which is remarkable considering it was pitted against the formidable RTX 3090, which achieves an average of approximately 81.3 FPS.
- When taking an average of all the gaming benchmarks that I analyzed, the RTX 4090 outperformed the RTX 3090 at 4K resolution, boasting well over a 53.6% increase in FPS, showcasing its remarkable gaming capabilities.
Average Power Consumption
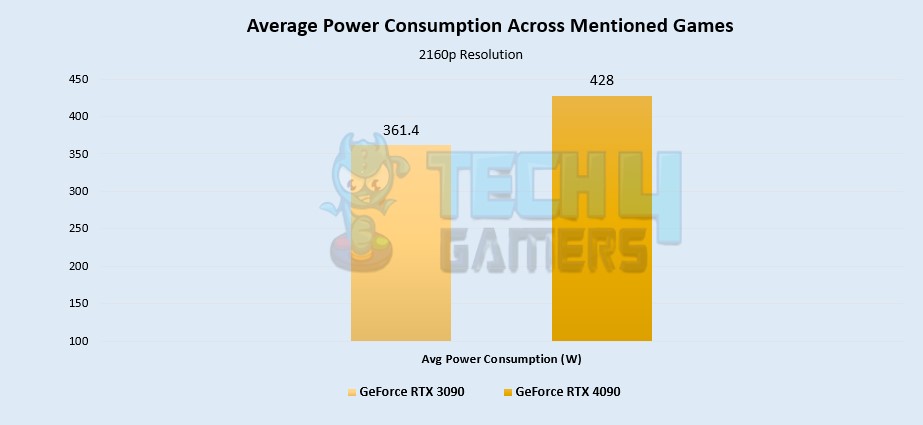
- As expected, the RTX 4090 is a power-hungry powerhouse, consuming an average of approximately 16.8% more power compared to the RTX 3090.
- The RTX 4090 during my tests, exhibited an average power consumption of 428W, while the RTX 3090 drew an average of 361.4W.
- It’s crucial to note that the RTX 4090’s substantial power requirements emphasize the necessity of utilizing a power supply unit (PSU) that meets or exceeds its recommended wattage. Failing to do so could potentially pose risks.
Average Thermal Statistics
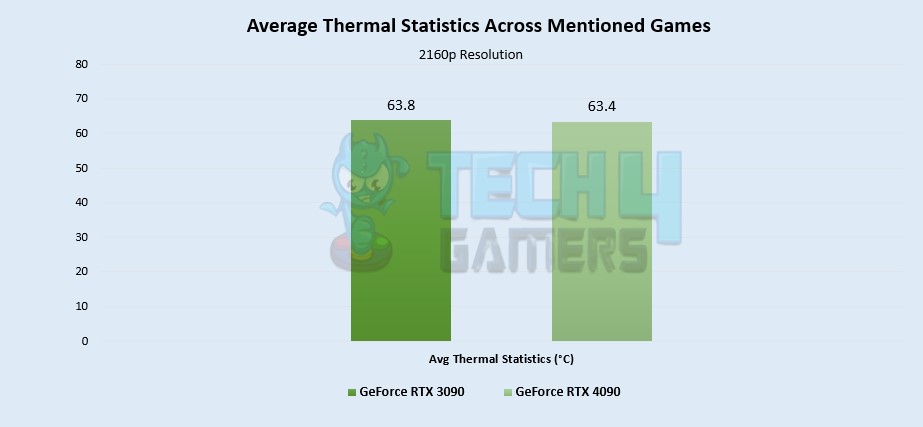
- The colossal size of the RTX 4090 becomes justified when discussing its thermal efficiency, thanks to its substantial cooler.
- Remarkably, in each of the 8 games subjected to my testing, the RTX 4090 exhibited slightly superior thermal performance, measuring around 0.6% cooler than the RTX 3090.
- During these tests, the RTX 4090 maintained an operating temperature of approximately 63.4°C, while the RTX 3090 operated at 63.8°C.
Price And Availability
- Currently, during my research, I found that the RTX 3090 is priced at approximately 1200 USD when looking at platforms such as Newegg. In comparison, the RTX 4090 is set at an MSRP of 1599 USD.
- This creates a notable price gap of roughly 28.5% between the two graphics cards.
RTX 4090 Vs. RTX 3090: Which One Would I Recommend?
- From my first-hand experience, I confidently recommend the RTX 4090 for gamers seeking unparalleled performance. It delivers an outstanding 53.6% increase in FPS compared to the RTX 3090, making it the top choice for 4K gaming.
- While it does have a slightly higher power consumption of around 16.8% more than the RTX 3090, the RTX 4090 maintains commendable thermal performance. I’ve noticed that it runs only 0.6% cooler than its predecessor in various gaming scenarios.
- Consider the price gap of roughly 28.5% between the two graphics cards. If you’re looking for a gaming powerhouse and are willing to invest in a premium GPU, the RTX 4090 stands as a compelling choice.
Pros And Cons
| GPU | Pros | Cons |
| GeForce RTX 4090 |
|
|
| GeForce RTX 3090 |
|
|
Thank you! Please share your positive feedback. 🔋
How could we improve this post? Please Help us. 😔
[Comparisons Specialist]
I’m a passionate computer hardware expert specializing in CPUs and GPUs. With a lifelong curiosity for hardware and extensive hands-on experience, I provide valuable insights, practical advice, and in-depth analysis on these components. Engaging with the hardware community, I exchange knowledge and stay at the forefront of technological advancements.
Get In Touch: uzair@tech4gamers.com


Feedback By: