


Previously, we put the RTX 4080 against the RTX 4070 to learn about the performance differences between the two. In this comparison, we will compare the previous generation namely, the RTX 3080 vs RTX 3090, highlighting the performance difference of these cards.
Key Takeaways
- We know that the RTX 3080 is a high-performing graphics card, but upon testing, the RTX 3090 took the lead by offering a significant FPS boost of 11.9%.
- We noticed that the RTX 3080 is more power efficient than the RTX 309 as it drew 15.4% less power than its rival.
- Upon our observation, we found that the RTX 3080 shows us that it is the RTX 3090, generating less heat by 8.2%.
Comparison Table
| Technical Specs | GeForce RTX 3080 | GeForce RTX 3090 |
|---|---|---|
| Architecture | Ampere | Ada Lovelace |
| CUDA Cores | 8704 | 10496 |
| RT Cores | 68 | 82 |
| Release Date | Sep 1st, 2020 | Nov 16th, 2022 |
| Approximated Price | 699 USD | 1,199 USD |
| Best Variants | BEST RTX 3080 | BEST RTX 3090 |
Architectural Difference
- Process Node: Both these cards are based on Intel’s 8nm manufacturing process node.
- Clock Speed: The RTX 3080 has a base clock of 1440 MHz that can be boosted up to 1710 MHz. In contrast, the RTX 3090’s base clock starts from 2205 MHz which can be ramped up to a whopping 2505 MHz.
- VRAM: With regards to memory, the RTX 3080 comes with 10GB GDDR6X, while the RTX 3090 comes with a higher memory of 16GB GDDR6X.
- Bus Width & Memory Bandwidth: The 320-bit bus-based RTX 3080 arrives with a memory bandwidth of 760.3 GB/s while the 384-bit bus-based RTX 3090 comes with 936.2 GB/s.
- TDP: The RTX 3080 has a rating of 320W whereas the RTX 3090’s TDP is 350W. This makes a 700W PSU a recommendable option for both cards.
- Supported Technologies: Both cards employ DLSS (Deep Learning Super Sampling) technology which improves the framerates especially when ray tracing is enabled. However, RTX 3090 performs slightly better when DLSS is enabled.
RTX 3080 Vs RTX 3090: Gaming Benchmarks
After analyzing the specifications of the RTX 3080 and RTX 3090, it is now time for us to proceed with the next phase of the comparison. Now, we’ll put the two cards side by side to see how well they perform in games on 4K.
Testing Rig
- CPU: AMD Ryzen 7700X
- Motherboard: Asus ROG Strix X670E-a
- Memory: Corsair Vengeance 32GB DDR5 6000 CL36
- Storage Drive: XPG Gammix S70 Blade 2TB NVMe
- Power Supply: be quiet! Dark Power Pro 13 1300W
- CPU Cooler: Corsair H150i Elite
Note: It’s essential to note that various external factors, such as temperature, background software, and airflow may influence the benchmark tests, affecting the final results. Therefore, consider the findings as close estimations rather than accurate metrics.
Outriders

- According to our observation, the RTX 3090 outperforms the RTX 3080 in terms of average FPS, with a significant 12.9% improvement, achieving an impressive 74 FPS compared to 65 FPS.
- Additionally, the RTX 3090 showed us its capabilities in 1% lows as it outshines the RTX 3080, with a 20.6% lead and 64 FPS compared to 52 FPS.
Assassin’s Creed Valhalla
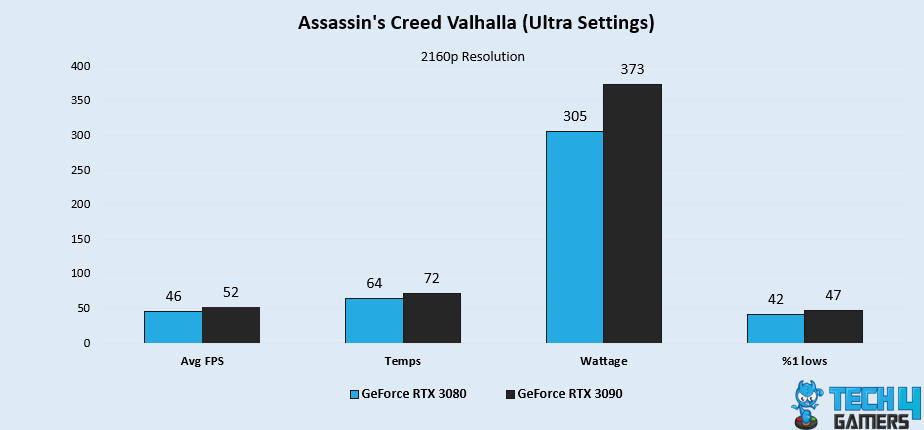
- With a decent 52 FPS compared to the RTX 3080’s 46 FPS, the RTX 3090 surpasses in terms of average FPS, giving us a 12.2% increase.
- Furthermore, the RTX 3090 outperforms the RTX 3080 in terms of 1% lows, with an 11.2% difference and 47 FPS versus 42 FPS.
Dirt 5
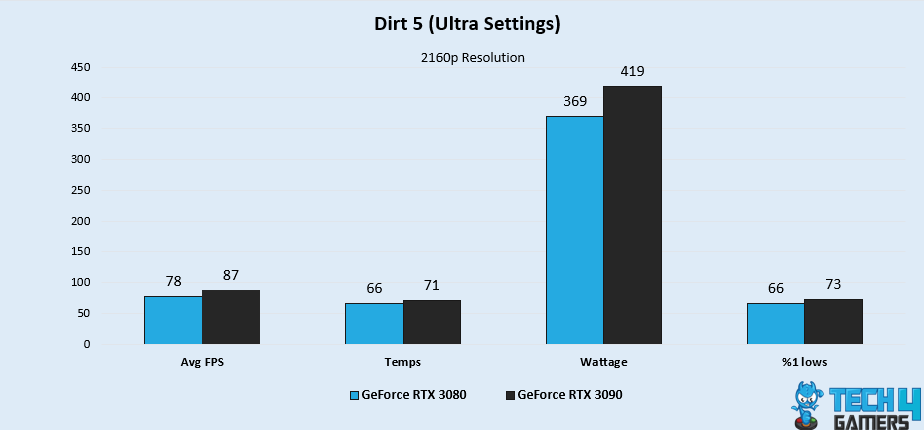
- The RTX 3090 is the superior graphics card when it comes to average FPS, with an impressive 87 FPS compared to the RTX 3080’s 78 FPS, showing us a 10.9% increase.
- When it comes to 1% lows, the RTX 3090 shows us its dominance over the RTX 3080, with a 10% difference and 73 FPS compared to 66 FPS.
Red Dead Redemption 2
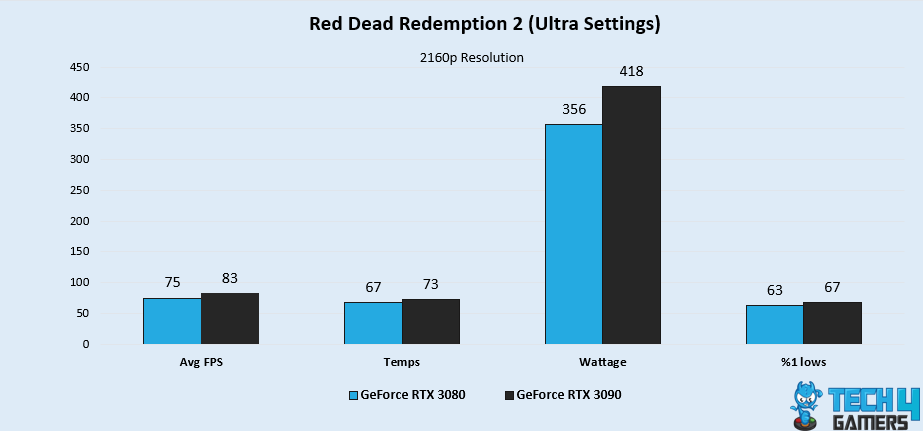
- The RTX 3090’s remarkable performance is evident with its 83 FPS average FPS, which is 10.1% higher than the RTX 3080’s 75 FPS.
- Our observation reveals that the RTX 3090 exhibits superior 1% lows compared to the RTX 3080, with a 6.1% lead and 67 FPS versus 63 FPS.
Cyberpunk 2077
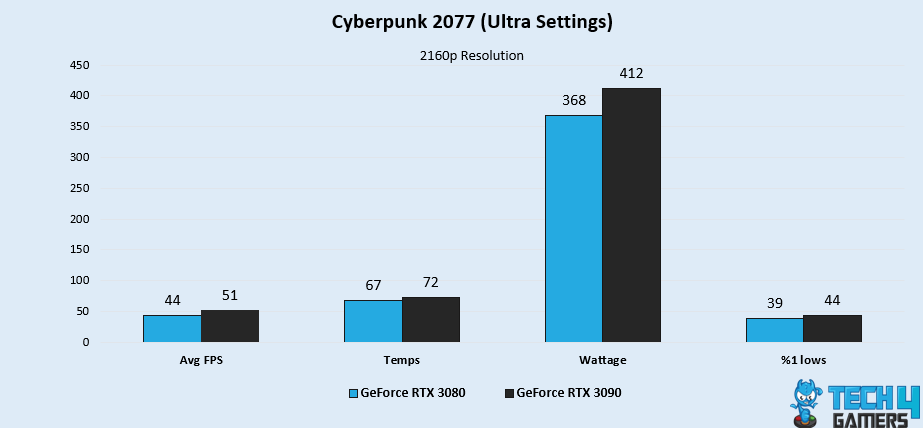
- When looking at the average FPS, the RTX 3090 demonstrates its superiority over the RTX 3080, achieving 51 FPS compared to 44 FPS, displaying a 14.7% improvement.
- Moving on to 1% lows, the RTX 3090 proves us that it is the better performer, surpassing the RTX 3080 with a 12% difference and 44 FPS compared to 39 FPS.
Days Gone
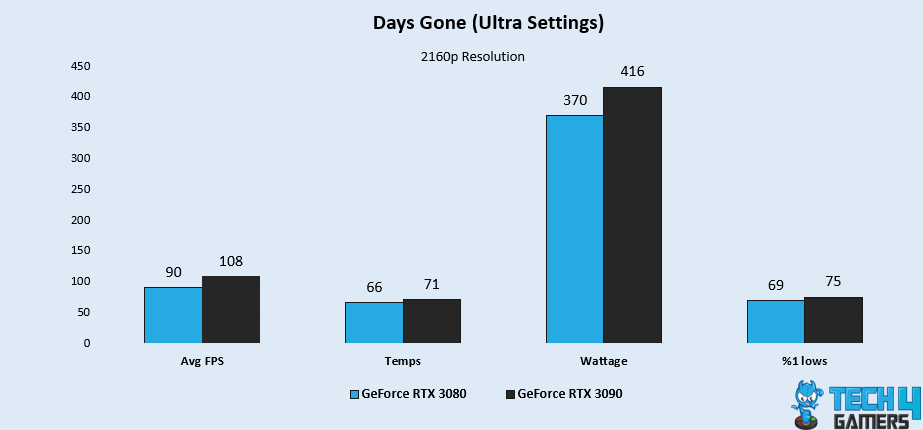
- While the RTX 3080 manages an average FPS of 90, the RTX 3090 surpasses it with a remarkable 108 FPS, presenting yet another improvement this time of 18.1%.
- In terms of 1% lows, the RTX 3090 outperforms the RTX 3080 with a significant 8.3% difference, producing 75 FPS versus the latter’s 69 FPS.
RTX 3090 Vs RTX 3080: Overall Gaming Performance
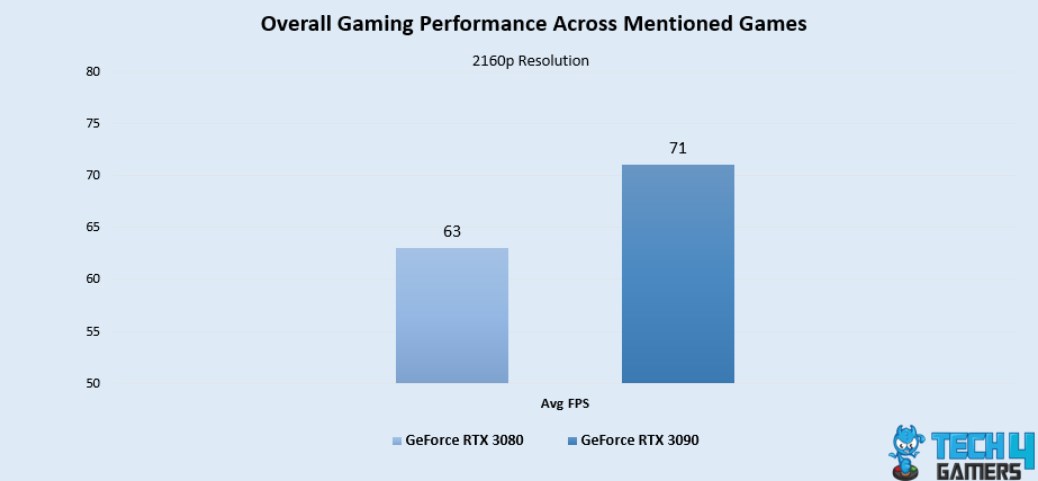
Based on our analysis, it’s clear that the RTX 3090 outperforms the RTX 3080 in all tested games, by achieving an average FPS of 71 FPS versus 63 FPS respectively. This equates to a significant increase of 11.9% FPS on average.
Power Consumption
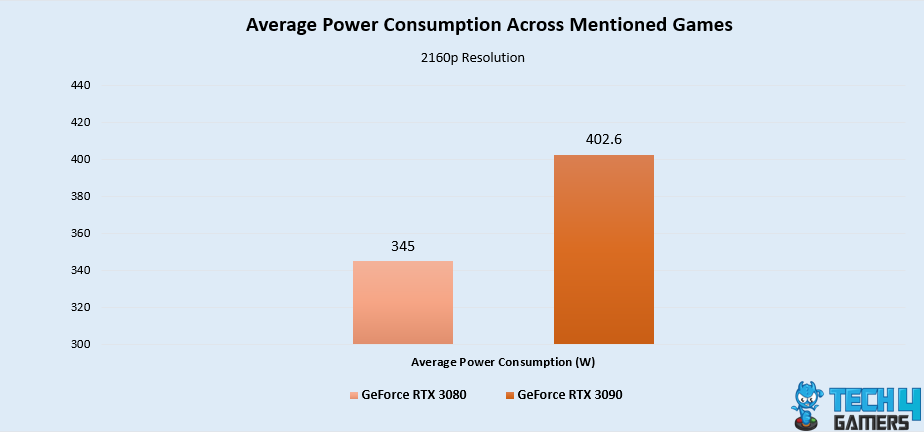
According to our calculations, the RTX 3080 is more power-efficient compared to the RTX 3090, consuming an average of 345W versus 402.6W respectively, giving the RTX 3080 a 15.4% better power efficiency.
Thermal Statistics
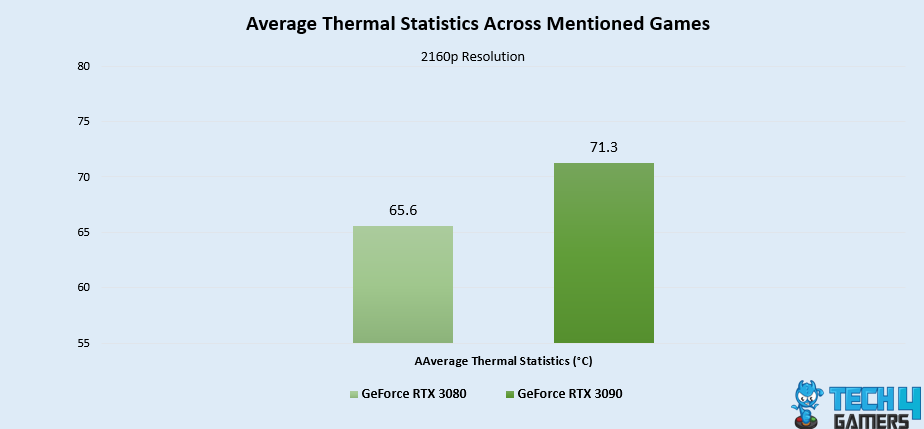
We observed that the RTX 3090 tends to run hotter with an average temperature of 71.3°C, while the RTX 3080 maintained a significantly cooler temperature of 65.6°C, indicating a difference of 8.2%.
Pricing And Availability
Nowadays, the RTX 3080 costs around $699-799, whereas the RTX 3090 arrives at a much higher price range of $1599-1699, depending on the model and variations. Despite this, the RTX 3080 is still around 50% cheaper than the RTX 3090, making it an extremely budget-friendly option.
RTX 3080 Vs RTX 3090: Which One Do We Recommend?
RTX 3080: The RTX 3080 holds its ground as a more affordable option all the while performing almost just as well as the RTX 3090, with only a difference of a few FPS which won’t interfere while playing any game while being more energy-efficient and producing less heat.
Ultimately, the choice you make between either of the card should align with your requirements and budget so you have a satisfactory experience.
Pros And Cons
| GPU | Pros | Cons |
|---|---|---|
| RTX 3080 | Affordable. Supports latest gen RayTracing. improved DLSS. | Noisy when under load. VRAM may not suffice. for long-term 4K usage. |
| RTX 3090 | Impressive gaming performance. Enhanced content creation. | Offers comparable performance. High price point. |
More From RTX 3080
More From RTX 3090
Thank you! Please share your positive feedback. 🔋
How could we improve this post? Please Help us. 😔
[Comparisons Expert]
Abdemanaf is a skilled creative writer who has been honing his craft since 2011. While initially working in different fields, he found a passion for technology and has been exploring the tech world since early 2015. Over the years, he has developed an in-depth knowledge of the latest tech trends and product offerings by various companies.
Abdemanaf’s writing reflects his analytical mindset and ability to think critically. He has a knack for breaking down complex technical information into easily digestible pieces, making his articles engaging and accessible to readers from all backgrounds. In February 2022, he joined Tech4Gamers as a blog and product comparison writer, where he has been able to hone his skills further.
As a writer, Abdemanaf is dedicated to staying up-to-date with the latest technological advancements and trends, enabling him to provide readers with the most relevant and accurate information. He is always eager to learn more and is constantly seeking new challenges to improve his skills.
Get In Touch: manaf@tech4gamers.com


