 Threads

In the ever-evolving landscape of high-performance processors, the clash between the Core i9 13900K vs M2 Max is nothing short of remarkable. As we delve into this intriguing face-off, we will explore the intricate details of their specifications and dive into comprehensive performance benchmarks, shedding light on how these two powerhouses stack up against each other.
Key Takeaways
- Starting off, the Core i9 13900K excels in benchmarks, making it the top choice for robust single-core and multi-core tasks, setting a new standard, including 15.9% and 73.2% lead in single and multi-core scores on average, respectively, processing power.
- With a lower 30W TDP compared to the Core i9 13900K’s 125W, the M2 Max offers commendable performance while prioritizing energy-conscious users’ needs.
- Moreover, the Core i9 13900K supports up to 128GB DDR5-5600 and DDR4-3200 memory, while the M2 Max impressively handles up to 96GB LPDDR5-6400, catering to diverse memory demands.
- Finally, the Core i9 13900K’s ECC memory support ensures robust error correction, enhancing reliability in critical tasks, a feature absent in the M2 Max.
Comparison Table
| Key Specifications | M2 Max | Core i9 13900K |
|---|---|---|
| Vendor | Apple | Intel |
| Release Date | January 17, 2023 | September 27, 2022 |
| Device Type | Laptop | Desktop |
| Instruction Set | ARMv8 | x86-64 |
| Integrated GPU | Apple M2 Max GPU (38-core) | UHD Graphics 770 |
| Performance Cores | 8 | 8 |
| Performance Threads | 8 | 16 |
| Base Clock | 2.4 GHz | 3.0 GHz |
| Boost Clock | 3.5 GHz | 5.4 GHz |
| Total Cores | 12 | 24 |
| Total Threads | 12 | 32 |
| L1 Cache | 192K (per core) | 80K (per core) |
| L2 Cache | 32MB (shared) | 2MB (per core) |
| Transistors | 67 billion | 1.42 billion |
| Fabrication Process | 5nm | 10nm |
| TDP (PL1) | 30W | 125W |
| Socket | Apple M-Socket | LGA-1700 |
| GPU Base Clock | 450 MHz | 300 MHz |
| GPU Boost Clock | 1398 MHz | 1650 MHz |
| Cuda Cores | 4864 | 256 |
| Display Capabilities | 7680×4320 – 60 Hz | – |
| Memory Support | Up to 96GB LPDDR5-6400 | Up to 128GB
– DDR5-5600, |
| ECC Support | No | Yes |
| Max. Memory Bandwidth | 409.6 GB/s | 89.6 GB/s |
Core i9 13900K Vs M2 Max: Architectural Differences
While both the Intel Core i9 13900K and Apple M2 Max are poised to redefine high-performance computing, a closer examination of their architectural nuances reveals intriguing disparities that can significantly influence their real-world capabilities.
- Process Node: Showcasing technological advancements, the M2 Max harnesses the efficiency of a 5nm process node, while the Core i9 13900K relies on a 10nm process node for its performance.
- Clock Speed: Moreover, the M2 Max pursues its tasks with a Base Clock of 2.4 GHz and a Boost Clock of 3.5 GHz, contrasting the Core i9 13900K’s vigor with a Base Clock of 3.0 GHz and a remarkable Boost Clock of 5.4 GHz.
- Memory Support Variation: In the realm of memory, the M2 Max’s support extends to an impressive 96GB of LPDDR5-6400, while the Core i9 13900K lays claim to a broader spectrum, accommodating up to 128GB of DDR5-5600 and DDR4-3200.
- TDP: Furthermore, the M2 Max maintains its equilibrium with a power-efficient 30W TDP, whereas the Core i9 13900K commands a more robust 125W TDP, reflecting a divergence in performance and energy consumption.
- Supported Technologies: While the Core i9 13900K integrates the advantages of ECC memory support, the M2 Max lacks this technology, a factor that can influence their roles in critical computing applications.
Performance Benchmarks
Now that we’ve dissected the architectural distinctions, it’s time to embark on a journey through comprehensive performance benchmarks. These tests will unveil how the Intel Core i9 13900K and Apple M2 Max navigate the intricate terrain of various benchmark software, providing a tangible glimpse into their prowess across a spectrum of computing tasks.
Cinebench R23 (Single-Core)
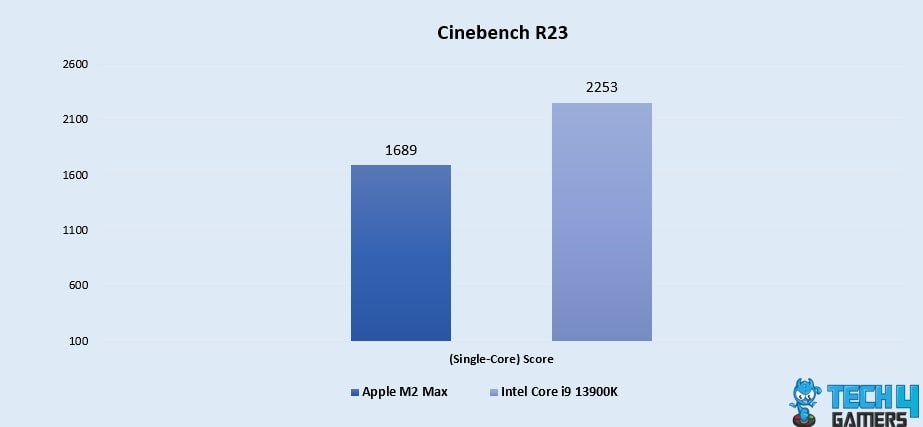
- The Core i9 13900K asserts its supremacy with a remarkable 28.6% lead, achieving a single-core score of 2253, while the M2 Max follows with a respectable score of 1689.
Cinebench R23 (Multi-Core)
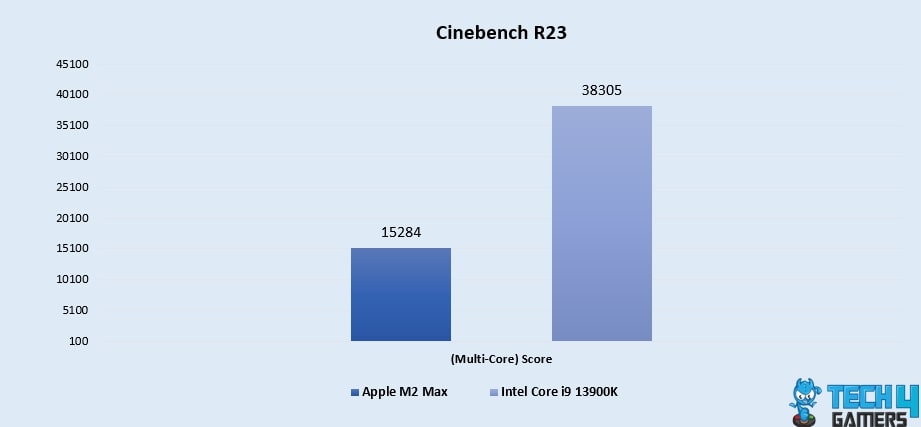
- In multi-core prowess, the Core i9 13900K dominates with a staggering 85.9% advantage, achieving an impressive score of 38305, while the M2 Max delivers a solid performance with a score of 15284.
Passmark CPU (Single-Core)
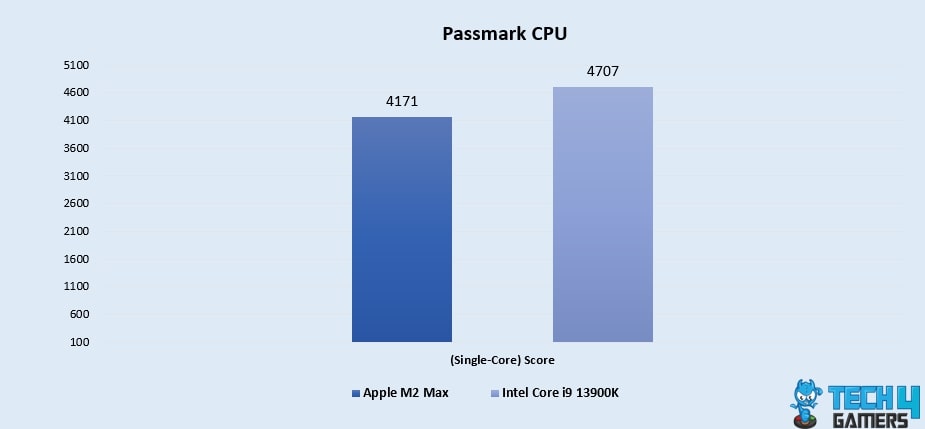
- Furthermore, the Core i9 13900K maintains its lead with a 12% difference, scoring 4707, while the M2 Max showcases its capabilities with a score of 4171 in the single-core Passmark CPU test.
Passmark CPU (Multi-Core)
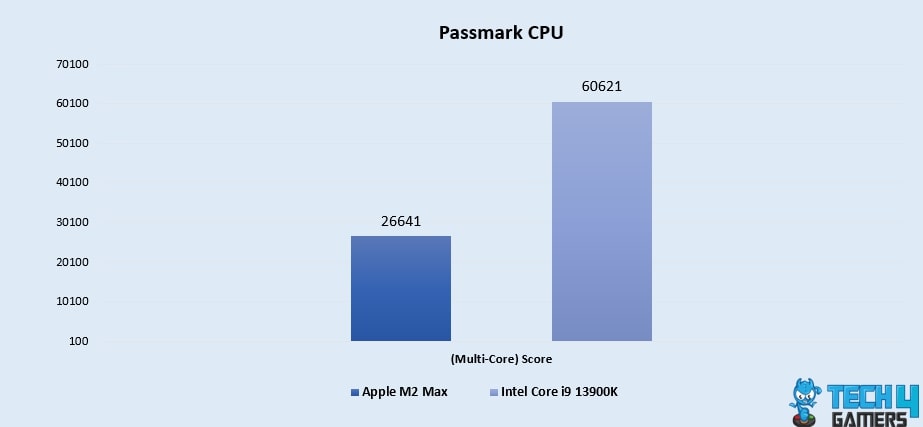
- In addition, when it comes to multi-core tests, the Core i9 13900K shines with a substantial 77.8% lead, achieving an impressive score of 60621, while the M2 Max demonstrates commendable performance with a score of 26641.
Geekbench 5 (Single-Core)
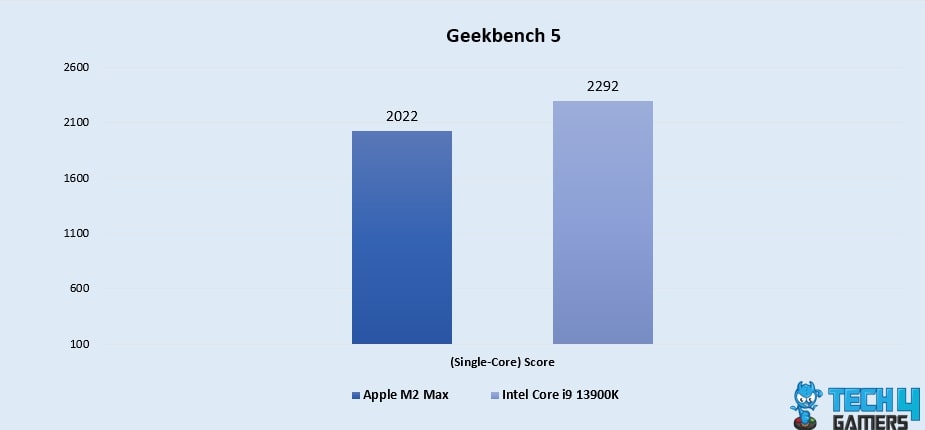
- Moreover, the Core i9 13900K continues its lead, surpassing the M2 Max by 12.5% with a single-core score of 2292, while the M2 Max attains a score of 2022.
Geekbench 5 (Multi-Core)
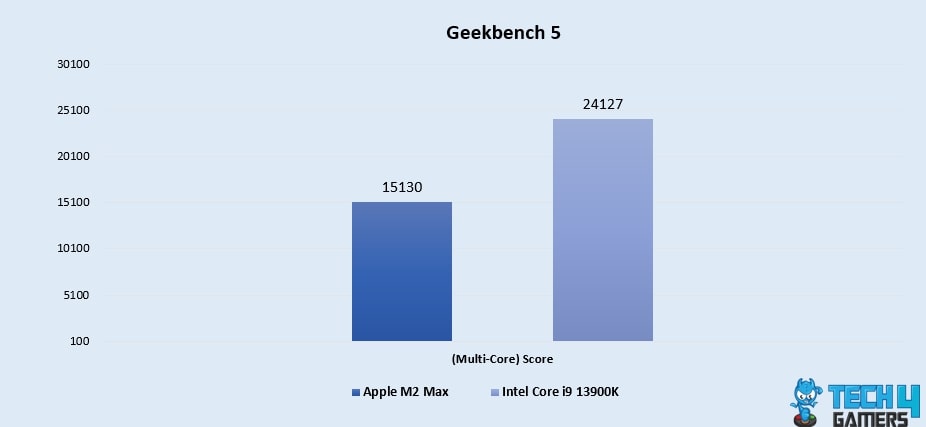
- The Core i9 13900K demonstrates its multi-core might with a 45.8% advantage, achieving a score of 24127, while the M2 Max delivers a competitive performance with a score of 15130 in the Geekbench 5 multi-core test.
M2 Max Vs Core i9 13900K: Which Chip Should You Pick?
- The Core i9 13900K emerges as a powerhouse, showcasing significant leads in multiple benchmarks, including by 15.9% and 73.2% in single and multi-core scores on average, respectively, making it an ideal choice for users who demand top-tier performance for both single-core and multi-core tasks.
- While the Core i9 13900K excels in performance, the M2 Max holds its own with an impressive balance of power and efficiency. With a lower TDP of 30W compared to the Core i9 13900K’s 125W, the M2 Max is well-suited for energy-conscious users seeking a versatile computing experience.
- The Core i9 13900K supports memory configurations of up to 128GB DDR5-5600 and DDR4-3200, while the M2 Max offers a notable memory capacity of up to 96GB LPDDR5-6400. Depending on your memory-intensive needs, both processors cater to a wide range of demanding applications.
- If error correction capabilities are paramount, the Core i9 13900K supports ECC memory, a feature absent in the M2 Max. For users requiring enhanced reliability and accuracy in critical computing tasks, the Core i9 13900K’s ECC support may tip the scale in its favor.
Thank you! Please share your positive feedback. 🔋
How could we improve this post? Please Help us. 😔
Feedback By:
[Comparisons Expert]
Shehryar Khan, a seasoned PC hardware expert, brings over five years of extensive experience and a deep passion for the world of technology. With a love for building PCs and a genuine enthusiasm for exploring the latest advancements in components, his expertise shines through his work and dedication towards this field. Currently, Shehryar is rocking a custom loop setup for his built.
Get In Touch: shehryar@tech4gamers.com


