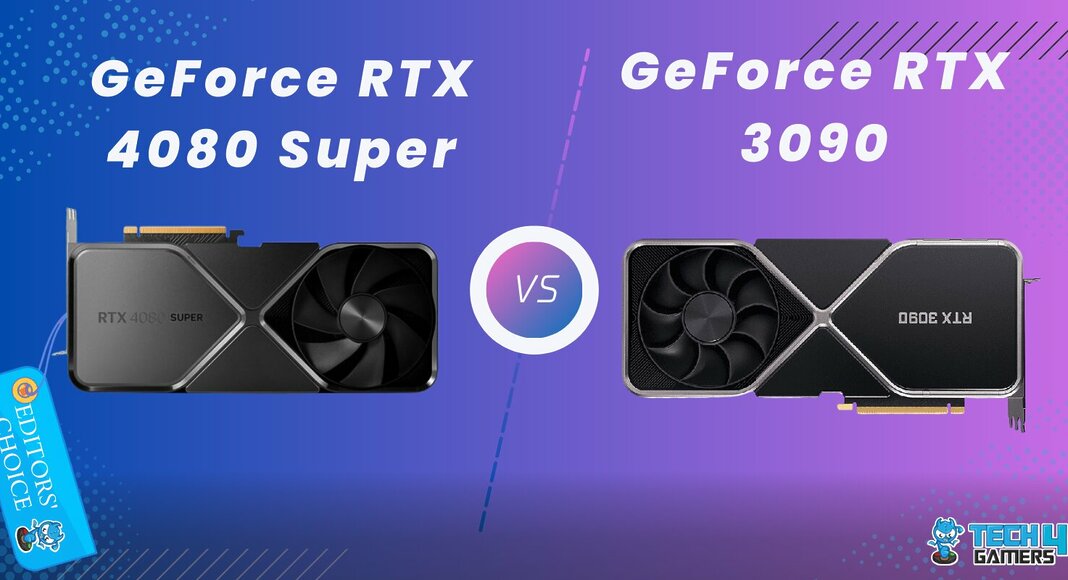
Nvidia GeForce RTX 4080 Super
Rated: 8/10
Nvidia GeForce RTX 3090
Rated: 5/10
Pros And Cons
| Graphics Card | Pros | Cons |
|---|---|---|
| RTX 4080 Super | ✅ Better Overall Performance ✅ Better power efficiency | ❌Smaller VRAM buffer |
| RTX 3090 | ✅ Larger VRAM buffer ✅256 additional rendering cores | ❌Very high price ❌Bad power efficiency |
- The performance testing we did at 4k showed the RTX 4080 Super to be about 33% faster than the RTX 3090 on average, which is a monumental improvement as the RTX 3090 was pretty fast already.
- The power consumption of the RTX 4080 Super was 23.5% less than the RTX 3090 despite cranking out significantly more performance. This equates to the power efficiency of the RTX 4080 Super being incredible.
- As of mid-February 2024, the RTX 3090 costs around 29% more than the RTX 4080 Super, which is abhorrent as it performs much more poorly.
- The RTX 4080 Super’s better performance and lower price make it a preferable choice for most users over the RTX 3090. Specific professional tasks that require a larger VRAM buffer may find some merit in the RTX 3090.
Comparison Table
| Feature | GeForce RTX 4080 Super | GeForce RTX 3090 |
|---|---|---|
| Architecture | Ada Lovelace | Ampere |
| Design Chip | AD103-400-A1 | GA102-300-A1 |
| Product Family | Nvidia GeForce RTX 40 series | Nvidia GeForce RTX 30 series |
| Steam Processors/Cuda Cores | 10240 | 10496 |
| Compute Units/Tensor Cores | 320 | 328 |
| Ray Accelerators | 80 | 82 |
| ROPs | 112 | 112 |
| Memory Bandwidth | 736.3 GB/s | 936.2 GB/s |
| Best Variants | Best RTX 4080 Super Graphics Cards | Best RTX 3090 Graphics Cards |
Architectural Differences
- Clock Speed: The RTX 4080 Super boasts higher clock speeds than the RTX 3090, with a base clock of 2295MHz compared to the RTX 3090’s 1395MHz and a boost clock of 2550MHz, exceeding the RTX 3090’s maximum clock of 1695MHz.
- VRAM: The RTX 3090 has a distinct advantage over the RTX 4080 Super in terms of VRAM, with a 24 gigabyte buffer instead of 16 gigabytes. Both use GDDR6X memory.
- Bus Width: The RTX 3090 uses a much wider 384-bit bus for its large VRAM buffer, whereas the RTX 4080 Super uses a more conventional 256-bit buffer.
- TDP: Surprisingly, the TDPs of both cards are pretty close, with the RTX 3090 rated for 350 watts, whereas the RTX 4080 Super is rated for 320 watts.
- Process Nodes: The RTX 4080 Super uses a more efficient 5nm processing node from TSMC, whereas the RTX 3090 uses an 8nm manufacturing process.
Before setting out to buy either of these cards, keep in mind that the RTX 3090 is a very chunky card. It takes up three of your expansion card slots and has a length of 13.2 inches. The RTX 4080 Super also occupies three slots, but it is an inch shorter, which can be a difference that might allow it to fit into your case.
– Abde Manaf
The RTX 40 series of cards have brought great power improvements over their last-gen counterparts, but they are still not generally liked because of their price-to-performance ratio. How does the card trying to rectify this compare to the most beastly card from last-gen? Keep reading the RTX 4080 Super vs RTX 3090 comparison to quench your curiosity!
Gaming Performance – 4k
To measure the performance difference between the RTX 4080 Super vs RTX 3090, we have devised a test bench that leaves only the graphics card as a possible bottleneck, allowing both cards to stretch their legs as much as possible. The specifications of this test bench are listed below:
Test Bench
- CPU – Core i9 13900K
- RAM – Corsair Dominator Platinum RGB 32GB DDR5 6000MHz RAM
- MOBO – Asus ROG Strix Z790 – E Gaming
- COOLER – CORSAIR ICUE H150I ELITE
- SSD – WD Black SN850 NVMe SSD
- PSU – ENERMAX REVOLUTION D.F. X 1050W
Hogwarts Legacy

- In Hogwarts Legacy at Ultra settings without RT and DLSS, the RTX 4080 Super averaged 70 FPS, surpassing the RTX 3090’s 60 FPS by almost 17%.
- The 1% lows were much closer, with the RTX 4080 Super putting out 52 FPS in its most stressful moments, while the RTX 4090 was 8% behind with minimums of 48 FPS.
Cyberpunk 2077

- In Cyberpunk 2077, with Quality DLSS and RT enabled, the RTX 4080 Super averaged 57 FPS, a 39% lead over the RTX 3090 Super’s 41 FPS.
- A 45% difference in 1% lows was observed in our testing of these cards in Cyberpunk, with the RTX 4080 Super staying closer to 45 FPS in hard-to-render moments, whereas the RTX 3090 had lows of 31 FPS.
Assassin’s Creed Mirage

- Running this game at native resolution with the Ultra settings enabled, the RTX 4080 Super had an average framerate of 98 FPS, while the RTX 3090 suffered a 32% loss with an average framerate of 74 FPS.
- The 1% lows of the RTX 4080 Super plateaued at 68 FPS in our testing, while the RTX 3090 was around 24% behind with lows of 54 FPS.
Forza Horizon 5

- With RT on at native quality, the RTX 4080 Super achieved 135 FPS, outperforming the RTX 3090 by 51%, which averaged 89 FPS.
- The difference was held at around 36% in terms of the 1% lows of this game, with the RTX 4080 Super lowering to 99 FPS, while the RTX 3090 had lows of 72 FPS.
Alan Wake 2

- With a render resolution of 1440p being upscaled to 4K using DLSS Q, the RTX 4080 Super maintained a 28% lead over the RTX 3090 in this game. It had a framerate of 60 FPS, while the RTX 3090 rendered the game at 46 FPS on average.
- The difference between the 1% lows of these cards was also stuck at 28%, with the RTX 4080 Super stuttering to 50 FPS in some scenes, while the RTX 3090 went down to 39 FPS as its minimum.
The Last Of Us Part 1

- The RTX 4080 Super maintained a healthy 27% lead in The Last Of Part 1 with no DLSS or RT, with an average framerate of 61 FPS, while the RTX 3090 hovered closer to 48 FPS as its average.
- The RTX 3090 performed poorly in terms of 1% lows, with a framerate of 34 FPS, while the RTX 4080 Super was 50% faster with lows of 51 FPS.
Red Dead Redemption 2

- The RTX 4080 Super had an average framerate of 101 FPS in RDR2, on native resolution, with the Ultra settings enabled, which was 36% faster than the RTX 3090, which averaged a framerate of 74 FPS.
- The 1% lows of the RTX 4080 were around 78 FPS, which was also 36% higher than the RTX 3090’s average of 57 FPS.
Remnant 2

- With DLSS Quality and Ultra settings, the RTX 4080 reached 80 FPS, outpacing the RTX 3090 by 21%, which managed an average framerate of 66 FPS.
- The 1% lows were fairly close in this game, with the RTX 3090 going down to 54 FPS while the RTX 4080 Super went down to around 56 FPS.
Lords Of The Fallen

- In Lords Of The Fallen, the RTX 4080 averaged 41 FPS, showing a 31% lead over the RTX 3090, which struggled at 30 FPS.
- The 1% lows were also very stuttery on both cards, with the RTX 4080 Super getting lows of 28 FPS, while the RTX 3090 was 40% behind with a framerate of 20 FPS.
Starfield

- Running this game at native resolution was also pushing the comfort points of these cards, with the RTX 4080 Super reaching an average of 57 FPS, while the RTX 3090 had a framerate of 41 FPS, almost 40% lower than its rival.
- Finally, the 1% lows were also quite different in this game, with the RTX 4080 Super getting lows of 47 FPS, while the RTX 3090 was about 38% behind with a framerate of 34 FPS.
Overall Gaming Performance
| Featured | RTX 4080 Super | RTX 3090 |
|---|---|---|
| Average FPS | 76 📈 | 57 📈 |
| %1 lows | 57 📉 | 44 📉 |
| Winner: Nvidia's RTX 4080 Super | ||
The RTX 4080 Super outshines the RTX 3090 with a 33% higher average framerate and 29.5% better 1% lows. The inclusion of DLSS 3 Frame Generation widens the performance gap, highlighting Nvidia’s superior efforts. Overall, the RTX 4080 Super emerges as the clear winner.
Power Consumption
| Game | RTX 4080 Super (W) | RTX 3090 (W) |
|---|---|---|
| Hogwarts Legacy | 266 | 357 |
| Alan Wake 2 | 301 | 354 |
| Cyberpunk 2077 | 288 | 345 |
| Forza Horizon 5 | 242 | 333 |
| Assassin's Creed Mirage | 246 | 312 |
| The Last Of Us | 275 | 336 |
| Red Dead Redemption 2 | 292 | 350 |
| Remnant 2 | 295 | 348 |
| Lord Of The Fallen | 293 | 352 |
| Starfield | 259 | 331 |
| Average Power Consumption | 275.7 | 341.8 |
| Winner: Nvidia's RTX 4080 Super | ||
The RTX 4080 Super outperforms the RTX 3090 by 33% while using 23.5% less power, offering a dual advantage in performance and energy efficiency. This can lead to cost savings on your power bill and potential compatibility with existing power supplies, unlike the power-hungry RTX 3090, which may require an upgrade.
Price And Value
| Graphics Card | Launch MSRP | Current Price |
|---|---|---|
| RTX 4080 Super | 💲999 | 💲999 |
| RTX 3090 | 💲$1499 | 💲1288 |
| Difference | 50.05% | 28.93% |
Despite its high VRAM, the RTX 3090 remains popular for server use, keeping its price stable. In contrast, the recently released RTX 4080 Super, with ample stock and a significant price cut from the RTX 4080, is expected to stay close to its MSRP.
Overall Gaming Performance
RTX 3090: Choosing the RTX 3090 over the RTX 4080 Super is not advisable due to its higher cost and lower performance. The larger VRAM may be the only reason to consider it, especially for productivity tasks.
RTX 4080 Super: The RTX 4080 Super outperforms the RTX 3090 in every tested game, offering a significant performance boost, a lower price, and improved efficiency. With innovative software features like frame generation, it surpasses the previous champion by a wide margin, making it the recommended choice over the RTX 3090.
To conclude, anyone deciding between the RTX 4080 Super vs RTX 3090 should be aware that the RTX 4080 is very clearly superior in terms of gaming performance, and the only reason you would want to buy the RTX 3090 would be for very specific professional workloads.
Frequently Asked Questions
No, sadly, both the RTX 4080 Super and the RTX 3090 use the same DP 1.4a ports and HDMI 2.1 port.
Yes, the RTX 4080 Super uses a single 16-pin connector, whereas the RTX 3090 uses an older single 12-pin connector.
The more complex 5nm process size used with the RTX 4080 Super helps tremendously with its performance as it allows Nvidia to put many more logical cores into the same form factor while also improving power efficiency.
More From RTX 3090
Thank you! Please share your positive feedback. 🔋
How could we improve this post? Please Help us. 😔
[Comparisons Expert]
Abdemanaf is a skilled creative writer who has been honing his craft since 2011. While initially working in different fields, he found a passion for technology and has been exploring the tech world since early 2015. Over the years, he has developed an in-depth knowledge of the latest tech trends and product offerings by various companies.
Abdemanaf’s writing reflects his analytical mindset and ability to think critically. He has a knack for breaking down complex technical information into easily digestible pieces, making his articles engaging and accessible to readers from all backgrounds. In February 2022, he joined Tech4Gamers as a blog and product comparison writer, where he has been able to hone his skills further.
As a writer, Abdemanaf is dedicated to staying up-to-date with the latest technological advancements and trends, enabling him to provide readers with the most relevant and accurate information. He is always eager to learn more and is constantly seeking new challenges to improve his skills.
Get In Touch: manaf@tech4gamers.com


