


AMD Ryzen 9 7950X3D
Rated: 9.3/10
AMD Ryzen 7 7800X3D
Rated: 9.5/10
Pros And Cons
| CPU | Pros | Cons |
|---|---|---|
| AMD Ryzen 7 7800X3D | ✅ Minimal electric power usage ✅ Incredible performance for price | ❌ Boost clock limited to 5.00 GHz ❌ No support for DDR4 |
| AMD Ryzen 9 7950X3D | ✅ High gaming perfromance ✅ Smart workload management (CCX Parking) ✅ Energy-efficient CPU | ❌ Higher price ❌ Limited overclocking |
- During our gaming tests at 1080p resolution, the Ryzen 9 7950X3D performed roughly 1.9% better than the Ryzen 7 7800X3D.
- In our evaluations, the Ryzen 7 7800X3D proved to be 21.4% more power efficient and 7.05% more thermally efficient than the Ryzen 9 7950X3D.
- As of March 2024, the price of the Ryzen 7 7800X3D is about $383, while the Ryzen 9 7950X3D costs much higher, about $595.
- I recommend choosing the Ryzen 7 7800X3D due to its superior performance-to-price ratio and power efficiency.
Comparison Table
| Feature | AMD Ryzen 7 7800X3D | AMD Ryzen 7 7950X3D |
|---|---|---|
| Former Codename | Raphael | Raphael |
| CPU Cores | 8 | 16 |
| CPU Threads | 16 | 32 |
| Boost Clock | Up to 5.0 GHz | Up to 5.7 GHz |
| Integrated Graphics | AMD Radeon Graphics | AMD Radeon Graphics |
| iGPU Boost Clock | 2200 MHz | 2200 MHz |
| Bandwidth | 83.2 GB/s | 83.2 GB/s |
| Max Temperature | Up to 89°C | Up to 89°C |
| Motherboard | Best Motherboards For Ryzen 7 7800X3D | Best Motherboards For Ryzen 9 7950X3D |
| RAM | Best RAM For Ryzen 7 7800X3D | Best RAM For Ryzen 9 7950X3D |
| Cooler | Best CPU Coolers For Ryzen 7 7800X3D | Best CPU Coolers For Ryzen 9 7950X3D |
Architectural Difference
- Architecture: The Ryzen 7 7800X3D and Ryzen 9 7950X3D boast the cutting-edge AMD Zen 4 architecture that uses TSMC’s 5nm core manufacturing technology.
- CPU Socket: Coming to the CPU socket, these processors integrate the same AMD’s first LGA socket, the AM5 (LGA1718), containing 1718 pins for connection with the motherboard.
- Clock Speed: The Ryzen 7 7800X3D and Ryzen 9 7950X3D both have a base clock of 4.2 GHz. However, the Ryzen 9 7950X3D has a 14.0% greater turbo clock speed.
- CPU Memory: AMD offers support for only DDR5 memory in the Ryzen 7 7800X3D and Ryzen 9 7950X3D. They have 128GB DDR5 memory with the UDIMM subtype.
- TDP: AMD has specified a 120-watt TDP rating for the Ryzen 7 7800X3D and Ryzen 9 7950X3D. However, the power usage of these CPUs is different in stress tests.
The Ryzen 7 7800X3D and the Ryzen 9 7950X3D are high-end AMD CPUs rendering unparalleled gaming performance. Rumors are going around pleading that the Ryzen 7800X3D, being less expensive, outperforms the costly Ryzen 9 7950X3D. To figure out how distorted reality is, let us start with the Ryzen 7 7800X3D vs Ryzen 9 7950X3D comparison.
Gaming Benchmarks
After a comprehensive discussion on specifications, it is time to discuss the actual gaming performance of the Ryzen 7 7800X3D vs Ryzen 9 7950X3D. Here, we will test the performance of these processors in 8 taxing games at 1080p resolution at ultra settings.
Gaming Rig
- OS: Windows 11
- Motherboard: Gigabyte X670 Aorus Master AM5
- GPU: GIGABYTE RTX 4090 Gaming OC
- RAM: Kingston Fury Renegade RGB DDR5 32GB 7200MHz
- SSD: XPG GAMMIX S70 BLADE 2TB NVMe SSD
- Links: ENERMAX REVOLUTION D.F. X 1050W
- CPU Cooler: Deepcool Assassin II CPU Cooler
Call Of Duty: Modern Warfare 2
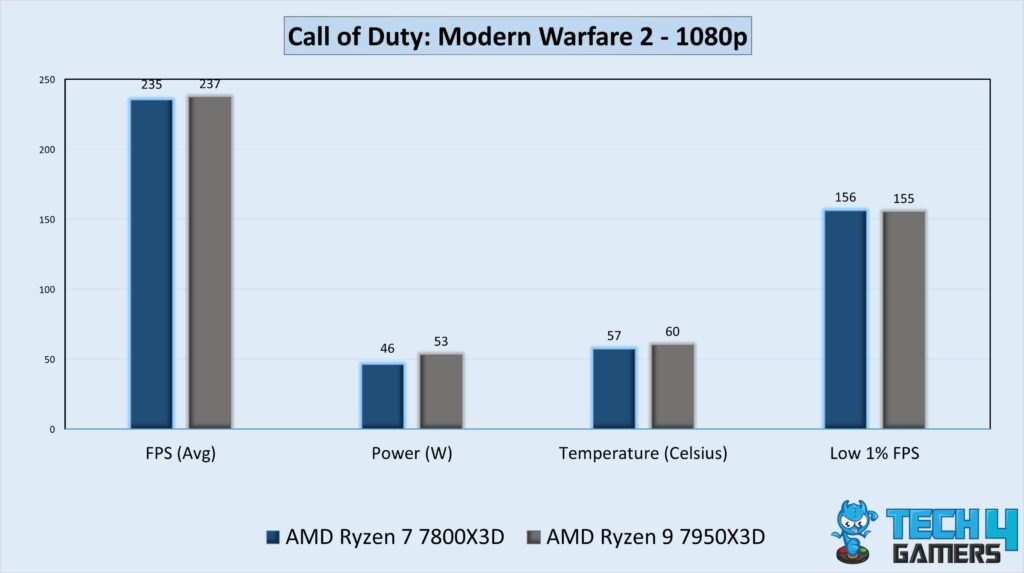
- In our first Call of Duty: Modern Warfare 2 session, the Ryzen 9 7950X3D provided 2 FPS or 1% higher performance than the Ryzen 7 7800X3D’s 235 FPS.
- Moving to the low 1% performance, the R7 7800X3D (156 FPS) supplied 1 FPS higher than the R9 7950X3D (155 FPS).
Cyberpunk 2077
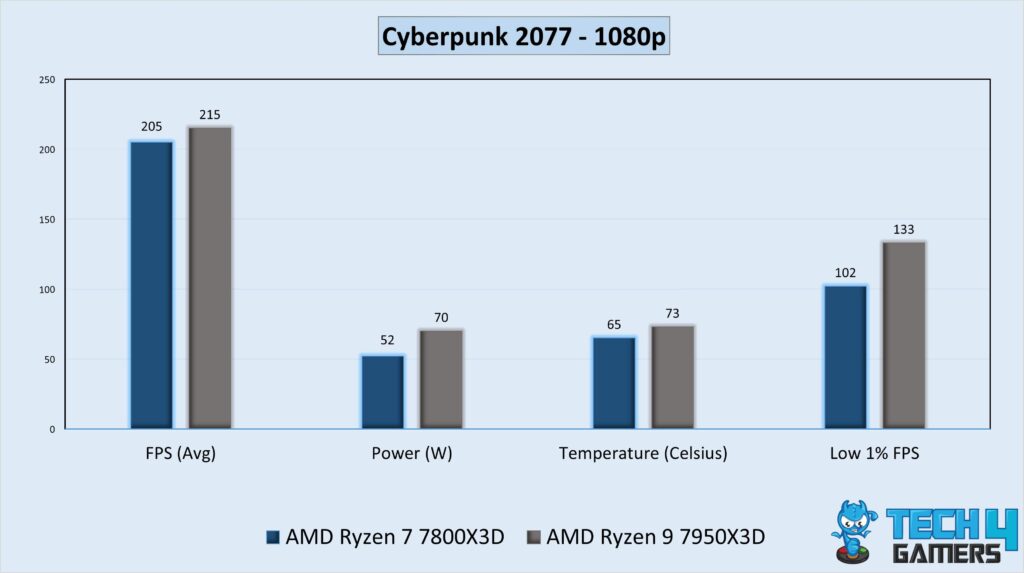
- The R9 7950X3D delivered 215 FPS in Cyberpunk 2077, outperforming the R7 7800X3D by 10 FPS or 4.9%.
- Regarding the low 1% frame rate, the R9 7950X3D provided 31 more FPS than the R7 7800X3D’s performance of 102 FPS.
Forza Horizon 5
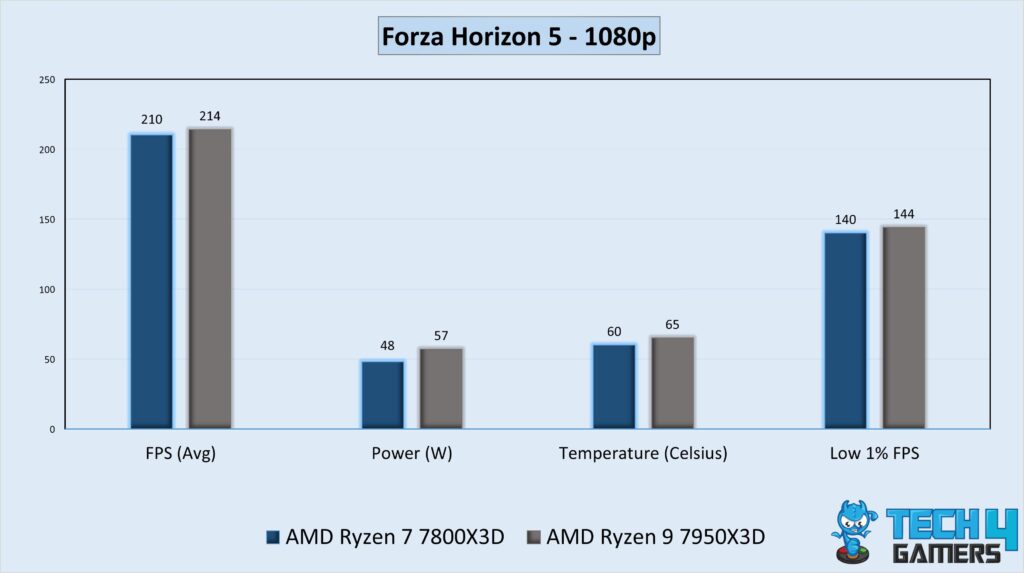
- In Forza Horizon 5, the R9 7950X3D produced 214 FPS, outscoring the R7 7800X3D’s 210 FPS average by 4 FPS or 1.9%.
- About the low 1% frame rate, the R9 7950X3D offered 144 FPS, whereas the R7 7800X3D offered 140 FPS.
Lost Ark
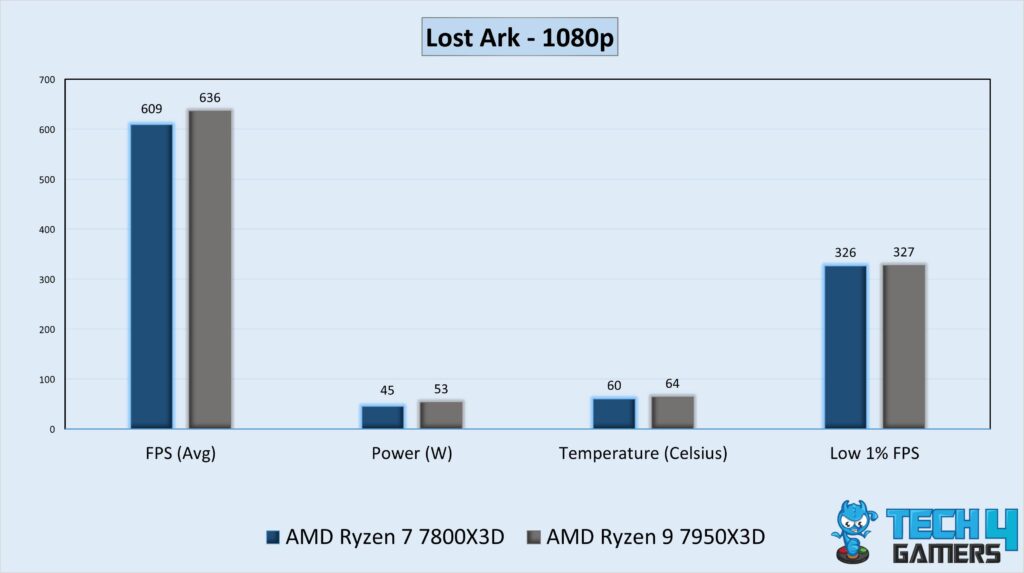
- During our Lost Ark gameplay, the R9 7950X3D performed 27 FPS or 4.4% better than the R7 7800X3D by averaging 636 FPS compared to the 609 FPS.
- In Lost Ark, the R9 7950X3D gave 327 FPS for the low 1% frame rate, whereas the R7 7800X3D provided 326 FPS.
Overwatch 2
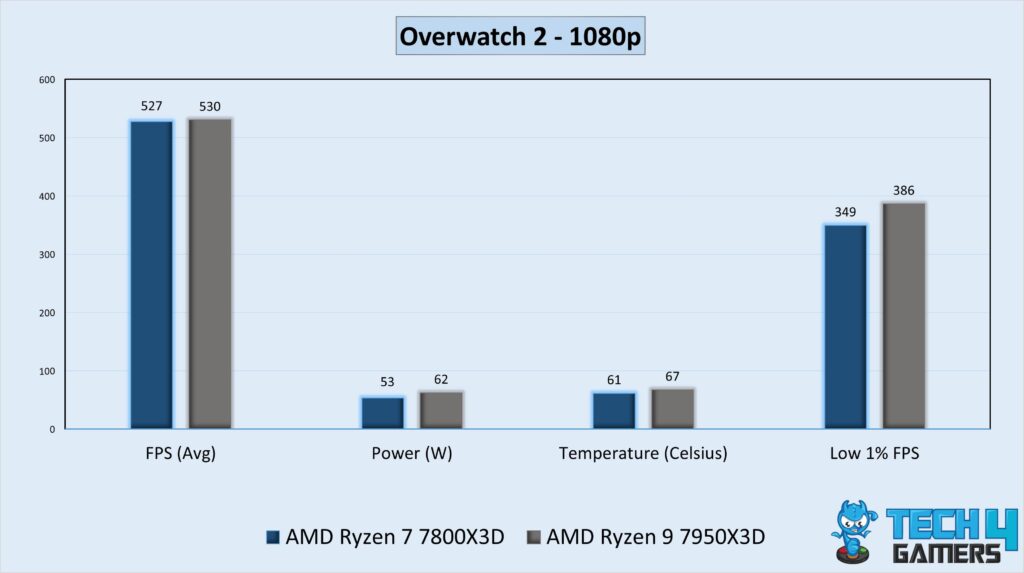
- In Overwatch 2, the R9 7950X3D beat the R7 7800X3D with a minute performance lead of 3 FPS by averaging 530 FPS.
- The R9 7950X3D offered 386 FPS as the low 1% frame rate, compared to the R7 7800X3D’s 349 FPS.
PUBG
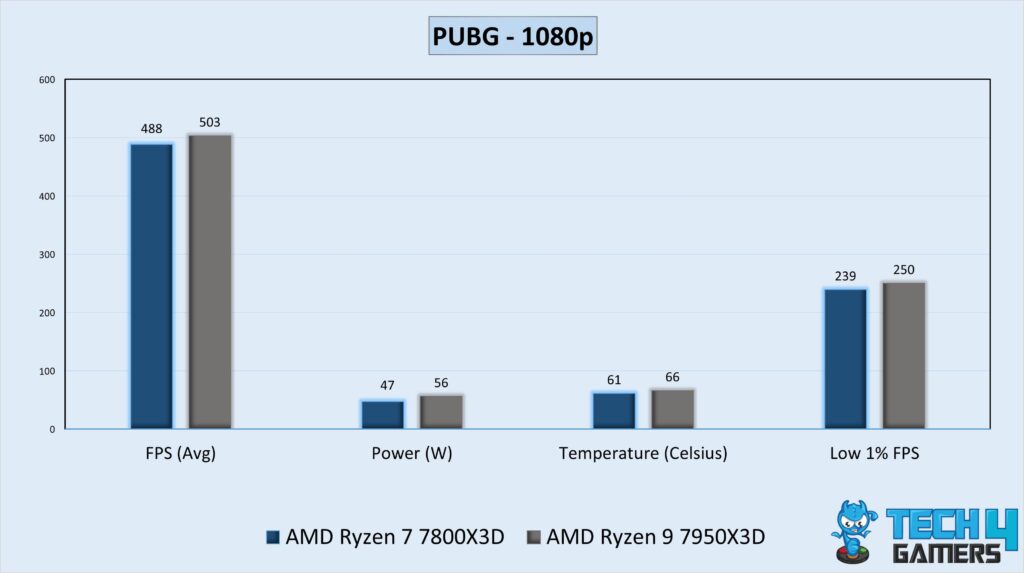
- During PUBG, the Ryzen 9 7950X3D prevailed in the performance competition by achieving 503 FPS on average, making a 15 FPS average or 3.1% lead.
- Compared to the R7 7800X3D’s 239 FPS, the R9 7950X3D provided a low 1% frame rate of 250 FPS.
Rainbow Six Siege
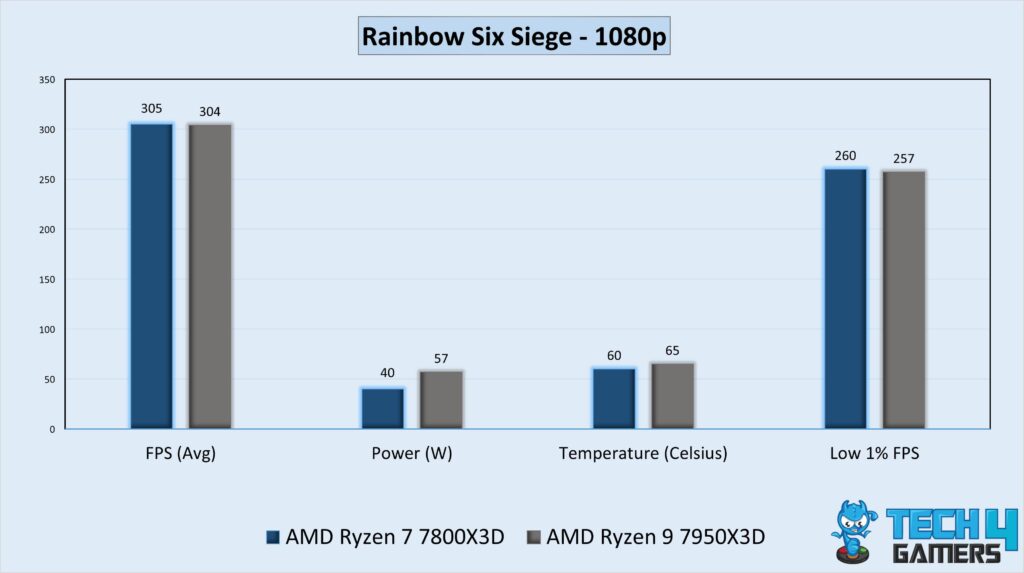
- In Rainbow Six Siege, we saw the Ryzen 7 7800X3D surpassing the Ryzen 9 7950X3D by 1 FPS, delivering an average frame rate of 305 FPS against 304 FPS.
- The Ryzen 7 7800X3D supplied 3 more FPS than the R9 7950X3D at the low 1% performance, producing 260 FPS.
Red Dead Redemption 2
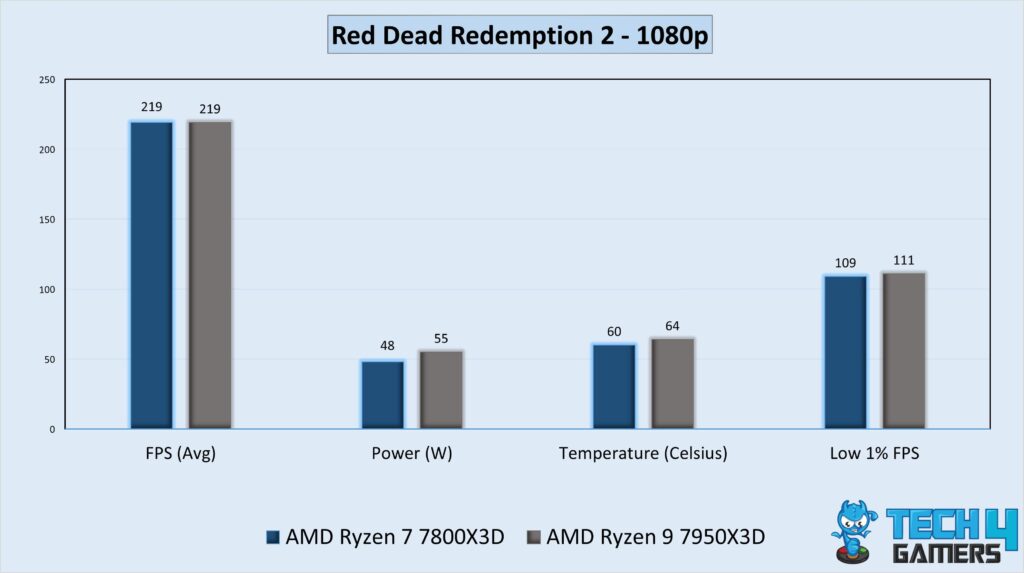
- In Red Dead Redemption 2, we noticed that the R7 7800X3D and the R9 7950X3D had an identical performance averaging 219 FPS.
- Regarding the low 1% frame rate, the Ryzen 9 7950X3D (111 FPS) supplied 2 FPS more than the Ryzen 7 7800X3D (109 FPS).
Spider-Man Remastered
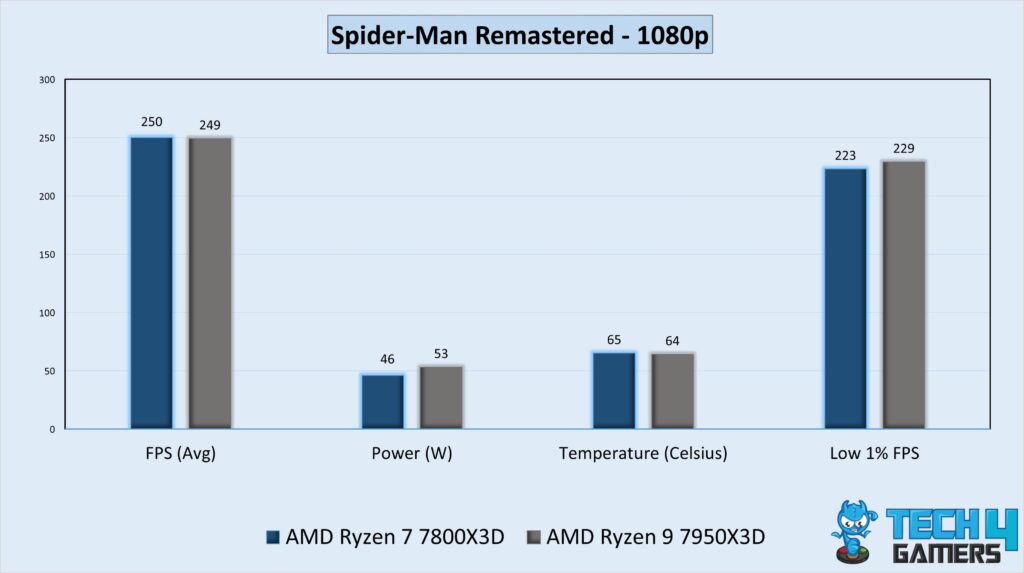
- In our last Spider-Man Remastered session, the average rendition of the R7 7800X3D was 1 FPS higher than the R9 7800X3D’s 249 FPS.
- Concerning the low 1% performance, the R9 7950X3D turned 229 FPS, whereas the R7 7800X3D could only turn 223 FPS.
Overall Gaming Performance
| Stats | AMD Ryzen 9 7950X3D | AMD Ryzen 7 7800X3D |
|---|---|---|
| Average FPS | 345.2 📈 | 338.7 📉 |
| Low 1% FPS | 221.3 📈 | 211.6 📉 |
| Winner: AMD Ryzen 9 7950X3D | ||
During our gaming tests at 1080p resolution, the Ryzen 9 7950X3D dominates gaming performance, surpassing the Ryzen 7 7800X3D by a margin of 1.92%. When we counted the 1% low performance, the Ryzen 9 7950X3D again beat the competition by about 4.6%.
Power Efficiency
| Stats | AMD Ryzen 9 7950X3D | AMD Ryzen 7 7800X3D |
|---|---|---|
| Average Power Draw (W) | 57.3 ⚡ | 47.2 ⚡ |
| Winner: AMD Ryzen 7 7800X3D | ||
Per our CPU power consumption measures at 1080p, the Ryzen 7 7800X3D is about 21.4% more power efficient than the R9 7950X3D. The Ryzen 7 7800X3D delivers significantly greater performance efficiency regarding power draw.
Thermal Efficiency
| Stats | AMD Ryzen 9 7950X3D | AMD Ryzen 7 7800X3D |
|---|---|---|
| Average Gaming Temperaure(°C) | 65.3 🌡️ | 61.0 🌡️ |
| Winner: AMD Ryzen 7 7800X3D | ||
During our thermal testing of the Ryzen 7 7800X3D vs Ryzen 9 7950X3D, the average operating temperature of the Ryzen 7 7800X3D was cooler. According to our trials, the Ryzen 7 7800X3D is about 7.05% more thermally efficient than the Ryzen 9 7950X3D.
Price And Availability
| CPU | Launch MSRP | Current Price |
|---|---|---|
| AMD Ryzen 9 7950X3D | 💲699 | 💲595 |
| AMD Ryzen 7 7800X3D | 💲449 | 💲383 |
| Price Difference | 55.6% | 55.3% |
The Ryzen 7 7800X3D has been about 55.5% cheaper than the Ryzen 9 7950X3D. When comparing performance, the Ryzen 7 7800X3D provides significantly better value for its cost, with only a 1.92% performance difference.
Final Verdict: What Do We Recommend?
AMD Ryzen 9 7950X3D: The Ryzen 9 7950X3D provides excellent gaming performance. It has an incredible 128MB AMD 3D-V cache size, significantly improving gaming performance. It also excels in content creation capabilities.
AMD Ryzen 7 7800X3D: The Ryzen 7 7800X3D stands out as a top-tier gaming processor, delivering exceptional performance while maintaining operational efficiency. It’s the perfect processor for gaming.
For ultimate gaming and productivity, prioritize the Ryzen 9 7950X3D for premium features. For an economical option with exemplary performance and lower running costs, choose the Ryzen 7 7800X3D, which also offers more excellent value for money.
More From Ryzen 9 7950X3D:
More From Ryzen 7 7800X3D:
- Core i7-14700K Vs Ryzen 7 7800X3D
- Core i5-14600K Vs Ryzen 7 7800X3D
- Ryzen 7 7800X3D Vs Core i9-13900K
Thank you! Please share your positive feedback. 🔋
How could we improve this post? Please Help us. 😔
[Comparisons Expert]
Abdemanaf is a skilled creative writer who has been honing his craft since 2011. While initially working in different fields, he found a passion for technology and has been exploring the tech world since early 2015. Over the years, he has developed an in-depth knowledge of the latest tech trends and product offerings by various companies.
Abdemanaf’s writing reflects his analytical mindset and ability to think critically. He has a knack for breaking down complex technical information into easily digestible pieces, making his articles engaging and accessible to readers from all backgrounds. In February 2022, he joined Tech4Gamers as a blog and product comparison writer, where he has been able to hone his skills further.
As a writer, Abdemanaf is dedicated to staying up-to-date with the latest technological advancements and trends, enabling him to provide readers with the most relevant and accurate information. He is always eager to learn more and is constantly seeking new challenges to improve his skills.
Get In Touch: manaf@tech4gamers.com


Feedback By: