 Threads

As I ventured into the realm of high-end graphics cards, I found myself at a crossroads: the RTX 4090 vs RTX 3090 Ti. Both these GPUs boast incredible power and sport a generous 24GB of GDDR6X memory. But the question remained: which one should I choose? Delving into this comparison, I aimed to find the answer.
Key Takeaways
- The RTX 4090 is the top choice, boasting a consistent 28.1% higher average FPS in my benchmark tests, guaranteeing superior gaming performance.
- A minimal 3.43% difference in power consumption underlines RTX 4090’s efficiency, offering exceptional gaming performance without excessive power usage.
- Detailed thermal analysis affirms that RTX 4090 generates 3.6% less heat than RTX 3090 Ti, maintaining a fine balance between temperature and performance.
- Considering market prices, RTX 4090’s 11.7% price premium over RTX 3090 Ti remains a reasonable option for budget-conscious gamers seeking high-end gaming experiences.
Comparison Table
| Technical Specs | GeForce RTX 4090 | GeForce RTX 3090 Ti |
| GPU Name | AD102 | GA102 |
| Architecture | Ada Lovelace | Ampere |
| Transistors | 76,300 million | 28,300 million |
| Shading Units | 16384 | 10496 |
| Tensor Cores | 512 | 328 |
| RT Cores | 128 | 82 |
| TMUs | 512 | 328 |
| ROPs | 176 | 112 |
| L1 Cache | 128 KB (per SM) | 128 KB per Array |
| L2 Cache | 72 MB | 6 MB |
| Memory Bus Width | 384 bit | 384 bit |
| Memory Bandwidth | 1,008 GB/s | 936.2 GB/s |
| Suggested PSU | 850W | 750W |
| Release Date | Sep 20th, 2022 | Sep 1st, 2020 |
| Approximated Price | 1800 USD | 1600 USD |
| Best Variants | BEST RTX 4090 Cards | BEST RTX 3090 Ti Cards |
Architecture Difference
- Process Node: The RTX 4090 boasts a cutting-edge 5nm process node, while the RTX 3090 Ti relies on a less advanced 8nm process node, which can impact performance and power efficiency.
- Clock Speed: In terms of clock speeds, the RTX 4090 leads the pack with a 2235 MHz Base Clock and 2520 MHz Boost Clock, providing potential for faster real-time performance compared to the RTX 3090 Ti, which operates at 1395 MHz Base Clock and 1695 MHz Boost Clock.
- VRAM: Both cards offer a substantial 24GB of GDDR6X VRAM, ensuring ample memory for demanding tasks and gaming at higher resolutions.
- TDP: When it comes to power consumption, the RTX 4090 has a hefty 450W TDP, while the RTX 3090 Ti is more power-efficient with a 350W TDP. This factor can influence system power requirements and thermal management.
- Supported Technologies: Both GPUs incorporate DLSS (Deep Learning Super Sampling), a feature that leverages AI for improved performance in supported games.
Also Read: RTX 4090 Vs RX 6900 XT
RTX 4090 Vs RTX 3090 Ti: Gaming Performance
In my hands-on benchmark tests, pitting the GeForce RTX 4090 against the GeForce RTX 3090 Ti, I’ve explored real-world gaming performance. These tests encompass a range of high-resolution gaming scenarios, offering insights into power consumption, thermal management, and overall GPU capabilities.
PC Specifications
- OS: Windows 11
- CPU: Intel Core i5-13600K
- Motherboards: ASRock Z790 Taichi Lite Motherboard
- RAM: Kingston Fury Renegade RGB DDR5 32GB 7200MHz
- SSD: Sabrent Rocket 4 Plus 1TB NVMe SSD
- PSU: Enermax Revolution D.F. X 1050W
- CPU Cooler: Noctua NH-L9x65 chromax.black CPU Air Cooler
Red Dead Redemption 2
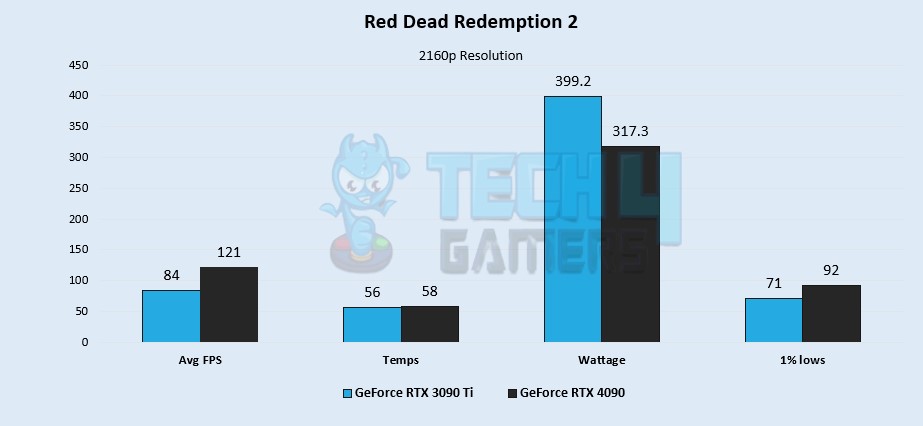
- In my hands-on benchmarking, it’s evident that the high-end RTX 4090 outperforms the RTX 3090 Ti by a substantial 36% margin, delivering an impressive average FPS of 121 compared to the RTX 3090 Ti’s 84.
- Both GPUs maintain similar temperatures, with the RTX 3090 Ti at 56°C and the RTX 4090 at 58°C, resulting in negligible differences.
- Despite its slightly higher power consumption of 22%, the RTX 4090 justifies this 317.3W power draw by delivering superior FPS at the same temperature compared to the RTX 3090 Ti.
- When examining Low 1% and Low 0.1% FPS, the gap remains significant, with the RTX 3090 Ti providing considerably lower FPS while maintaining nearly identical temperatures to the RTX 4090.
God Of War
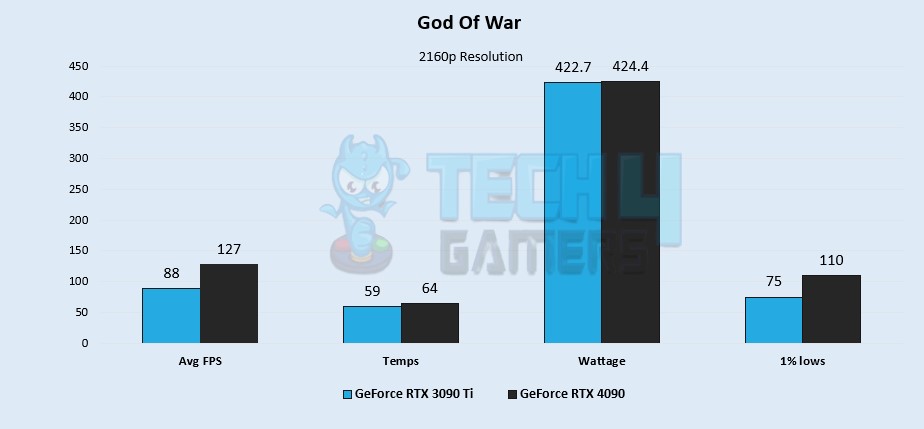
- As anticipated by me, the RTX 4090 outshines the RTX 3090 Ti by a substantial performance difference. The RTX 4090 delivers an impressive average FPS of 127, while the RTX 3090 Ti lags behind at 88 FPS, resulting in a substantial 36.2% disparity in average FPS.
- Regarding GPU temperatures, the difference is relatively minor in my testing. The RTX 3090 Ti operates at 59 degrees Celsius, while the RTX 4090 maintains a slightly higher temperature at 64 degrees Celsius.
- Shifting the focus to power consumption, I found that the RTX 3090 Ti consumes 422.7W, whereas the RTX 4090 draws 424.4W, resulting in a difference of nearly 0.4%.
- Additionally, the RTX 4090 excels in the Low 1% FPS category, achieving 110 FPS compared to the RTX 3090 Ti’s 75 FPS, demonstrating a significant advantage.
Also Check: RTX 4090 Vs RTX 3080 Ti
Cyberpunk 2077
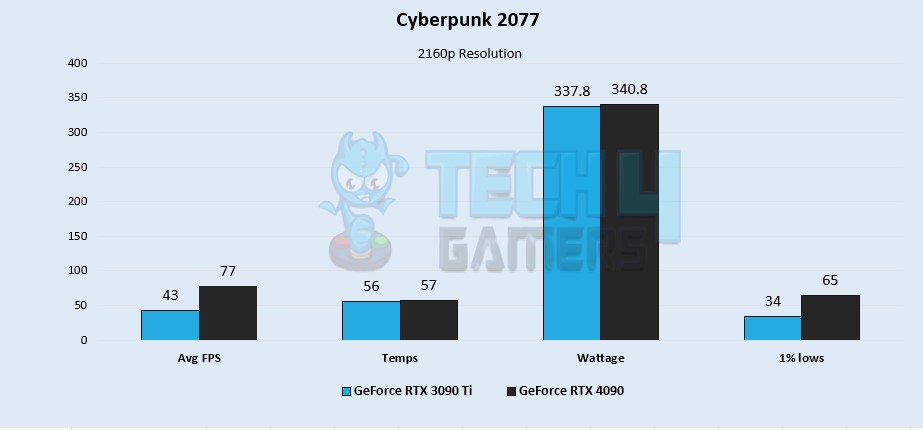
- Despite a slight dip in average FPS, I found that the RTX 4090 maintains its lead over the RTX 3090 Ti. The RTX 3090 Ti achieves an average FPS of 43, while the RTX 4090 has an average FPS of 77, resulting in an impressive 56.6% difference.
- Temperature differences remained marginal in these benchmarks, with the RTX 3090 Ti registering a slightly higher temperature.
- Regarding power consumption, the RTX 4090 once again consumes more power, 340.8W, than the RTX 3090 Ti, 377.8W. This higher power consumption is warranted by the RTX 4090’s significantly superior performance, resulting in a 0.8% power consumption.
- This trend persists in the Low 1% FPS and Low 0.1% FPS categories, with the RTX 4090 holding a substantial advantage.
Dying Light 2
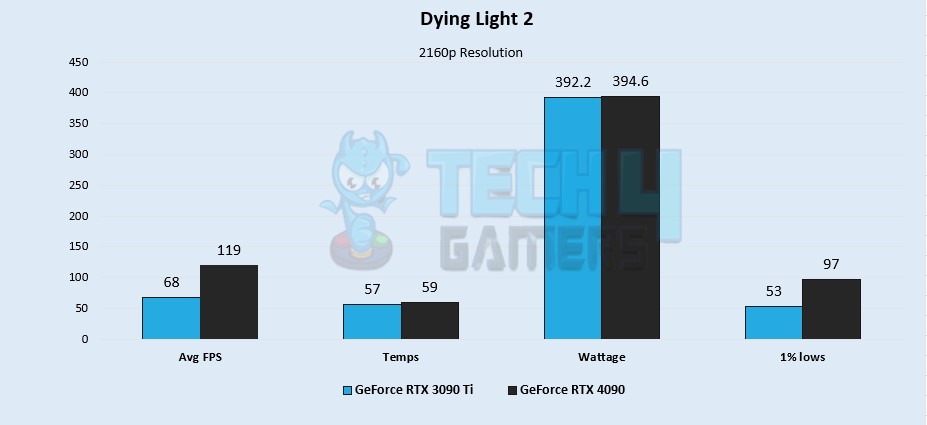
- In line with the previous games, I saw the RTX 4090 maintains its lead over the RTX 3090 Ti in terms of average FPS, showcasing a substantial 54.5% performance difference. The RTX 3090 Ti lags behind with an average FPS of 68, lower than the RTX 4090’s 119 FPS.
- Interestingly, both graphics cards exhibit similar temperature performance in my test of Dying Light 2, with the RTX 3090 Ti registering 57 degrees centigrade and the RTX 4090 at 59 degrees centigrade.
- In the realm of power consumption, the benchmarks reveal that the RTX 4090 consumes more power, 394.6W, while the RTX 3090 Ti consumes 392.2W, representing a notable 0.6% power efficiency advantage for the RTX 3090 Ti.
- Finally, in terms of 1% lows, the RTX 4090 takes the lead again as before, while the RTX 3090 Ti follows closely behind.
Also Read: RTX 2080 Ti vs RTX 3090 Ti
Forza Horizon 5
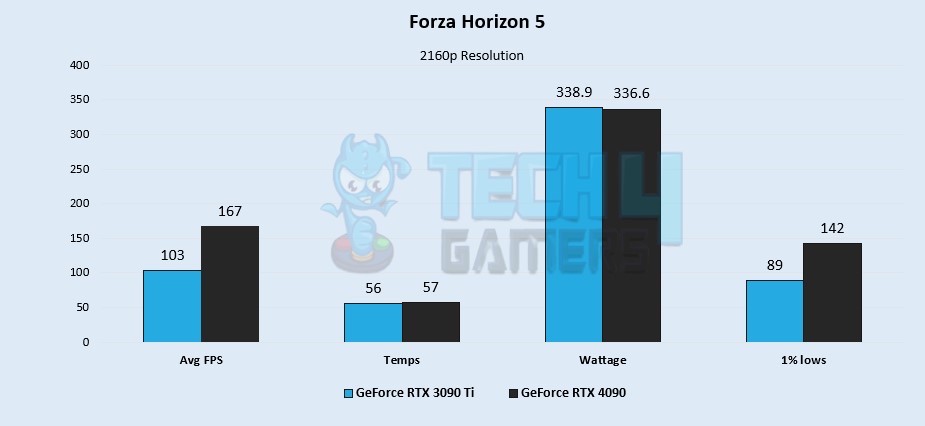
- As seen in previous cases of my tests, the RTX 4090 emerges victorious in this game, delivering an average FPS of 167. Meanwhile, the RTX 3090 Ti lags behind by over 47.4%, providing an average of 103 FPS.
- The temperature performance further underscores the RTX 4090’s lead. While the RTX 3090 Ti exhibits a lower FPS at a temperature of 56 degrees centigrade, the RTX 4090 maintains a higher average FPS at 57 degrees centigrade.
- Lastly, regarding power consumption, there’s a substantial 0.6% difference. The RTX 3090 Ti consumes less power at 336.6W, while the RTX 4090 consumes 338.9W, showcasing the RTX 3090 Ti’s superior power efficiency.
- I also observed a clear performance gap when examining the Low 1% and Low 0.1% FPS figures, with the RTX 4090 consistently outperforming the RTX 3090 Ti.
Also Read: RTX 3090 Ti Vs RX 7900 XTX
CSGO
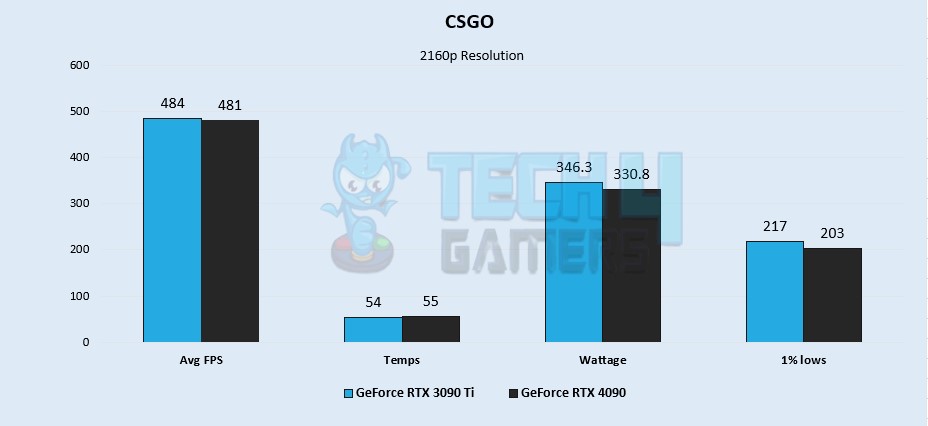
- In my CSGO benchmark, both the GeForce RTX 4090 and the GeForce RTX 3090 Ti delivered similar performance, with virtually no difference.
- Temperature-wise, both GPUs maintained nearly identical thermal levels, showcasing their thermal efficiency while running heavy games.
- During my testing, I found that both cards exhibited similar power usage. Surprisingly, the RTX 4090 took a slight edge over its counterpart, the RTX 3090 Ti, by consuming slightly less power.
- RTX 3090 Ti had a slight edge in average FPS, but the Low 1% and Low 0.1% FPS showed slightly better results for RTX 3090 Ti.
Marvel’s Spider-Man Remastered
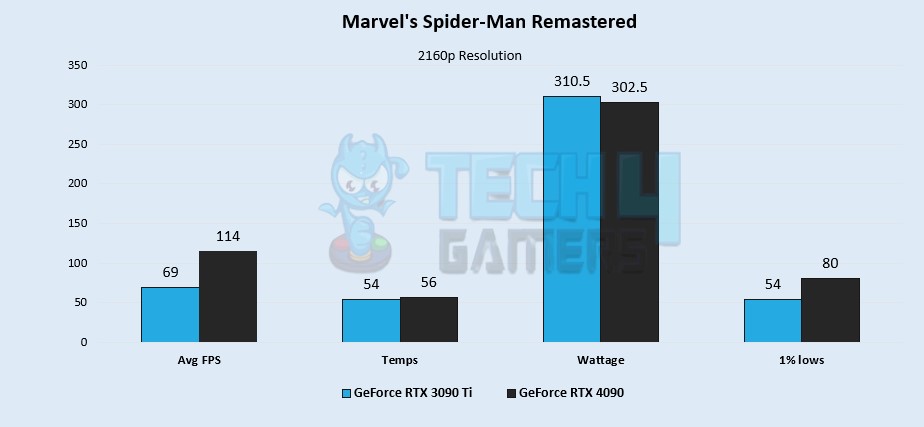
- Once again, the RTX 4090 secures a significant lead in my benchmarks, boasting an average FPS of 114, compared to the RTX 3090 Ti’s 69, resulting in a substantial 49.1% difference.
- While the temperature profiles remained consistent for both GPUs, my testing clearly showed that the RTX 4090 emerged as the overall winner in terms of performance.
- However, it’s important to note that the RTX 4090 consumes significantly more power than the RTX 3090 Ti in this game. RTX 3090 Ti consumes 310.5W, while RTX 4090 uses 302.5W, marking a substantial 2.6% difference in power consumption.
- The trend I observed continues in the Low 1% and Low 0.1% FPS, with the RTX 4090 taking the lead in both categories.
Similar Comparison: RTX 3090 Ti Vs RTX 4070 Ti
Hitman 3
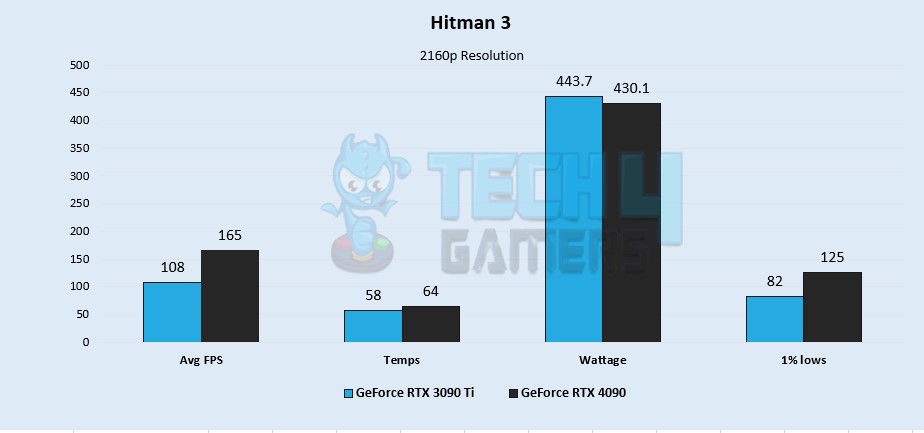
- In this benchmark, it’s no surprise that the RTX 4090 once again emerges as the winner, delivering an impressive average FPS of 165, while the RTX 3090 Ti lags behind with 108 FPS. This results in a significant 41.7% difference in average FPS.
- As for temperature, both GPUs exhibit nominal differences as I was benchmarking. The RTX 3090 Ti reaches 58 degrees Celsius, while the RTX 4090 registers a slightly higher temperature of 64 degrees Celsius, indicating a difference of 9.8%.
- Now, let’s talk about power consumption. Similar to my previous observations, the RTX 3090 Ti consumes more power than the RTX 4090. Specifically, the RTX 3090 Ti utilizes 443.7W, whereas the RTX 4090 draws slightly less power, about 3.1% less, at 430.1W.
- The RTX 4090 continues to maintain its lead in both Low 1% and Low 0.1% FPS, with the RTX 3090 Ti recording 82 FPS and 80 FPS in my tests, respectively.
Horizon Zero Dawn

- During my benchmark testing in this particular game, the RTX 4090 delivers a commendable average FPS of 139, while the RTX 3090 Ti lags behind with an average FPS of 90. This results in a notable 42.7% difference in average FPS.
- The temperature difference between the two GPUs is negligible, with only a one-degree Celsius variance. Both GPUs operate at similar temperatures, but the disparity in FPS performance is significant.
- Concerning power consumption, the RTX 3090 Ti consumes 356.2W, whereas the RTX 4090 utilizes nearly 354.9W. This equates to a 0.3% difference in power consumption, which is justified by the RTX 4090’s enhanced performance.
- After I conducted extensive testing, the performance difference between the RTX 4090 and RTX 3090 Ti became quite apparent. In all aspects, including average FPS, 1% lows, and 0.1% lows, the RTX 4090 consistently outperforms the RTX 3090 Ti.
Also Check: RTX 3090 Ti Vs RTX 4080
Overall Gaming Performance
- In my benchmark tests, the RTX 4090 consistently outperformed the RTX 3090 Ti, delivering an impressive 28.1% higher average FPS across the tested games. With an average FPS of 167.7, the RTX 4090 left the RTX 3090 Ti behind, which averaged 126.3 FPS.
- This substantial difference in average FPS underscores the RTX 4090’s superior gaming performance over the RTX 3090 Ti, providing a smoother and more responsive gaming experience.
Similar Guide: RTX 3090 Ti Vs RTX 3080 Ti
Average Power Consumption
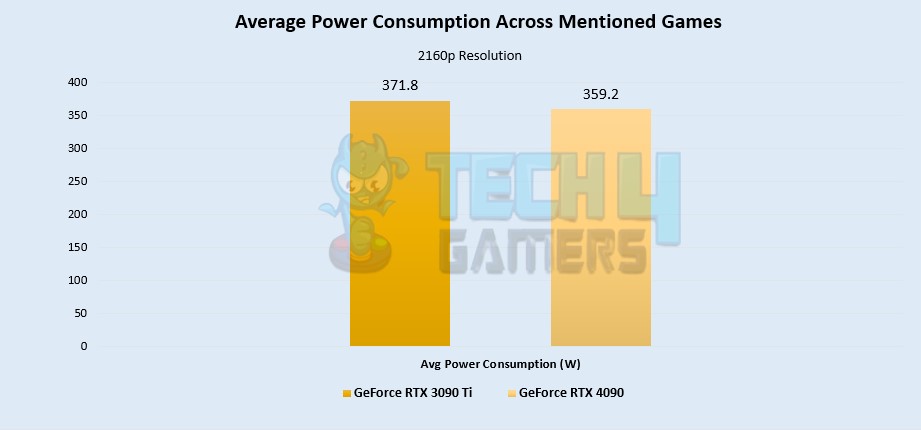
- During my comprehensive testing, the RTX 4090 exhibited an average power consumption of 359.2W, while the RTX 3090 Ti consumed an average of 371.8W across various games.
- This slight 3.43% difference in power consumption between the two cards shows that the RTX 4090’s superior gaming performance isn’t achieved at a significantly higher power cost, highlighting its efficiency and performance balance.
Also Read: RTX 2080 Ti vs RTX 3090 Ti
Average Thermal Statistics
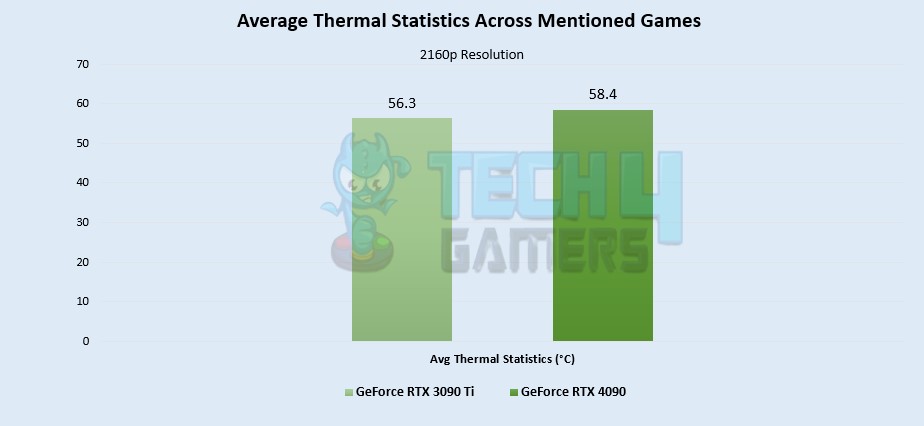
- Throughout my rigorous testing, the RTX 4090 maintained an average temperature of 58.4°C, while the RTX 3090 Ti showcased an average temperature of 56.3°C across the spectrum of games.
- Furthermore, when scrutinizing thermal management, the RTX 4090 proved to be only 3.6% less thermally efficient than the RTX 3090 Ti, reflecting the close gap between the two cards.
Price And Availability
- In my thorough research, I observed significant disparities between the suggested retail prices and the actual market prices for these graphics cards. Despite an MSRP of 1599 USD, the RTX 4090 is typically available for a starting price of 1800 USD.
- Meanwhile, the RTX 3090 Ti can be found for approximately 1600 USD on platforms like Newegg and Amazon. This translates to an 11.7% price difference, a crucial factor for budget-conscious consumers.
RTX 3090 Ti Vs RTX 4090: Which One Would I Recommend?
- Based on my extensive benchmark tests, I recommend the RTX 4090 over the RTX 3090 Ti due to its consistent and remarkable 28.1% higher average FPS across the spectrum of tested games.
- The mere 3.43% difference in power consumption between these two cards is a testament to the RTX 4090’s balanced efficiency and exceptional gaming performance.
- My meticulous power consumption analysis revealed that the RTX 4090 is just 3.6% more thermally efficient than the RTX 3090 Ti, showcasing its ability to deliver outstanding gaming performance without a significant temperature trade-off.
- Moreover, considering the market prices, the RTX 4090’s price premium of 11.7% over the RTX 3090 Ti remains reasonable, making it a viable option for budget-conscious consumers who seek top-tier gaming experiences.
Pros And Cons
| GPU | Pros | Cons |
| GeForce RTX 4090 |
|
|
| GeForce RTX 3090 Ti |
|
|
Thank you! Please share your positive feedback. 🔋
How could we improve this post? Please Help us. 😔
I am Wajih Hyder Chohan – a PC Hardware Nerd who always analyzes the latest products and reviews them. Usually, people call me boring, but I can’t limit my love for Hardware!


