RTX 2080 Ti
Rated: 6.5/10
RTX 3090 Ti
Rated: 8/10
Pros And Cons
| Graphics Card | Pros | Cons |
|---|---|---|
| RTX 3090 Ti | ✅ Higher Raw Performance ✅ Larger VRAM | ❌ Lower Thermal Efficiency |
| RTX 2080 Ti | ✅ Lower Power Consumption ✅ Better Value for Money | ❌ Lower Gaming Performance |
- Our benchmarks showcase that the RTX 3090 Ti dominates with a 51.6% frame rate increase over the RTX 2080 Ti, ensuring smooth, high-resolution gaming at 4K and beyond.
- The RTX 2080 Ti excels in power efficiency, consuming a remarkable 37.5% less power than the RTX 3090 Ti. It also has a 4.8% thermal advantage, allowing it to operate at cooler temperatures.
- As of early March 2024, both GPUs are more affordable than ever, selling for less than their MSRP. The price difference is around 65%, making the RTX 2080 Ti a perfect value option.
- We recommend the RTX 3090 Ti for those seeking the best gaming performance. If you’re looking for a more budget-friendly option and are willing to trade some frame rate for better thermal efficiency, the RTX 2080 Ti offers excellent value.
Comparison Table
| Technical Specs | GeForce RTX 2080 Ti | GeForce RTX 3090 Ti |
|---|---|---|
| Architecture | Turing | Ampere |
| CUDA Cores | 4352 | 10752 |
| Tensor Cores | 544 | 336 |
| RT Cores | 68 | 84 |
| Memory Bus Width | 352 bit | 384 bit |
| Release Date | Sep 20th, 2018 | Jan 27th, 2022 |
| MSRP | 1000 USD | 1900 USD |
| Best Variants | - | Best RTX 3090 Ti Graphic Cards |
Now that we’ve explored the technical specifications of both cards, it’s time to shift our focus to NVIDIA’s lineup and dissect the performance disparities in the GeForce RTX 2080 Ti that we have reviewed recently against the GeForce RTX 3090 Ti. This head-to-head comparison will show how much performance users can expect to gain by upgrading from the older RTX 2080 Ti to the latest and most powerful RTX 3090 Ti.
Architectural Difference
- Clock Speeds: The older-gen RTX 2080 Ti has a base clock speed of 1350 MHz and a boost clock speed of 1545 MHz. On the other hand, the RTX 3090 Ti boasts a higher base clock speed of 1560 MHz and a boost clock speed of 1860 MHz.
- VRAM: The RTX 3090 Ti boasts a significant advantage in video memory with 24 GB of GDDR6X, while the RTX 2080 Ti has 11 GB of GDDR6.
- TDP: The RTX 3090 Ti has a significantly higher thermal design power of 450 watts than the 250 watts of the RTX 2080 Ti.
- Other Technologies: Both cards support cutting-edge technologies like ray-tracing, DLSS, and advanced DirectX 12 features for exceptional visual fidelity and enhanced frame rates. However, the RTX 3090 Ti has newer architecture and more advantages.
Gaming Benchmarks – 2160p
Having examined the architectural differences, it’s time to evaluate the practical performance of the GeForce RTX 2080 Ti vs the GeForce RTX 3090 Ti. We’ll use a comprehensive testing suite to analyze their capabilities in modern games. Our testing rig is outlined below:
Testing Rig
- CPU: Ryzen 7 5800X3D
- Motherboard: Gigabyte X570 Aorus Pro Wifi
- CPU Cooler: Corsair H115i RGB Platinum AIO
- Memory: 16×2 GB Patriot Viper LED DDR4-3600
- Power Supply: be quiet! Dark Power Pro 13 1300W
- Operating System: Windows 10 Pro
God of War
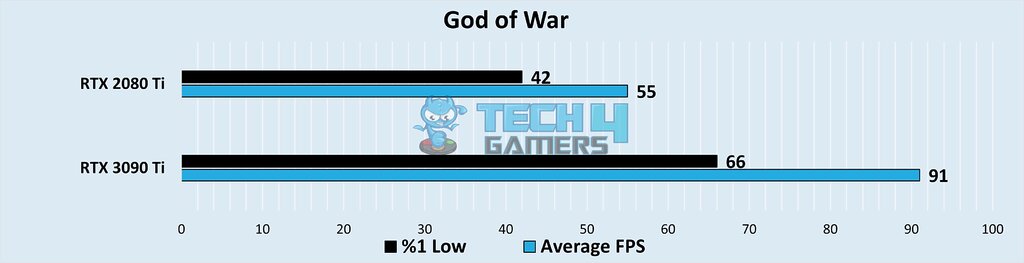
- The RTX 3090 Ti starts strong! It delivers a smooth 91 FPS in benchmarks, significantly outperforming the RTX 2080 Ti’s 55 FPS. That’s a massive 49.3% boost in performance.
- The RTX 3090 Ti demonstrates its minimum frame rate dominance with an impressive 66 FPS, leaving the RTX 2080 Ti’s 42 FPS far behind.
Marvel’s Spider-Man Remastered
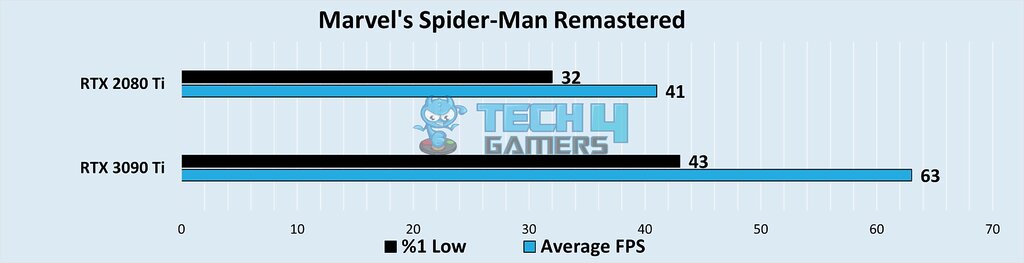
- The RTX 3090 Ti showed its dominance in Spider-Man Remastered. It achieved 63 FPS, significantly outperforming the RTX 2080 Ti’s 41 FPS with a 42.3% average FPS advantage.
- The RTX 3090 Ti outperforms the RTX 2080 Ti in minimum performance tests in Spider-Man Remastered. It delivers 43 FPS compared to the RTX 2080 Ti’s 32 FPS.
Witcher 3 Next Gen
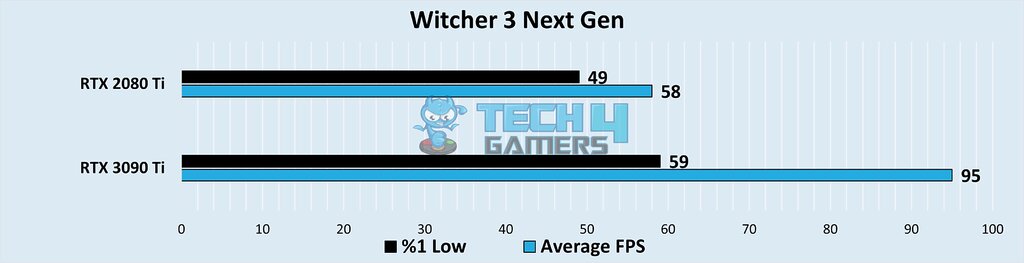
- During our tests, the RTX 3090 Ti demonstrated its power with a stunning 95 FPS. This represents a significant 48.3% average FPS increase over the RTX 2080 Ti’s 58 FPS.
- Our Witcher 3 Next Gen benchmarks confirmed the RTX 3090 Ti’s 1% low frame rate advantage. It reaches 59 FPS, surpassing the RTX 2080 Ti’s 49 FPS.
Call of Duty Modern Warfare 2
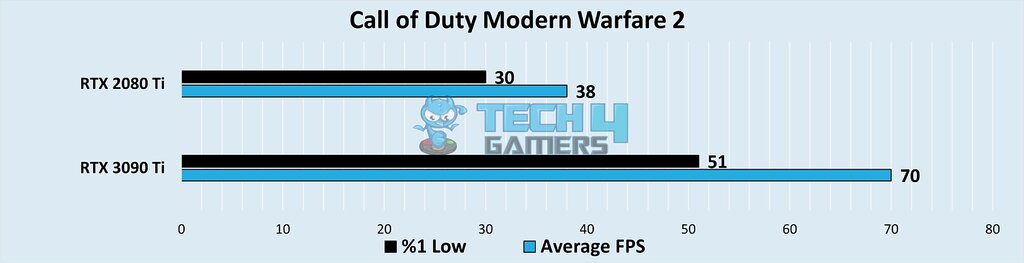
- Our benchmarks led the RTX 3090 Ti by a wide margin. It crushed the RTX 2080 Ti with 70 FPS, leaving the 2080 Ti’s 38 FPS far behind. This translates to a remarkable 59.2% average FPS improvement!
- Regarding 1% low FPS, the RTX 3090 Ti flexed its muscles, delivering 51 FPS. This represents a massive jump compared to the RTX 2080 Ti’s 30 FPS.
Red Dead Redemption 2
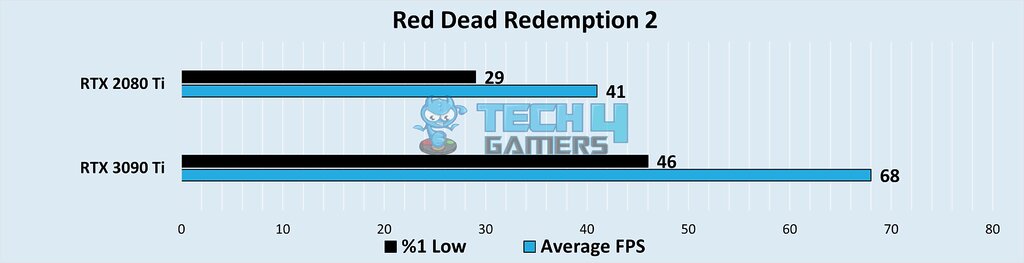
- The RTX 3090 Ti proves its superiority from the very first test. We recorded an incredible 68 FPS, a substantial 49.5% average FPS increase over the RTX 2080 Ti’s 41 FPS.
- The RTX 3090 Ti demonstrated its superiority in 1% low frame rate performance, delivering an impressive 46 FPS, significantly outperforming the RTX 2080 Ti’s 29 FPS.
Far Cry 6
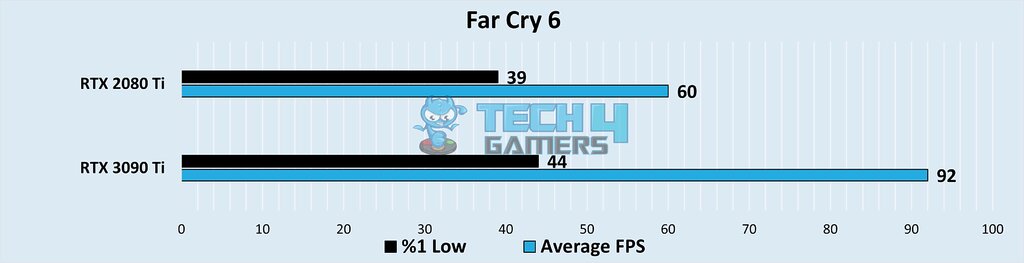
- We benchmarked the RTX 3090 Ti, and it was delivered! This card crushed it with 92 FPS, demonstrating a 42.1% average FPS advantage over the RTX 2080 Ti’s 60 FPS.
- The RTX 3090 Ti demonstrates strength in Far Cry 6 over the RTX 2080 Ti in a 1% low frame rate. It achieves a remarkable 44 FPS compared to the RTX 2080 Ti 39 FPS.
Hitman 3
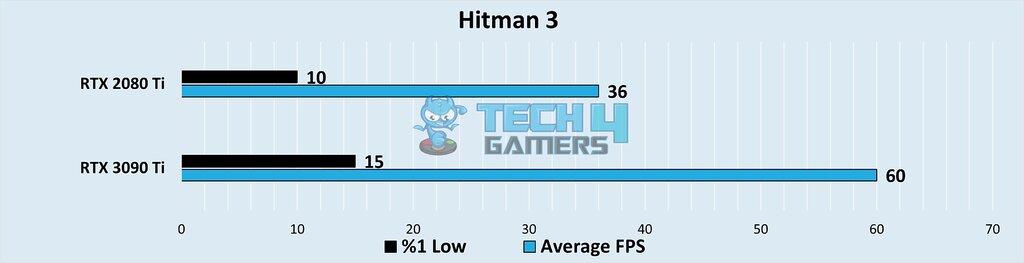
- The RTX 3090 Ti left the competition behind, scoring a decisive 60 FPS in our benchmarks. This represents a substantial 50% average FPS boost compared to the RTX 2080 Ti’s 36 FPS.
- The RTX 3090 Ti again established superiority in the Hitman 3 game an average 1% low FPS. It reaches 15 FPS, outpacing the RTX 2080 Ti 10 FPS.
Assassin’s Creed Valhalla
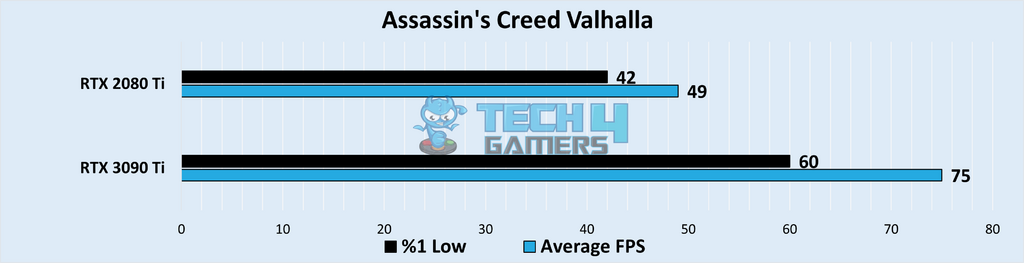
- The RTX 3090 Ti revealed its brilliance. It achieved a commendable 75 FPS, outperforming the RTX 2080 Ti 49 FPS and showcasing a significant 45.9% average FPS increase.
- The RTX 3090 Ti demonstrates its power in minimum FPS, delivering an impressive 60 FPS. In Assassin’s Creed, it marked a significant improvement over the RTX 2080 Ti 42 FPS.
Overall Gaming Performance
| Feature | RTX 3090 Ti | RTX 2080 Ti |
|---|---|---|
| Average FPS | 📈 76.7 | 📈 47.2 |
| 1% Lows | 📉 48.0 | 📉 34.1 |
| Winner: Nvidia GeForce RTX 3090 Ti | ||
Our benchmark analysis reveals that the RTX 3090 Ti is the best choice for discerning gamers seeking ultra-smooth, high-resolution performance. The 3090 Ti delivers a staggering 51.6% improvement in average FPS across various games we tested.
Power Consumption
| Game | RTX 2080 Ti Super (W) | RTX 3090 Ti (W) |
|---|---|---|
| God of War | 287.1 | 445.9 |
| Marvel's Spider-Man Remastered | 276.8 | 381.4 |
| Witcher 3 Next Gen | 269.4 | 438.2 |
| Call of Duty Modern Warfare 2 | 262.6 | 397.6 |
| Red Dead Redemption 2 | 272.8 | 418.6 |
| Far Cry 6 | 276.6 | 347.8 |
| Hitman 3 | 295.8 | 414.3 |
| Assassin's Creed Valhalla | 272.5 | 369.6 |
| Average Power Consumption | ⚡276.7 | ⚡401.6 |
| Winner: Nvidia GeForce RTX 2080 Ti | ||
The first outperformed the latter in the RTX 3090 Ti vs the RTX 2080 Ti. It comes with a trade-off in power efficiency. Our benchmark tests show that the RTX 2080 Ti consumes, on average, 37.5% less power than the RTX 3090 Ti. This could lead to significant savings on your electricity bill over time.
Thermal Efficiency
| Game | RTX 2080 Ti Super (Celsius) | RTX 3090 Ti (Celsius) |
|---|---|---|
| God of War | 63 | 70 |
| Marvel's Spider-Man Remastered | 64 | 66 |
| Witcher 3 Next Gen | 66 | 70 |
| Call of Duty Modern Warfare 2 | 66 | 69 |
| Red Dead Redemption 2 | 64 | 65 |
| Far Cry 6 | 64 | 66 |
| Hitman 3 | 61 | 64 |
| Assassin's Creed Valhalla | 65 | 69 |
| Average Temperature | 🌡️64.2 | 🌡️67.4 |
| Winner: Nvidia GeForce RTX 2080 Ti | ||
The RTX 2080 Ti is less power-hungry than the RTX 3090 Ti, translating to a 4.8% efficiency improvement in our tests. While this might seem minor, the lower operating temperatures of the 2080 Ti for gamers who prioritize quiet operation can produce quieter fan noise.
Pricing And Availability
| Graphics Card | Launch MSRP | Current Price |
|---|---|---|
| RTX 3090 Ti | 💲1899 | 💲1699 |
| RTX 2080 Ti | 💲999 | 💲589 |
| Difference | 47.39% | 65.33% |
These high-end graphics cards from NVIDIA arrived with substantial price tags, fluctuating depending on market conditions and demand. It’s important to note that the GeForce RTX 3090 Ti is roughly 60-70% more expensive than the RTX 2080 Ti. Remember, these estimations can change over time as market dynamics evolve.
What Would We Recommend?
RTX 3090 Ti: It is suitable for gamers who demand the absolute best performance and are willing to prioritize frame rates over budget considerations and thermals.
RTX 2080 Ti: It suits budget-minded gamers seeking a balance between performance and value. It’s a solid alternative if you want a performance boost while prioritizing power efficiency.
The ultimate decision depends on whether you prioritize raw performance, RTX 3090 Ti, or a balance of performance and affordability, RTX 2080 Ti.
More from RTX 3090 Ti:
More from RTX 2080 Ti:
Thank you! Please share your positive feedback. 🔋
How could we improve this post? Please Help us. 😔
[Comparisons Specialist]
I’m a passionate computer hardware expert specializing in CPUs and GPUs. With a lifelong curiosity for hardware and extensive hands-on experience, I provide valuable insights, practical advice, and in-depth analysis on these components. Engaging with the hardware community, I exchange knowledge and stay at the forefront of technological advancements.
Get In Touch: uzair@tech4gamers.com