AMD Radeon RX 7900 XTX
Rated: 8.8/10
NVIDIA GeForce RTX 3080 TI
Rated: 8.3/10
Pros And Cons
| GPU | Pros | Cons |
|---|---|---|
| RTX 3080 TI | ✅Ray Tracing and DLSS Support ✅Slightly More Power Efficient | ❌Inferior Gaming Performance |
| RX 7900 XTX | ✅Superior Gaming Performance ✅Cooler Running Temperatures | ❌Limited Ray Tracing and DLSS Support |
- The Radeon RX 7900 XTX consistently outperforms the GeForce RTX 3080 Ti by 42.23% across various gaming benchmarks.
- Despite similar TDP and PSU requirements, the RX 7900 XTX consumes around 3.4% less power on average and runs slightly cooler than the 3080 Ti.
- Priced at USD 930, the RX 7900 XTX is approximately 7.15% cheaper than the RTX 3080 Ti, which retails for USD 999.
- For superior gaming performance and better value for money, the Radeon RX 7900 XTX is recommended. However, if ray tracing and DLSS are priorities, the RTX 3080 Ti might be preferable.
Comparison Table
| Specs | AMD Radeon RX 7900 XTX | NVIDIA GeForce RTX 3080 TI |
|---|---|---|
| GPU Name | NAVI 31 XTX | GA 102 |
| Bus Interface | PCIe 4.0 x16 | PCIe 4.0 x16 |
| No. of transistors | 57,700 million | 28,300 million |
| RT Cores | 96 | 80 |
| TMUs | 384 | 320 |
| Best Variants | Best RX 7900 XTX Cards | Best RTX 3080 Ti Cards |
Architectural Differences
- Architecture: Radeon RX 7900 XTX utilizes AMD’s RDNA 3 architecture, while GeForce RTX 3080 Ti is based on Nvidia’s previous Ampere architecture.
- Clock Speed: The Radeon RX 7900 XTX boasts a base clock speed of 1855 MHz and a boost clock speed of 2499 MHz. In contrast, the GeForce RTX 3080 Ti operates at a lower base clock speed of 1365 MHz, with a boost clock speed of 1665 MHz.
- VRAM: The Radeon RX 7900 XTX provides 24 GB of GDDR6 memory and the GeForce RTX 3080 Ti offers half of that at 12 GB of GDDR6X memory.
- Process Size: The Radeon RX 7900 XTX utilizes the smaller 5 nm TSMC chip, while the GeForce RTX 3080 Ti relies on the older 8 nm Samsung manufacturing process.
- TDP: The Radeon RX 7900 XTX features a TDP of 355 watts, slightly higher than the GeForce RTX 3080 Ti’s TDP of about 350 watts.
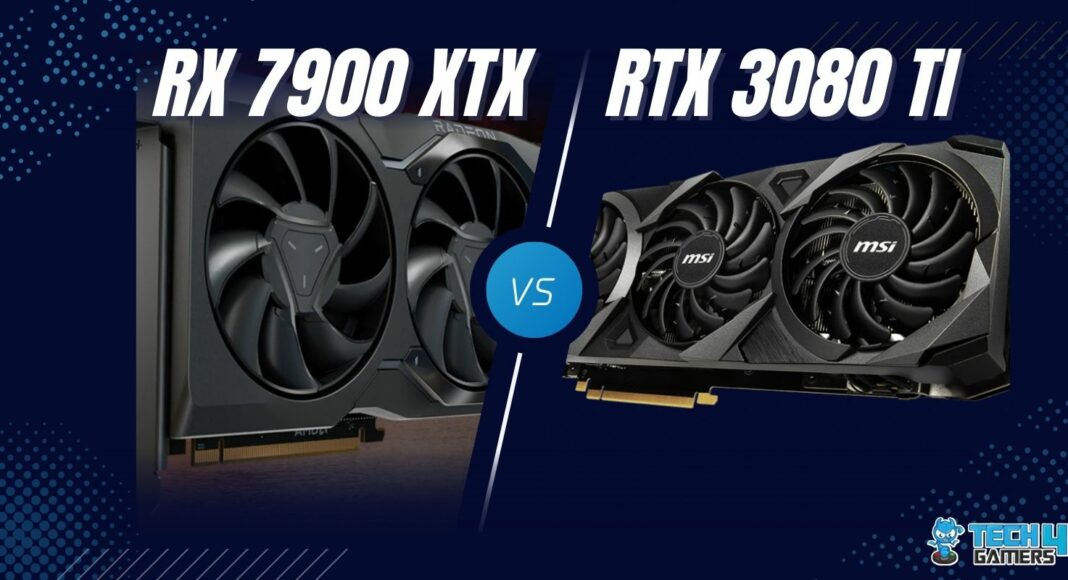
In this article, we’re going to write a detailed guide comparing the RX 7900 XTX vs RTX 3080 Ti GPU to help you pick the best one for your computer setup. We’ll explain how they’re different and what kind of gaming performance you can expect from each of them.
Gaming Performance Benchmarks
From what we have seen, it is pretty evident that the 7900 XTX is ahead of the 3080 Ti in more than a few ways. However, it is one thing to be good on paper and another to be good in real-life tasks such as gaming. For this purpose, we will let these GPUs lock horns against each other in some of the recent games.
Testing Rig
- CPU: Intel Core i7 13700k
- Motherboard: ASRock Z790 Taichi Lite Motherboard
- CPU Cooler: Deepcool Assassin II CPU Cooler
- RAM: XPG Lancer RGB 32GB 7200MHz DDR5 Ram
- PSU: ENERMAX REVOLUTION D.F. X 1050W
Cyberpunk 2077

- In Cyberpunk 2077 at 2160p, the 7900 XTX outperformed the 3080Ti by around 35%, delivering an average of 70 FPS compared to 49 FPS.
- The 1% lows of the 7900 XTX were notably superior, with 54 FPS compared to the 3080Ti’s 35 FPS, providing a smoother gaming experience overall.
Horizon Zero Dawn

- In this game, the 7900 XTX maintained its lead with a significant margin of 28%, hitting an impressive average of 118 FPS compared to the 3080 Ti’s 89 FPS.
- In terms of 1% lows, the 7900 XTX still held an advantage, with a difference of around 19%, delivering 86 FPS, while the 3080 Ti lagged at 71 FPS.
Watch Dogs Legion

- In the Watch Dogs Legion, the 7900 XTX led with a significant 42% gap in average FPS, delivering a smooth 120 FPS experience, while the 3080 Ti fell short at only 78 FPS.
- The 1% lows also favored the 7900 XTX with a notable difference of 44%, providing an average of 96 FPS compared to the 3080 Ti’s 61 FPS.
Call Of Duty Warzone 2

- Here, the 7900 XTX maintained a lead with an impressive margin of 42.18%, boasting an average of 155 FPS compared to the 3080 Ti’s struggle at 101 FPS.
- The performance gap extended to 1% lows as well, with the 7900 XTX leading by a substantial 48%, delivering 155 FPS, leaving the 3080 Ti far behind at just 76 FPS.
Hitman 3

- In Hitman 3 at 2160p, the 7900 XTX dominated with a 51% lead over the 3080 Ti, delivering a comfortable 162 FPS compared to the 3080 Ti’s struggle at 96 FPS.
- Talking about the 1% lows, the 7900 XTX leads by 53.52%, ensuring smoother gameplay with 135 1% low FPS compared to the 3080 Ti’s 78 FPS.
Call Of Duty Modern Warfare 2

- In this benchmark, the 7900 XTX dominates the 3080 Ti with an astonishing 67% lead in average FPS, hitting a respectable 143 FPS compared to the 3080 Ti’s 71 FPS.
- The 1% lows paint a similar picture, with the 7900 XTX leading by a significant 66%, delivering 115 FPS compared to the 3080 Ti’s 58 FPS.
Assassin’s Creed Valhalla

- In the Assassin’s Creed Valhalla 2160p benchmark, the 7900 XTX stayed 33% ahead with 115 FPS, while the 3080 Ti trailed at 82 FPS.
- In 1% lows, the 7900 XTX led by 21%, delivering 83 FPS compared to the 3080 Ti’s 67 FPS.
Dying Light 2

- In our last game, the 7900 XTX maintained a modest lead of around 30% in average FPS, hitting 82 FPS compared to the 3080 Ti’s 60 FPS.
- Similarly, in 1% lows, the 7900 XTX held an advantage of approximately 33%, providing smoother gameplay with 66 FPS compared to the 47 FPS of the 3080 Ti.
Overall Gaming Performance
| Featured | RTX 3080 TI | RX 7900 XTX |
|---|---|---|
| Average FPS | 80.75📈 | 124📈 |
| %1 lows | 63📉 | 98📉 |
| Winner: AMD's RX 7900 XTX | ||
The 7900 XTX surpassed the 3080 Ti by a larger margin of approximately 42.23%. Across 8 different tested titles, it averaged 124 FPS, compared to the 3080 Ti’s 80.78 FPS. The disparity was similarly notable in 1% lows, with the 7900 XTX being 43.47% faster, delivering a mean of 98 FPS compared to the 3080 Ti’s 63 FPS across the same games at 2160p resolution.
Power Consumption
| Featured | RTX 3080 TI (W) | RX 7900 XTX (W) |
|---|---|---|
| Average Power Consumption | 571⚡️ | 597⚡️ |
| Winner: NVIDIA's RTX 3080 TI | ||
With the RX 7900 XTX, our system drew approximately 597 watts, while the 3080 Ti system averaged 571 watts. The 3080 Ti proved slightly more power-efficient, drawing 3.4% less power and boasting a slightly smaller TDP. However, considering the performance gains offered by the 7900 XTX, it appears to be a more than fair tradeoff.
Thermal Efficiency
| Featured | RTX 3080 TI (°C) | RX 7900 XTX (°C) |
|---|---|---|
| Average Temperature | 75🌡️ | 71.2🌡️ |
| Winner: AMD's RX 7900 XTX | ||
Pricing And Availability
| GPU | MSRP | Current Price |
|---|---|---|
| RTX 3080 TI | 💲1199 | 💲999 |
| RX 7900 XTX | 💲999 | 💲930 |
| Difference | 18% | 7.15% |
At the moment, the 7900 XTX is valued at $930, whereas the 3080 Ti is listed at $999, reflecting a 7.15% price difference between the two GPUs.
Final Verdict – What We Recommend?
AMD Radeon RX 7900 XTX: The Radeon RX 7900 XTX is good at gaming, performing much better than the NVIDIA GeForce RTX 3080 Ti by a big 42.23%. It uses about 3.4% less power on average and stays a bit cooler. This means it’s not only powerful but also efficient, which is great for gamers.
NVIDIA GeForce RTX 3080 Ti: While the RTX 3080 Ti presents competitive gaming performance, it falls short compared to the RX 7900 XTX, particularly in terms of raw gaming power. However, if features like ray tracing and DLSS are priorities for your gaming setup, the RTX 3080 Ti remains a viable option.
Overall, for gamers seeking uncompromising performance and efficiency without breaking the bank, the Radeon RX 7900 XTX emerges as the top choice. However, if specific features offered by the RTX 3080 Ti are essential to your gaming experience, it remains a worthy alternative.
More From RX 7900 XTX
More From RTX 3080 Ti
Thank you! Please share your positive feedback. 🔋
How could we improve this post? Please Help us. 😔
[Comparisons Expert]
Abdemanaf is a skilled creative writer who has been honing his craft since 2011. While initially working in different fields, he found a passion for technology and has been exploring the tech world since early 2015. Over the years, he has developed an in-depth knowledge of the latest tech trends and product offerings by various companies.
Abdemanaf’s writing reflects his analytical mindset and ability to think critically. He has a knack for breaking down complex technical information into easily digestible pieces, making his articles engaging and accessible to readers from all backgrounds. In February 2022, he joined Tech4Gamers as a blog and product comparison writer, where he has been able to hone his skills further.
As a writer, Abdemanaf is dedicated to staying up-to-date with the latest technological advancements and trends, enabling him to provide readers with the most relevant and accurate information. He is always eager to learn more and is constantly seeking new challenges to improve his skills.
Get In Touch: manaf@tech4gamers.com


![Core i5 14600K Vs Ryzen 7 7700X [10 Games Tested]](https://tech4gamers.com/wp-content/uploads/2023/12/14600K-v-7700X-featured-image-218x150.jpg)
