 Threads

After the release of the concerningly expensive RTX 4080, consumers have been looking for cheaper alternatives to high-end cards from generations past. This guide will evaluate the performance RTX 4080 vs RTX 3080 Ti to help you make the correct purchasing decision.
Key Takeaways
- On average, the RTX 4080 had a 36% higher performance than the RTX 3080 Ti in our gaming tests.
- Power consumption was around 13% lower on the RTX 4080 during our tests as well, on average.
- The temperatures were around 3°C cooler on the newer card in our benchmarks.
Comparison Table
| Feature | NVIDIA RTX 4080 | NVIDIA RTX 3080 Ti |
|---|---|---|
| Cores | CUDA® Cores: 9728 Tensor cores: 304 RT cores: 76 | CUDA® Cores: 10240 Tensor cores: 320 RT cores: 80 |
| Temperature | Max Temperature: 90 °C | Max Temperature: 93 °C |
| Memory Speed and Bandwidth | Memory Speed: 22.4 GB/s Bandwidth: 912 GB/s | Memory Speed: 19 GB/s Bandwidth: 717 GB/s |
| Launch MSRP | $1199 | $1199 |
| Launch Date | November 16, 2022 | June 3, 2021 |
| Best Variants | RTX 4080 | RTX 3080 Ti |
Architectural Differences
- Core Clocks: Though the RTX 4080 has a significantly lower number of cores than its competition, it makes up for it with a frequency of anywhere from 2205MHz to 2505MHz. The RTX 3080 Ti, however, clocks in at a frequency of 1370MHz to 1667MHz.
- Process Nodes: The RTX 3080 Ti uses a fairly modern 8nm manufacturing process, whereas the RTX 4080 one-ups it with its 4nm lithography, allowing for great efficiency.
- TDP: The RTX 3080 Ti has a rather high TDP of 350 watts, whereas the RTX 4080 improves on this with a slightly lower TDP of 320 watts. The actual power consumption of these cards can fluctuate quite a bit, which we will see in the power consumption section of this comparison.
- Memory: The VRAM capacity on the RTX 3080 Ti is 12GB, while the RTX 4080 improves on this again with a capacity of 16GB. Both use GDDR6X memory, but the older GPU has a wider bus.
- Other Features: Both cards are more or less matched in terms of features, except for one. The RTX 4080 can utilize AI to interpolate frames between traditionally generated frames to improve its framerate using Nvidia DLSS 3. Sadly, this feature does not make its way to the older card.
Gaming Benchmarks
To exemplify the difference in performance you may expect between these two graphics cards, we placed both cards into our trusty test bench, the specifications of which you can read below.
Test PC Specs
- OS: Windows 11
- CPU: Intel Core i7-13700K
- Motherboards: ASRock Z790 Taichi Lite Motherboard
- RAM: Kingston Fury Renegade RGB DDR5 32GB 7200MHz
- SSD: XPG GAMMIX S70 BLADE 2TB NVMe SSD
- PSU: Enermax Revolution D.F. X 1050W
- CPU Cooler: MSI MAG CORELIQUID E360 CPU Liquid Cooler
- Resolution: 4k
A Plague Tale: Requiem
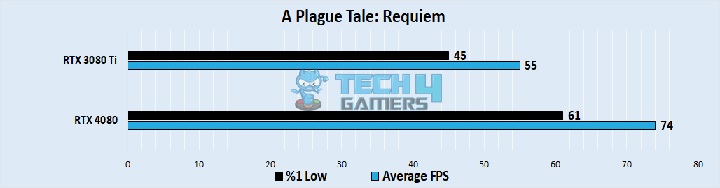
- When we tested A Plague Tale Requiem on both cards, the RTX 4080 was ahead by a country mile. The average of this card was close to 74 FPS, while the RTX 3080 Ti came in at around 55 FPS on average.
- The 1% lows did not save the older card, as it dipped to around 45 FPS consistently, while the RTX 4080 only went down to around 61 FPS.
Diablo® II: Resurrected
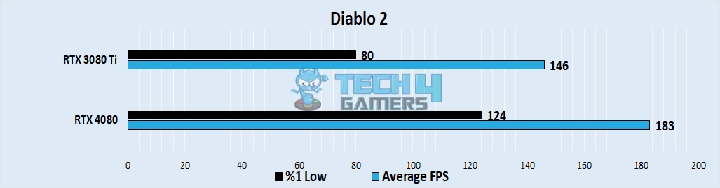
- Diablo II did not perform any better on the older card, averaging a framerate of only 146 FPS, while our test of the RTX 4080 showed a much better average of around 183 FPS.
- The 1% lows were around 124 FPS on the 40 series card, while the RTX 3080 was much further behind with lows of around 80 FPS.
Fortnite
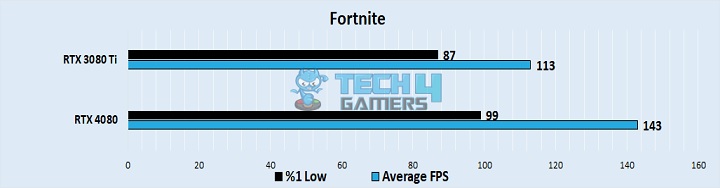
- Our test of Fortnite continued to show us discrepancies between these two GPUs, with average framerates of around 143 FPS, while the RTX 3080 Ti had averages close to 113 FPS.
- The difference in 1% lows was more bearable between the two cards in this game, around 99 FPS for the RTX 4080, and around 87 FPS for the RTX 3080 Ti.
Microsoft Flight Simulator 2020
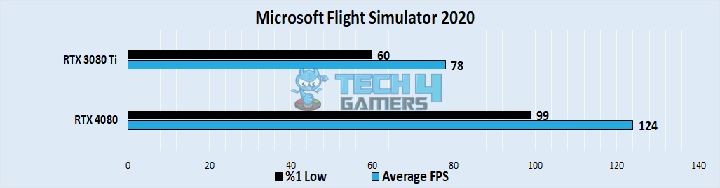
- The differences amped up again in our test of Microsoft Flight Simulator 2020, where the RTX 4080 averaged a framerate of 124 FPS while cruising in the sky, whereas the RTX 3080 Ti only managed a framerate of 78 FPS.
- The 1% lows were no better, with the RTX 4080 hanging around 99 FPS while the RTX 3080 Ti was touching 60 FPS.
Minecraft
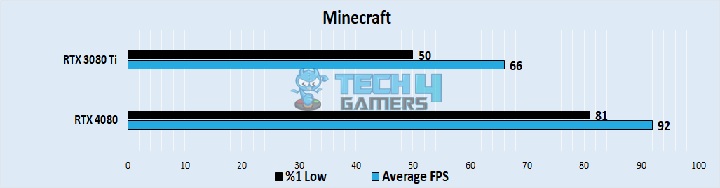
- With SIldur’s Extreme shaders, the RTX 4080 had an average framerate of around 92 FPS in our test of Minecraft, while the RTX 3080 Ti came in at an average framerate of around 66 FPS in our test.
- The 1% lows hung around 81 FPS for the newer card, whereas the RTX 3080 Ti gave a minimum performance of 50 FPS.
Spiderman
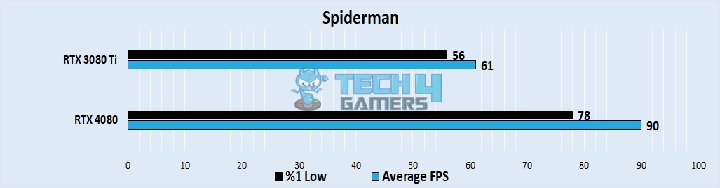
- For the last game of our tests, we witnessed an average framerate of 90 FPS while swinging through New York in Marvel’s Spiderman using the RTX 4080, while the RTX 3080 Ti had an average of only 61 FPS.
- The 1% lows were around 78 FPS on the newer card, while the RTX 3080 Ti managed to get lows of around 56 FPS.
Overall Gaming Performance
We will talk about the overall gaming performance of the RTX 4080 vs RTX 3080 Ti in terms of frames per second and the time of each frame.
Framerate
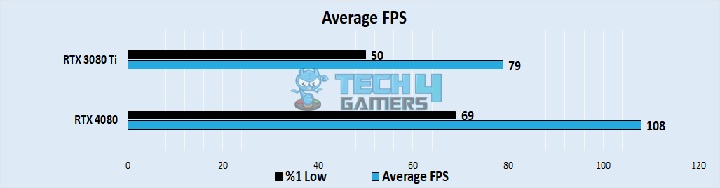
After testing various games, the tally of the RTX 3080 Ti came to around 79 FPS on average in our evaluation, while the RTX 4080 managed an average of 108 FPS, around 36% higher than that of the older card.
The 1% lows had a drastic difference between the two cards as well, with the RTX 4080 hanging out around 69 FPS, while the RTX 3080 Ti had minimums closer to 50 FPS.
All in all, it was much more pleasant to use the RTX 4080 in games than its rival for this comparison.
Power Consumption
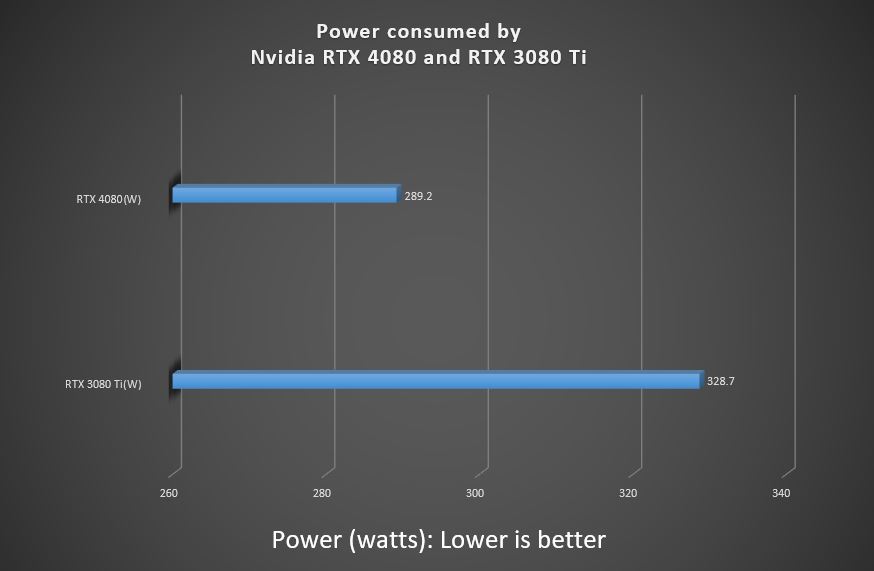
Despite giving a lot better performance, the RTX 4080 did not consume more power than the older card, averaging only 289 watts. In contrast, the RTX 3080 Ti had a power consumption of around 329 watts, around 13% greater than the RTX 4080.
Thermal Efficiency
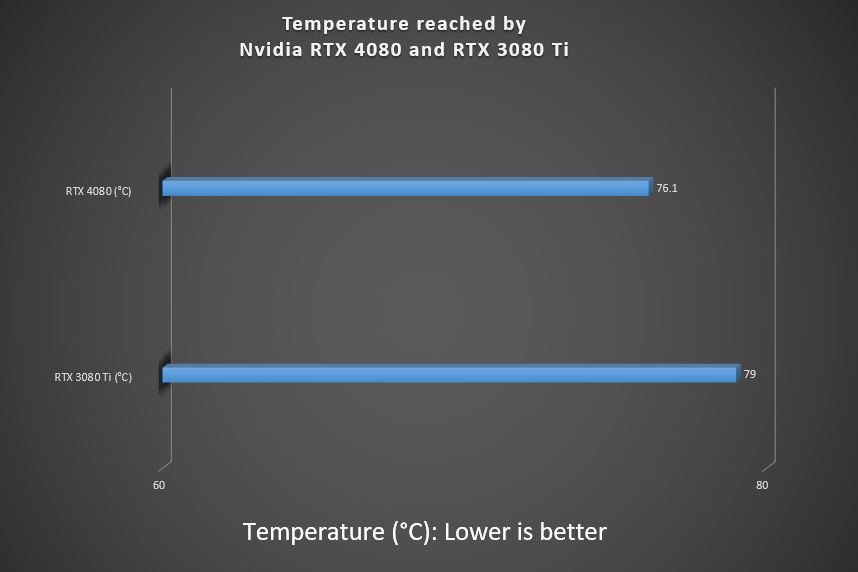
The RTX 4080 showed no weakness in its thermal management either, averaging a peak temperature of around 76°C in our testing, while the RTX 3080 Ti averaged a peak of around 79°C.
Many factors can affect the thermal performance of your graphics cards, so you might experience totally different numbers than what we’re seeing here if you choose to purchase either.
Price and Availability
You can buy an RTX 4080 for around $1199 in most configurations, while the price might vary from variant to variant. The RTX 3080 Ti, however, comes in at around $1000 for new cards, according to PC part picker, though it can also very easily reach the price of the RTX 4080.
Both cards are very popular and should be accessible at any nearby computer parts store.
RTX 4080 Vs RTX 3080 Ti: What We Recommend
Now that we’ve seen the ins and outs of both cards, this part of the comparison will deal with the decision between the two graphics cards.
Despite what we expected, the RTX 4080 turned out to be a great upgrade to the last generation of high-end graphics cards, despite coming in at pricing expected from the tier above. Unless you are buying used, the performance uplift of the RTX 4080 justifies its cost, at least in the GPU market as of writing this comparison.
If you buy used, the RTX 3080 Ti can give you amazing bang for the buck, but the price of the card in unused condition has yet to come down to being reasonable enough to buy.
Pros And Cons
| Nvidia GeForce RTX 4080 | Nvidia GeForce RTX 3080 Ti | ||
|---|---|---|---|
| Pros | Cons | Pros | Cons |
| Higher performance Lower temperatures and power consumption | Abismal price | Relatively cheap if you buy in used condition | Significantly lower performance Higher temperatures and power consumption |
Common Questions Answered
The RAM of the Nvidia RTX 4080 is 16 GB with 256-Bit interface width, a memory speed of 22.4 GB/s, and a bandwidth of 912 GB/s. The 12 GB variant of RTX 4080 was declared not to launch.
Yes, the RTX 3080 Ti is unlocked for overclocking.
The RTX 4080 has the current Ada Lovelace architecture. The chip used for it is AD-103, which is simulated at TSMC in a 4 nm fabrication process.
The RTX 4080 is better among the two graphics cards. Its performance is 35-40% better than the RTX 3080 Ti.
More From RTX 3080 Ti
More From RTX 4080
Thank you! Please share your positive feedback. 🔋
How could we improve this post? Please Help us. 😔
[Comparisons Expert]
Abdemanaf is a skilled creative writer who has been honing his craft since 2011. While initially working in different fields, he found a passion for technology and has been exploring the tech world since early 2015. Over the years, he has developed an in-depth knowledge of the latest tech trends and product offerings by various companies.
Abdemanaf’s writing reflects his analytical mindset and ability to think critically. He has a knack for breaking down complex technical information into easily digestible pieces, making his articles engaging and accessible to readers from all backgrounds. In February 2022, he joined Tech4Gamers as a blog and product comparison writer, where he has been able to hone his skills further.
As a writer, Abdemanaf is dedicated to staying up-to-date with the latest technological advancements and trends, enabling him to provide readers with the most relevant and accurate information. He is always eager to learn more and is constantly seeking new challenges to improve his skills.
Get In Touch: manaf@tech4gamers.com


