")


AMD Ryzen 9 7900X3D
Rated: 7.5/10
Intel Core i9 13900K
Rated: 7/10
Pros & Cons
| CPU | Pros | Cons |
|---|---|---|
| Core i5 13900K | ✅Higher specification of memory ✅Option to use DDR4 or DDR5 RAM | ❌Slightly lower performance |
| Ryzen 9 7900X3D | ✅Slightly higher performance ✅Larger L3 cache size | ❌Smaller memory bandwidth |
- The gaming performance of AMD Ryzen 9 7900X3D is approximately 2% better than the Core i9-13900K, a miniscule difference.
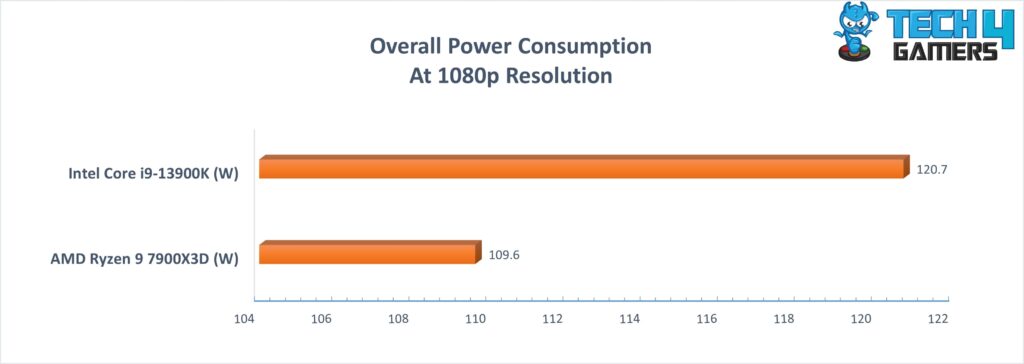
- Considering power consumption, the Ryzen 9 7900X3D is about 10.3% more power efficient than the Core i9-13900K. Also, the Core i9-13900K typically remains 3.4% cooler.
- The 13900K is around 21% more expensive than the 7900X3D, despite performing slightly worse.
- The Ryzen 9 7900X3D offers more value for money and is available at a much cheaper price tag as compared to the i9 13900K.
Comparison Table
| Technical Specs | Core i9 13900K | Ryzen 9 7900X3D |
|---|---|---|
| Socket | Intel Socket LGA-1700 | AMD Socket AM5 |
| Codename | Raptor Lake | Zen 4 (Raphael) |
| Efficiency Core Threads | - | 16 |
| Shader Units | 128 | 256 |
| L3 Cache | 36MB shared | 128MB shared |
| tJMax | 100°C | 89°C |
| Release Date | Oct 2022 | Feb 2023 |
| Texture Units | 16 | 8 |
| Best Cooler | Best CPU Coolers for Core i9-13900K | Best CPU Coolers For Ryzen 9 7900X3D |
Architectural Differences
- Core Count: The Ryzen 9 7900X3D uses 12 cores totaling 24 threads, while the Core i9 13900K combines 8 performance cores and 4 efficiency cores to total 16 threads.
- Clock Speeds: The Ryzen 9 7900X3D has a base clock of 4.4 GHz, with an all-core boost of up to 5.6 GHz, while the Core i9 13900K has a base clock of 3.0 GHz, and it maxes out around 5.4 GHz.
- Processing nodes: The Ryzen 9 7900X3D uses 5nm processing nodes, which are more efficient than the 10nm processing nodes found on the Core i9 13900K.
- TDP: The AMD chip has a max boost TDP of 120 watts, whereas the 13900K has a max TDP of 125 watts.
Gaming Benchmarks – 1080p
After reviewing their precise specs and productivity performance comparison, let us compare the gaming performance of the Ryzen 9 7900X3D vs Core i9-13900K. All the games were played at 1080p resolution. The system used while playing games had the following specifications.
Test Bench Specs
- OS: Windows 11
- Motherboard: MSI MEG X670E ACE/ Asus ROG Strix Z790 – E Gaming
- GPU: Asus TUF Gaming RTX 4090 24GB
- RAM: Corsair Dominator Platinum RGB 32GB DDR5 6000MHz RAM
- SSD: XPG GAMMIX S70 BLADE 2TB NVMe
- PSU: ENERMAX REVOLUTION D.F. X 1050W
- CPU Cooler: Corsair ICUE H150I Elite
Assassin’s Creed Valhalla
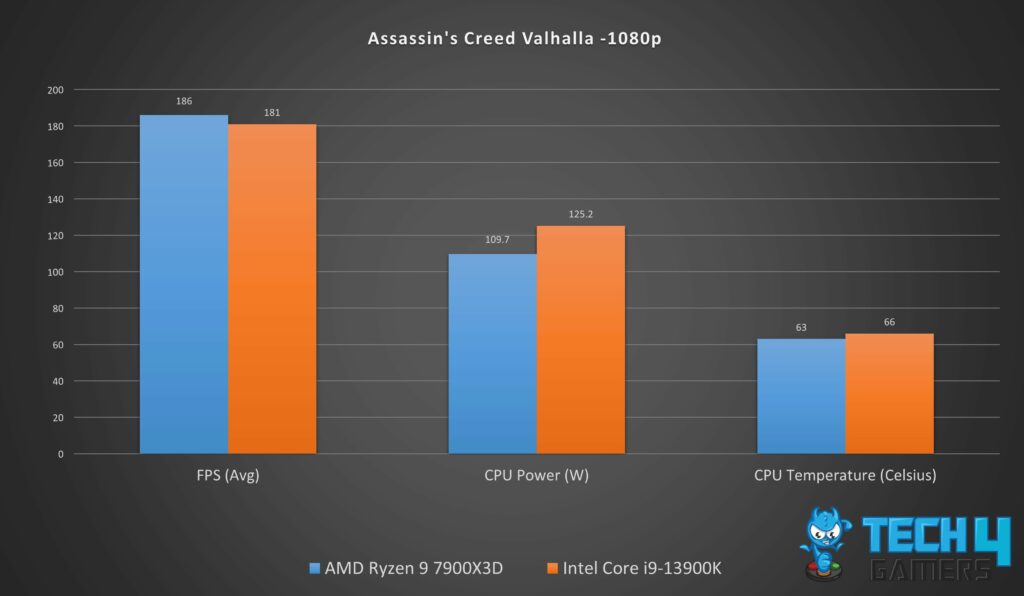
- While testing, we observed that the AMD Ryzen 9 7900X3D outperformed the Core i9-13900K by 2.8% in the highly intensive Assassin’s Creed Valhalla, achieving a superb average of 186 FPS compared to the Core i9-13900K’s 181 FPS.
Cyberpunk 2077
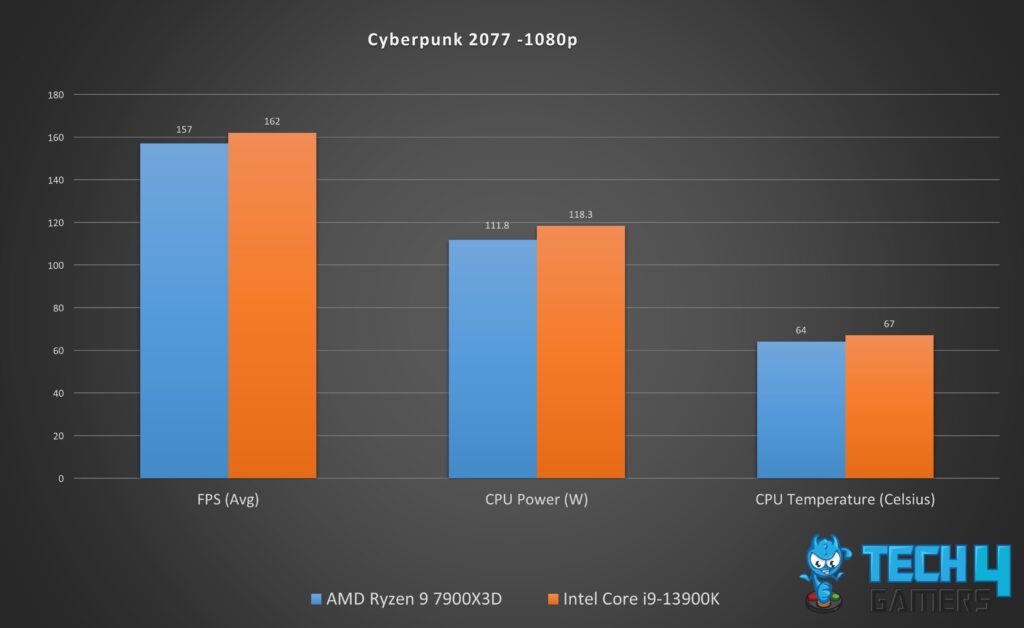
- In our test of Cyberpunk 2077, the Intel Core i9-13900K outperformed the Ryzen 9 7900X3D by 3.2%. The Core i9-13900K achieved an average frame rate of 162 FPS, while the Ryzen 9 7900X3D produced an average of 157 FPS.
Far Cry 6
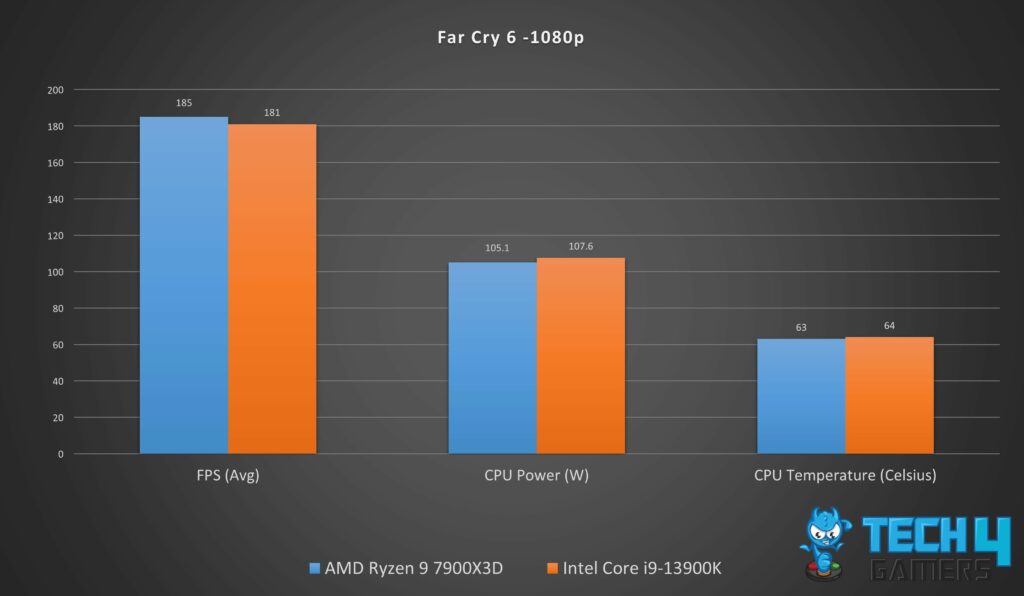
- While testing, the Ryzen 9 7900X3D outperformed the Core i9-13900K by 2.2% in Far Cry 6, achieving an average frame rate of 185 FPS compared to the Core i9-13900K’s 181 FPS.
Forza Horizon 5
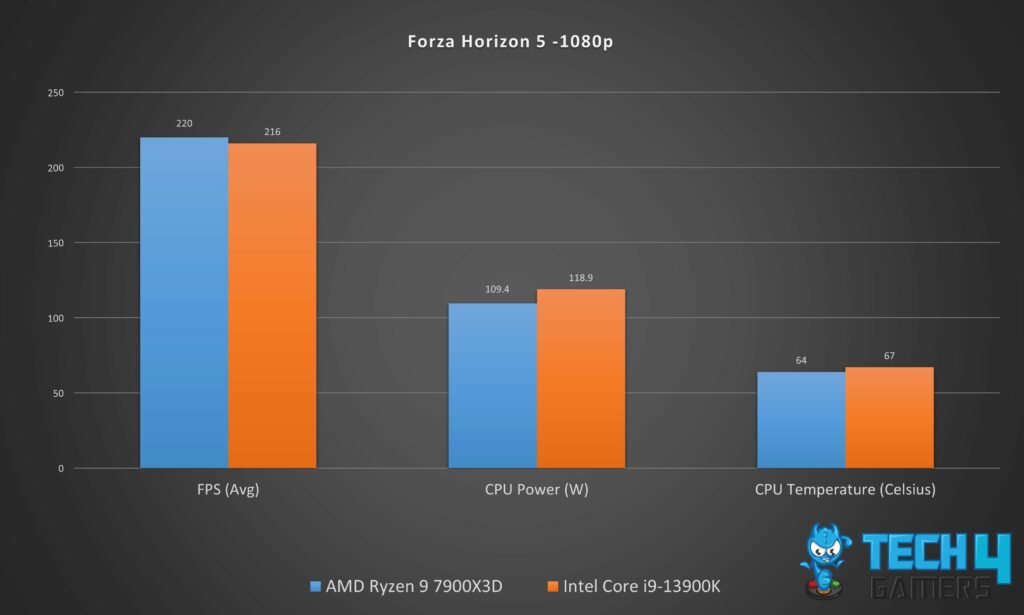
- While testing, the Ryzen 9 7900X3D outperformed the Core i9-13900K by 1.85% in Forza Horizon 5, achieving an average frame rate of 220 FPS compared to the Core i9-13900K’s 216 FPS.
God Of War
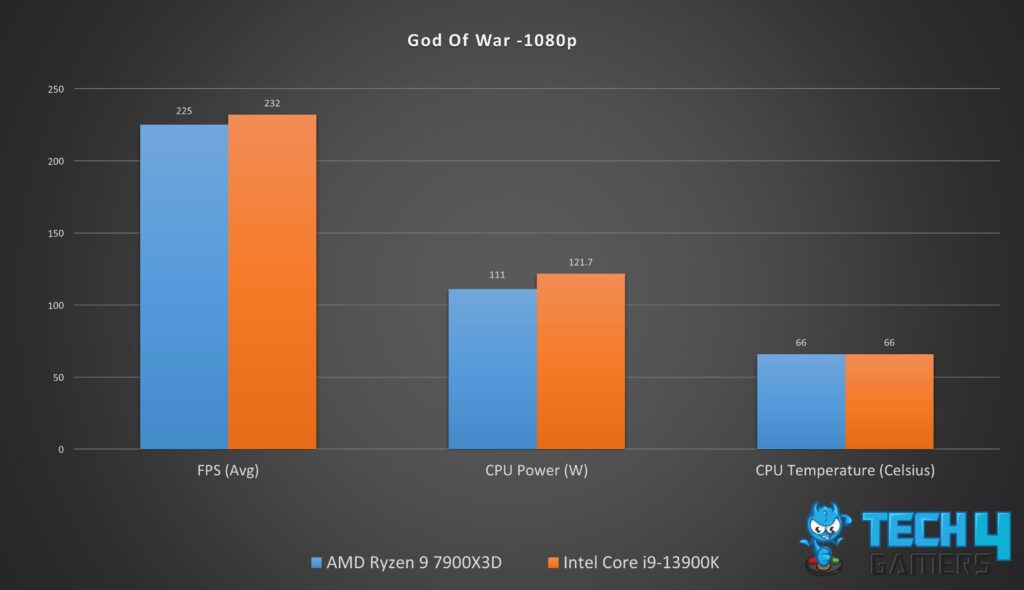
- During testing, the Core i9-13900K outperformed the Ryzen 9 7900X3D by 3.11% in God Of War, achieving an average frame rate of 232 FPS compared to the Ryzen 9 7900X3D’s 225 FPS.
Hitman 3
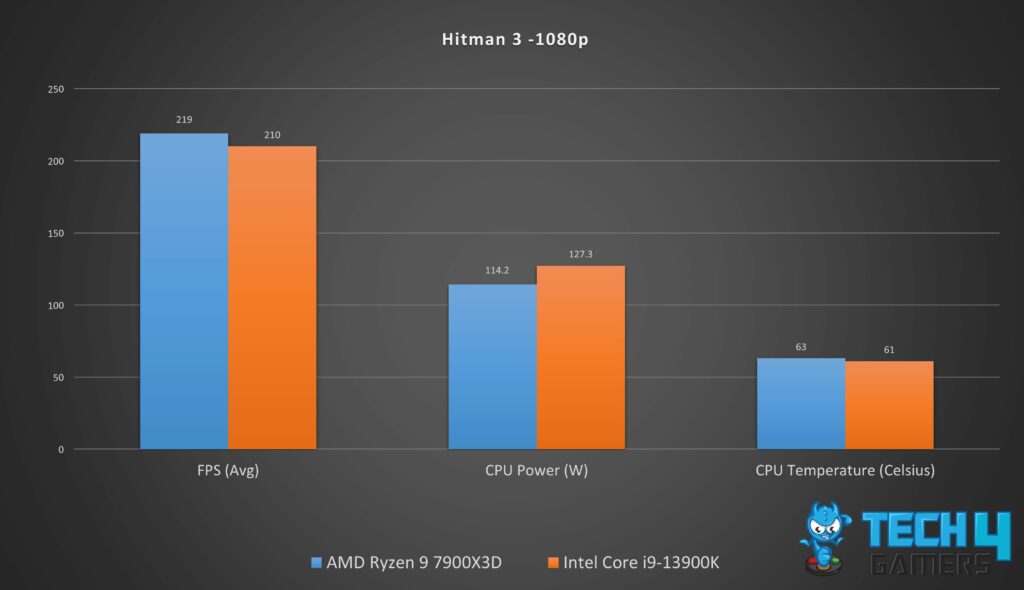
- In our test, the AMD chip outperformed the intel’s i9-13900K by 4.3% in Hitman 3, achieving an average frame rate of 219 FPS compared to the Core i9-13900K’s 210 FPS.
Horizon Zero Dawn
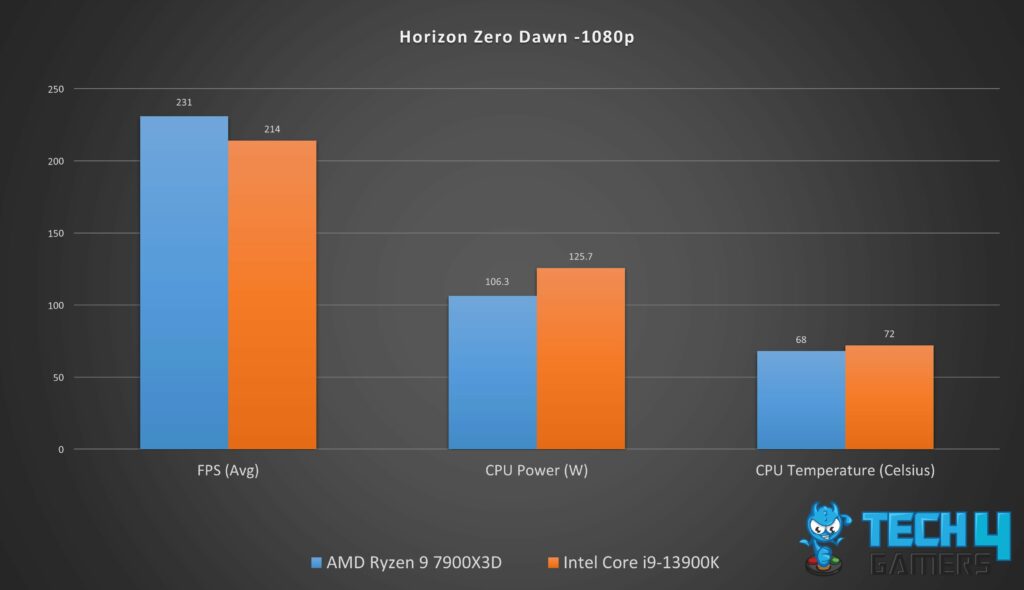
- In our test, the Ryzen 9 7900X3D outperformed the Core i9-13900K by 7.94% in Horizon Zero Dawn, with an average frame rate of 231 FPS compared to 214 FPS.
Overall Gaming Analysis
| Featured | Core i9 13900K | Ryzen 9 7900X3D |
|---|---|---|
| Average FPS | 199.4 📈 | 203.3 📈 |
| Winner: AMD's Ryzen 9 7900X3D | ||
The Ryzen 9 7900X3D held a slight gaming performance edge over the Core i9-13900K, with a 1.96% lead in average FPS at 1080p. Despite occasional wins by the i9-13900K in specific games, the Ryzen’s superior average frame rate reinforced its gaming performance advantage.
Power Efficiency
Price And Availability
| CPU | Launch MSRP | Current Price |
|---|---|---|
| Core i9 13900K | 💲599 | 💲522 |
| Ryzen 9 7900X3D | 💲599 | 💲409 |
| Difference | 0% | 21.65% |
Price and accessibility are key when choosing a processor. Initially priced similarly, the Ryzen 9 7900X3D and Core i9-13900K offer competitive options. The Ryzen 9 7900X3D is now more affordable, while the i9-13900K remains popular. Both are readily available through leading online retailers.
Which One Should You Go For?
Ryzen 9 7900X3D: The Ryzen 9 7900X3D features 12 cores and 24 threads with a maximum clock speed of 5.6 GHz. It offers slightly better gaming performance compared to the Core i9-13900K, along with superior efficiency in gaming power and thermal management.
Core i9-13900K: The Core i9-13900K boasts 24 cores and 32 threads, with a turbo clock reaching up to 5.8 GHz. While its gaming performance slightly lags behind the Ryzen 9 7900X3D, it excels in general use and tasks requiring higher core counts.
Based on the comparison, we recommend the Ryzen 9 7900X3D for gaming due to its superior performance and affordability. However, if you need a processor for tasks requiring higher core counts and general use, the Core i9-13900K would be a better albeit pricier option.
Thank you! Please share your positive feedback. 🔋
How could we improve this post? Please Help us. 😔
[Comparisons Expert]
Abdemanaf is a skilled creative writer who has been honing his craft since 2011. While initially working in different fields, he found a passion for technology and has been exploring the tech world since early 2015. Over the years, he has developed an in-depth knowledge of the latest tech trends and product offerings by various companies.
Abdemanaf’s writing reflects his analytical mindset and ability to think critically. He has a knack for breaking down complex technical information into easily digestible pieces, making his articles engaging and accessible to readers from all backgrounds. In February 2022, he joined Tech4Gamers as a blog and product comparison writer, where he has been able to hone his skills further.
As a writer, Abdemanaf is dedicated to staying up-to-date with the latest technological advancements and trends, enabling him to provide readers with the most relevant and accurate information. He is always eager to learn more and is constantly seeking new challenges to improve his skills.
Get In Touch: manaf@tech4gamers.com


